
Technology, Media and Telecom
5th MayPricing Strategy for Semiconductor Components
3 Min Read
The Recommendation Engine Market Report is Segmented by Deployment Mode (Cloud, On-Premise), Recommendation Approach (Collaborative Filtering, Content-Based Filtering, and More), End-User Industry (Retail and ECommerce, Media and Entertainment, and More), Application Channel (Web and Mobile Apps, Email/Push Notifications, , and More), and Geography. The Market Forecasts are Provided in Terms of Value (USD).
Market Overview
| Study Period | 2019 - 2030 |
|---|---|
| Market Size (2025) | USD 9.15 Billion |
| Market Size (2030) | USD 38.18 Billion |
| Growth Rate (2025 - 2030) | 33.06 % CAGR |
| Fastest Growing Market | Asia-Pacific |
| Largest Market | Asia-Pacific |
| Market Concentration | Medium |
Major Players *Disclaimer: Major Players sorted in no particular order. Image © Mordor Intelligence. Reuse requires attribution under CC BY 4.0. |
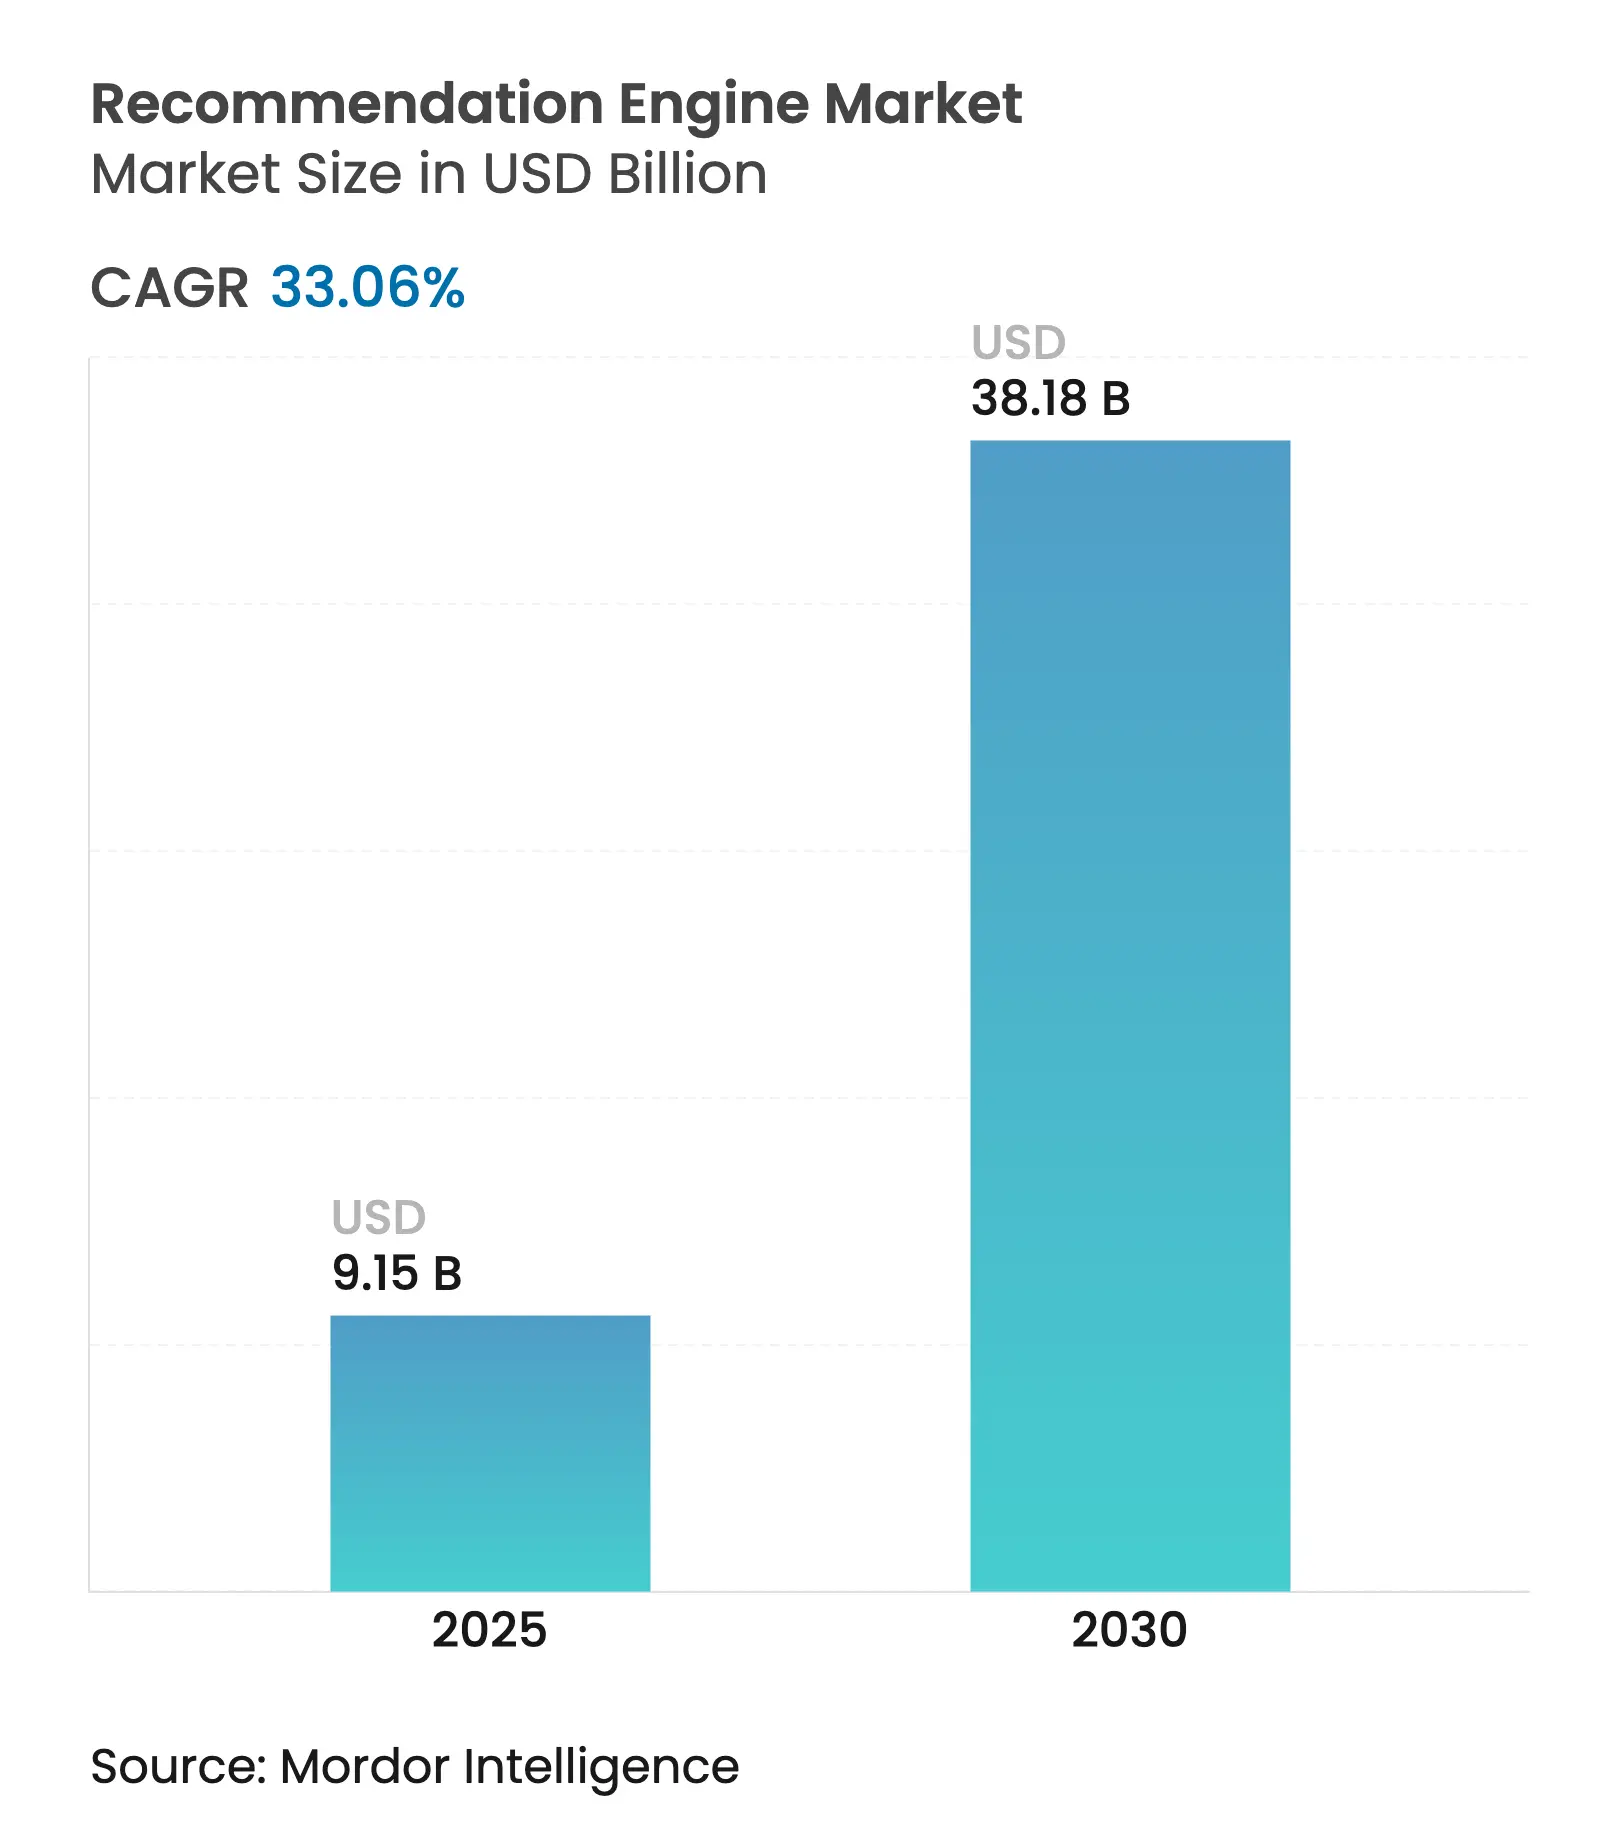
The recommendation engine market size stands at USD 9.15 billion in 2025 and is projected to reach USD 38.18 billion by 2030, reflecting a 33.06% CAGR. Consistent investment in AI-driven personalization, the maturation of headless commerce stacks, real-time streaming data, and explainable AI are steering growth. Enterprises view recommendation engines as revenue infrastructure, pushing cloud spending higher and encouraging multi-algorithmic experimentation. Regulatory encouragement for privacy-preserving data practices, coupled with rising zero-party data strategies, broadens deployment across retail, healthcare, and financial services. Consolidation among cloud hyperscalers is changing competitive dynamics, while SMEs face cost hurdles linked to real-time feature stores and compliance with emerging AI regulations.
Key Report Takeaways
Driver Impact Analysis
| Driver | (~) % Impact on CAGR Forecast | Geographic Relevance | Impact Timeline | |||
|---|---|---|---|---|---|---|
Rise of headless and composable commerce architectures Rise of headless and composable commerce architectures | +5.2% | Global, with early adoption in North America and EU | Medium term (2-4 years) | (~) % Impact on CAGR Forecast:
+5.2%
|
Geographic Relevance
:Global, with early adoption in North America and EU |
Impact Timeline
:
Medium term (2-4 years)
|
Proliferation of real-time streaming data pipelines
Proliferation of real-time streaming data pipelines
| +6.8% | APAC core, spill-over to North America | Short term (≤ 2 years) | |||
Shift toward zero-party data for personalization
compliance
Shift toward zero-party data for personalization
compliance
| +4.1% | EU and North America, expanding to APAC | Long term (≥ 4 years) | |||
Mainstreaming of explainable AI (XAI) in merchandising
tools
Mainstreaming of explainable AI (XAI) in merchandising
tools
| +3.9% | Global, with regulatory push in EU | Medium term (2-4 years) | |||
Vendor bundling with CDP and marketing-automation stacks
Vendor bundling with CDP and marketing-automation stacks
| +4.7% | North America and EU, emerging in APAC | Short term (≤ 2 years) | |||
Retail media networks' demand for higher basket-size KPIs
Retail media networks' demand for higher basket-size KPIs
| +5.3% | Global, concentrated in developed markets | Medium term (2-4 years) | |||
| Source: Mordor Intelligence | ||||||
Rise of Headless and Composable Commerce Architectures
Headless commerce lets brands separate presentation layers from core transaction engines, enabling recommendation microservices to support every digital touchpoint. Google Cloud reported surging demand for Vertex AI Search for commerce during 2024, confirming enterprise appetite for MACH-aligned stacks[1]Google Cloud, “Vertex AI Search for Commerce,” cloud.google.com . The modular design encourages fast A/B testing, lowers integration risk, and future-proofs investments against shifting consumer behavior. Retailers using this architecture reported faster merchandising cycles and higher conversion on voice, AR, and mobile channels. The approach also simplifies global rollouts because content localization and recommendation logic operate independently.
Proliferation of Real-Time Streaming Data Pipelines
Enterprises shift from daily batch updates to millisecond data flows, allowing engines to capture intent as it forms. Stitch Fix leverages more than 4.5 billion data points in real time to raise purchase probability on each SKU. Streaming platforms such as Apache Kafka and Pulsar connect behavioral events with inventory, pricing, and contextual signals like weather. The result is dynamic cross-sell suggestions, adaptive bundles, and supply-chain-aware promotions. Organizations report higher average order value, lower cart abandonment, and superior inventory turns when real-time ingestion powers model inference.
Shift Toward Zero-Party Data for Personalization Compliance
Browser moves to phase out third-party cookies, reduce cross-site signals, and intensify reliance on declared preferences. Brands collect zero-party data through quizzes, preference centers, and conversational surveys, ensuring transparency and GDPR alignment. KPMG noted that compliant stacks foster trust while still delivering tailored experiences[2]KPMG LLP, “Is Your MarTech Stack Ready to Say Goodbye to Third-Party Cookies?,” KPMG, kpmg.com. Engines must infer intent from smaller datasets and continuously refine relevance based on direct feedback. Firms adopting progressive profiling observe improved email engagement, longer session duration, and higher opt-in rates.
Mainstreaming of Explainable AI in Merchandising Tools
Explainable AI (XAI) converts opaque algorithms into understandable decision aides. European regulations and enterprise risk teams insist on transparency, pushing vendors to embed feature attribution dashboards. Communications of the ACM highlights the growing demand for audit-ready recommendation logic. Retail merchandisers now adjust algorithm weights in near real time, aligning outputs with brand priorities such as sustainability or margin. Transparent explanations also fuel more rigorous A/B tests, tightening the feedback loop between human expertise and machine learning.
Restraint Impact Analysis
| Restraint | (~) % Impact on CAGR Forecast | Geographic Relevance | Impact Timeline | |||
|---|---|---|---|---|---|---|
Sunsetting of third-party cookies limiting cross-site
signals
Sunsetting of third-party cookies limiting cross-site
signals
| -3.8% | Global, with early impact in EU and North America | Short term (≤ 2 years) | (~) % Impact on CAGR Forecast:
-3.8%
|
Geographic Relevance
:Global, with early impact in EU and North America |
Impact Timeline
:
Short term (≤ 2 years)
|
High cost of maintaining feature stores for SMEs
High cost of maintaining feature stores for SMEs
| -2.9% | Global, particularly affecting emerging markets | Medium term (2-4 years) | |||
Data-privacy localization laws increasing model
fragmentation
Data-privacy localization laws increasing model
fragmentation
| -2.1% | EU, expanding to APAC and other regions | Long term (≥ 4 years) | |||
Algorithmic bias driving regulatory scrutiny on outcomes
Algorithmic bias driving regulatory scrutiny on outcomes
| -1.7% | EU and North America, emerging in APAC | Medium term (2-4 years) | |||
| Source: Mordor Intelligence | ||||||
Sunsetting of Third-Party Cookies Limiting Cross-Site Signals
Browser privacy updates shrink collaborative filtering datasets and force dependency on first-party identifiers. Google’s Privacy Sandbox accelerates the shift, giving engines narrower user histories[3]Google, “Prepare for Phasing Out Third-Party Cookies,” Google Developers, developers.google. Smaller retailers, lacking vast logged-in audiences, struggle most and invest in customer data platforms to rebuild identity graphs. Early adopters report temporary drops in personalization accuracy until sufficient first-party data accrues. The transition, however, strengthens consumer trust and prepares organizations for future privacy mandates.
High Cost of Maintaining Feature Stores for SMEs
Real-time feature stores guarantee low-latency access to user and product vectors but carry heavy cloud fees. A DynamoDB benchmark showed USD 2.2 million monthly cost for 100,000 reads per second. Many SMEs cannot sustain this spend, which deters advanced personalization rollouts. Managed feature store services reduce complexity yet still demand specialist MLOps skills. Without cost-effective options, a performance gap persists between tech giants and smaller merchants, limiting industry-wide innovation diffusion.
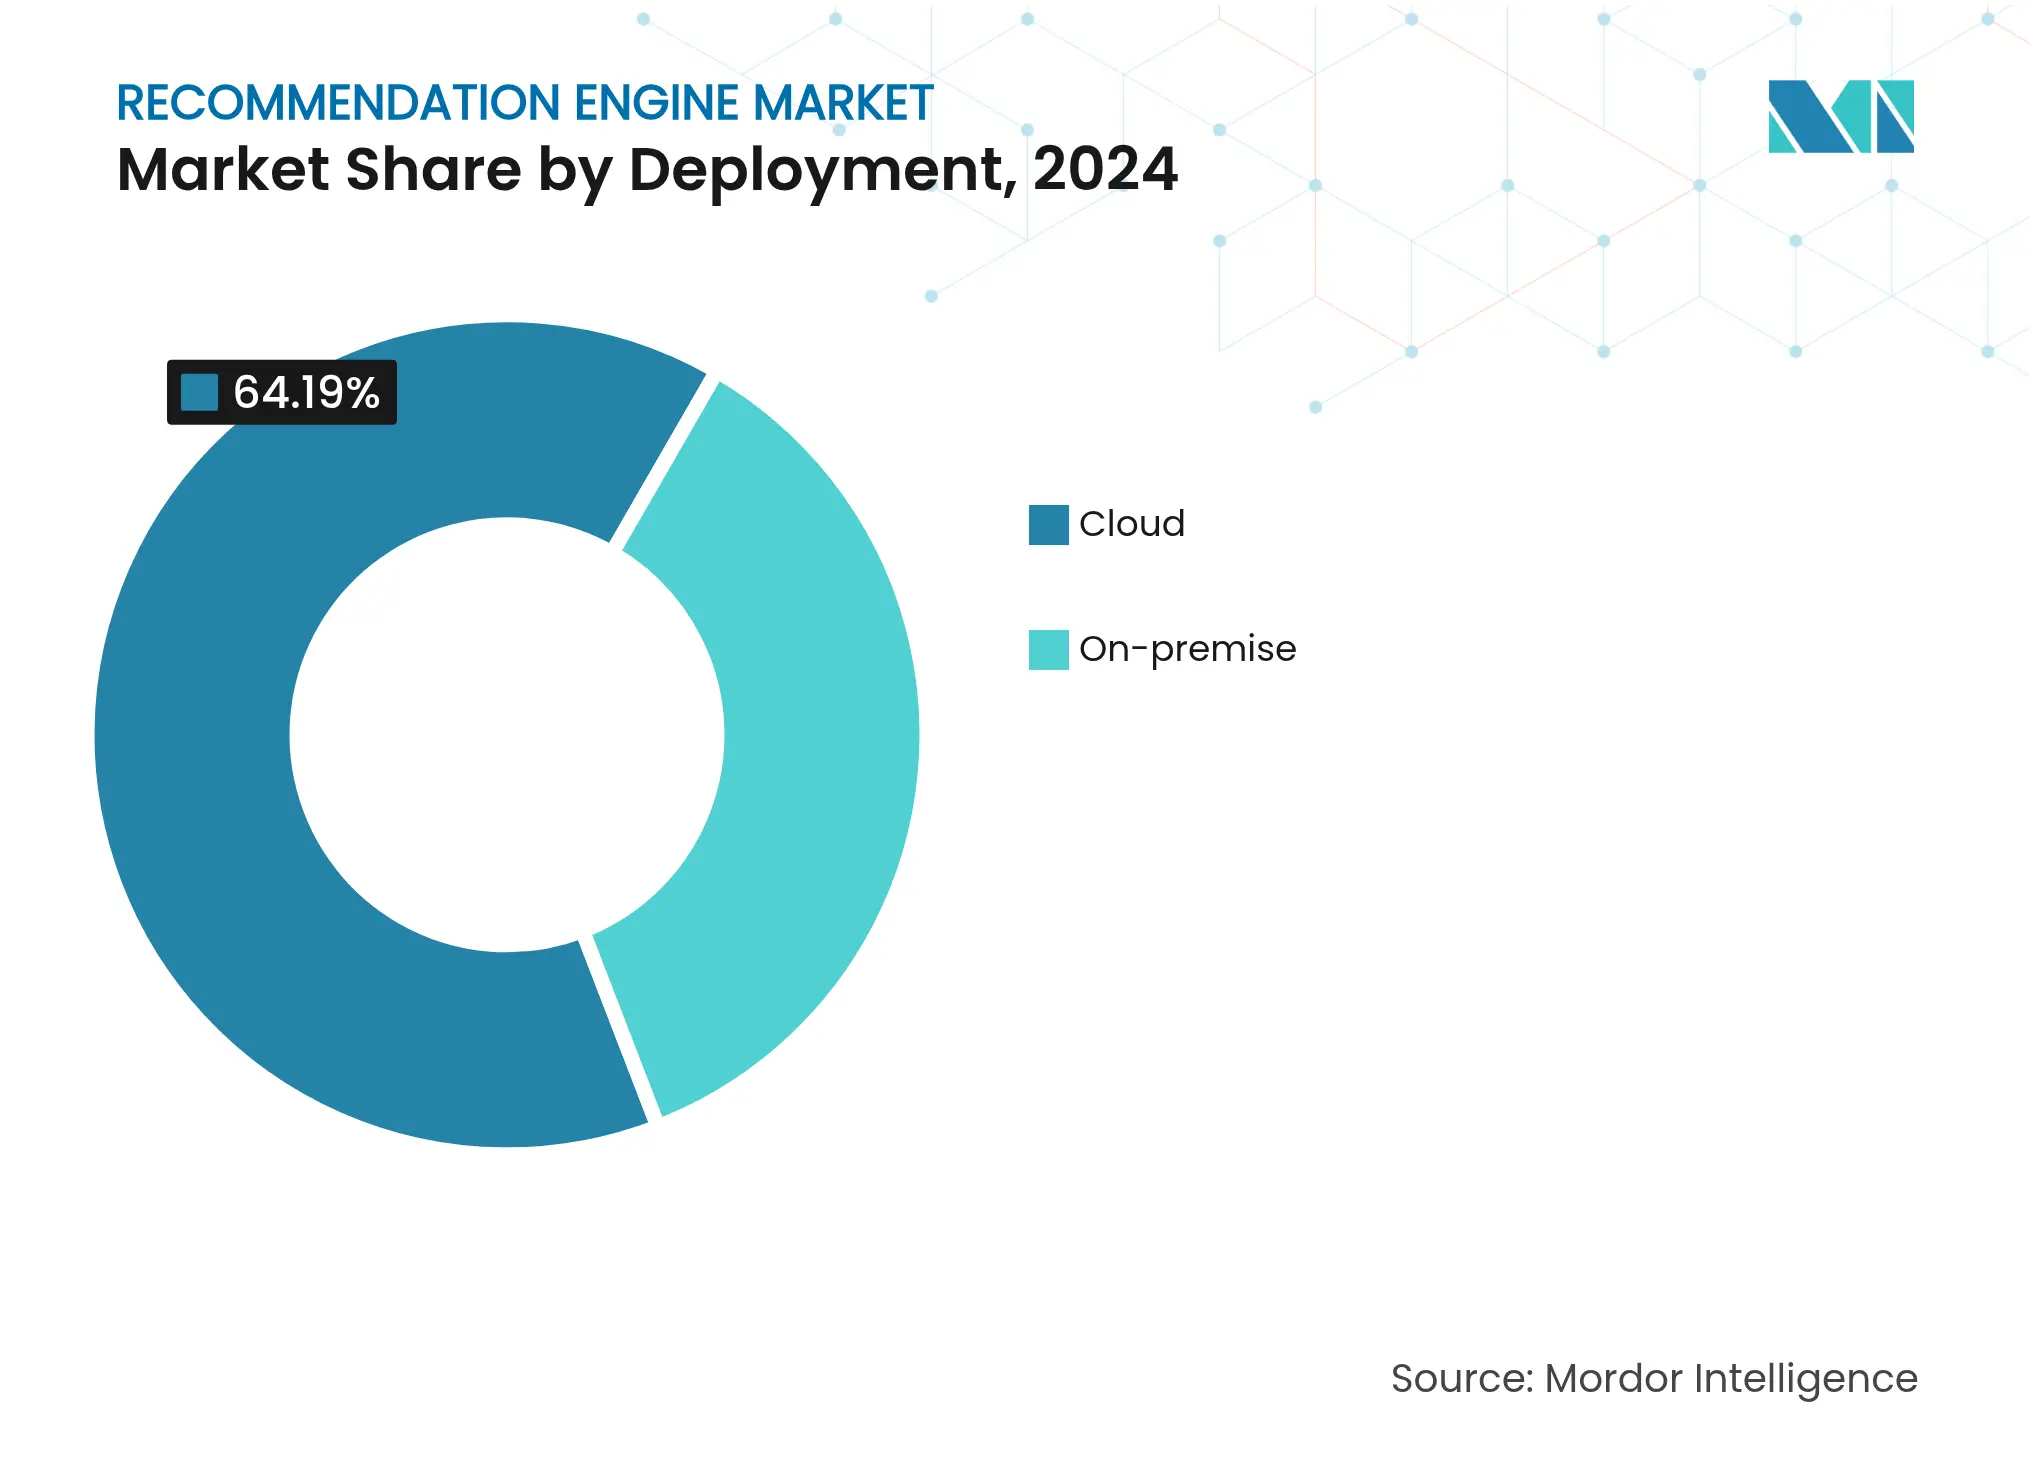
By Deployment Mode: Cloud Infrastructure Drives Scalability
Cloud solutions captured 64.19 of % recommendation engine market share in 2024 and are forecast to post a 16.65% CAGR. Managed platforms such as Amazon Personalize and Google Cloud Recommendations AI remove infrastructure overhead and accelerate iteration cycles[4]Amazon Web Services, “Real-Time Personalization and Recommendation,” amazonaws.cn. The recommendation engine market size for cloud deployments is projected to widen as enterprises offload maintenance and exploit elastic scaling during holiday peaks. On-premise remains relevant for regulated sectors but incurs higher talent and hardware costs. Hybrid architectures, combining on-premise data residency with cloud model training, gain interest among financial institutions needing sovereign control while leveraging external GPU clusters.
Edge deployments appear in grocery chains and fashion stores where smart shelves or mirrors need sub-200 ms inference. Integrating on-device models with centralized cloud retraining balances low latency with continuous learning. Vendors increasingly bundle edge runtimes and feature stores to simplify in-store rollout. As real-time decisioning expands to physical locations, deployment choices hinge on latency tolerance, cost, and regulatory constraints.
By Recommendation Approach: Hybrid Models Lead Innovation
Hybrid systems held a 43.91% share because ensembles offset the weaknesses of single algorithms. They blend collaborative, content-based, and knowledge-based logic, handling cold-start users and promoting catalog diversity. The recommendation engine market size for contextual and knowledge-based techniques is rising at 20% CAGR, powered by large language models and knowledge graphs that decode intent and product relationships.
Collaborative filtering thrives on rich behavioral logs but falters with sparse data. Content-based methods work well for SKU-heavy catalogs yet risk echo chambers. Contextual engines capitalize on location, device, or weather, delivering situational relevance. Knowledge-based systems flourish in regulated domains where rules and ontologies shape recommendations. Generative AI now fabricates descriptive metadata, enriching sparse catalogs and improving cold-start performance.
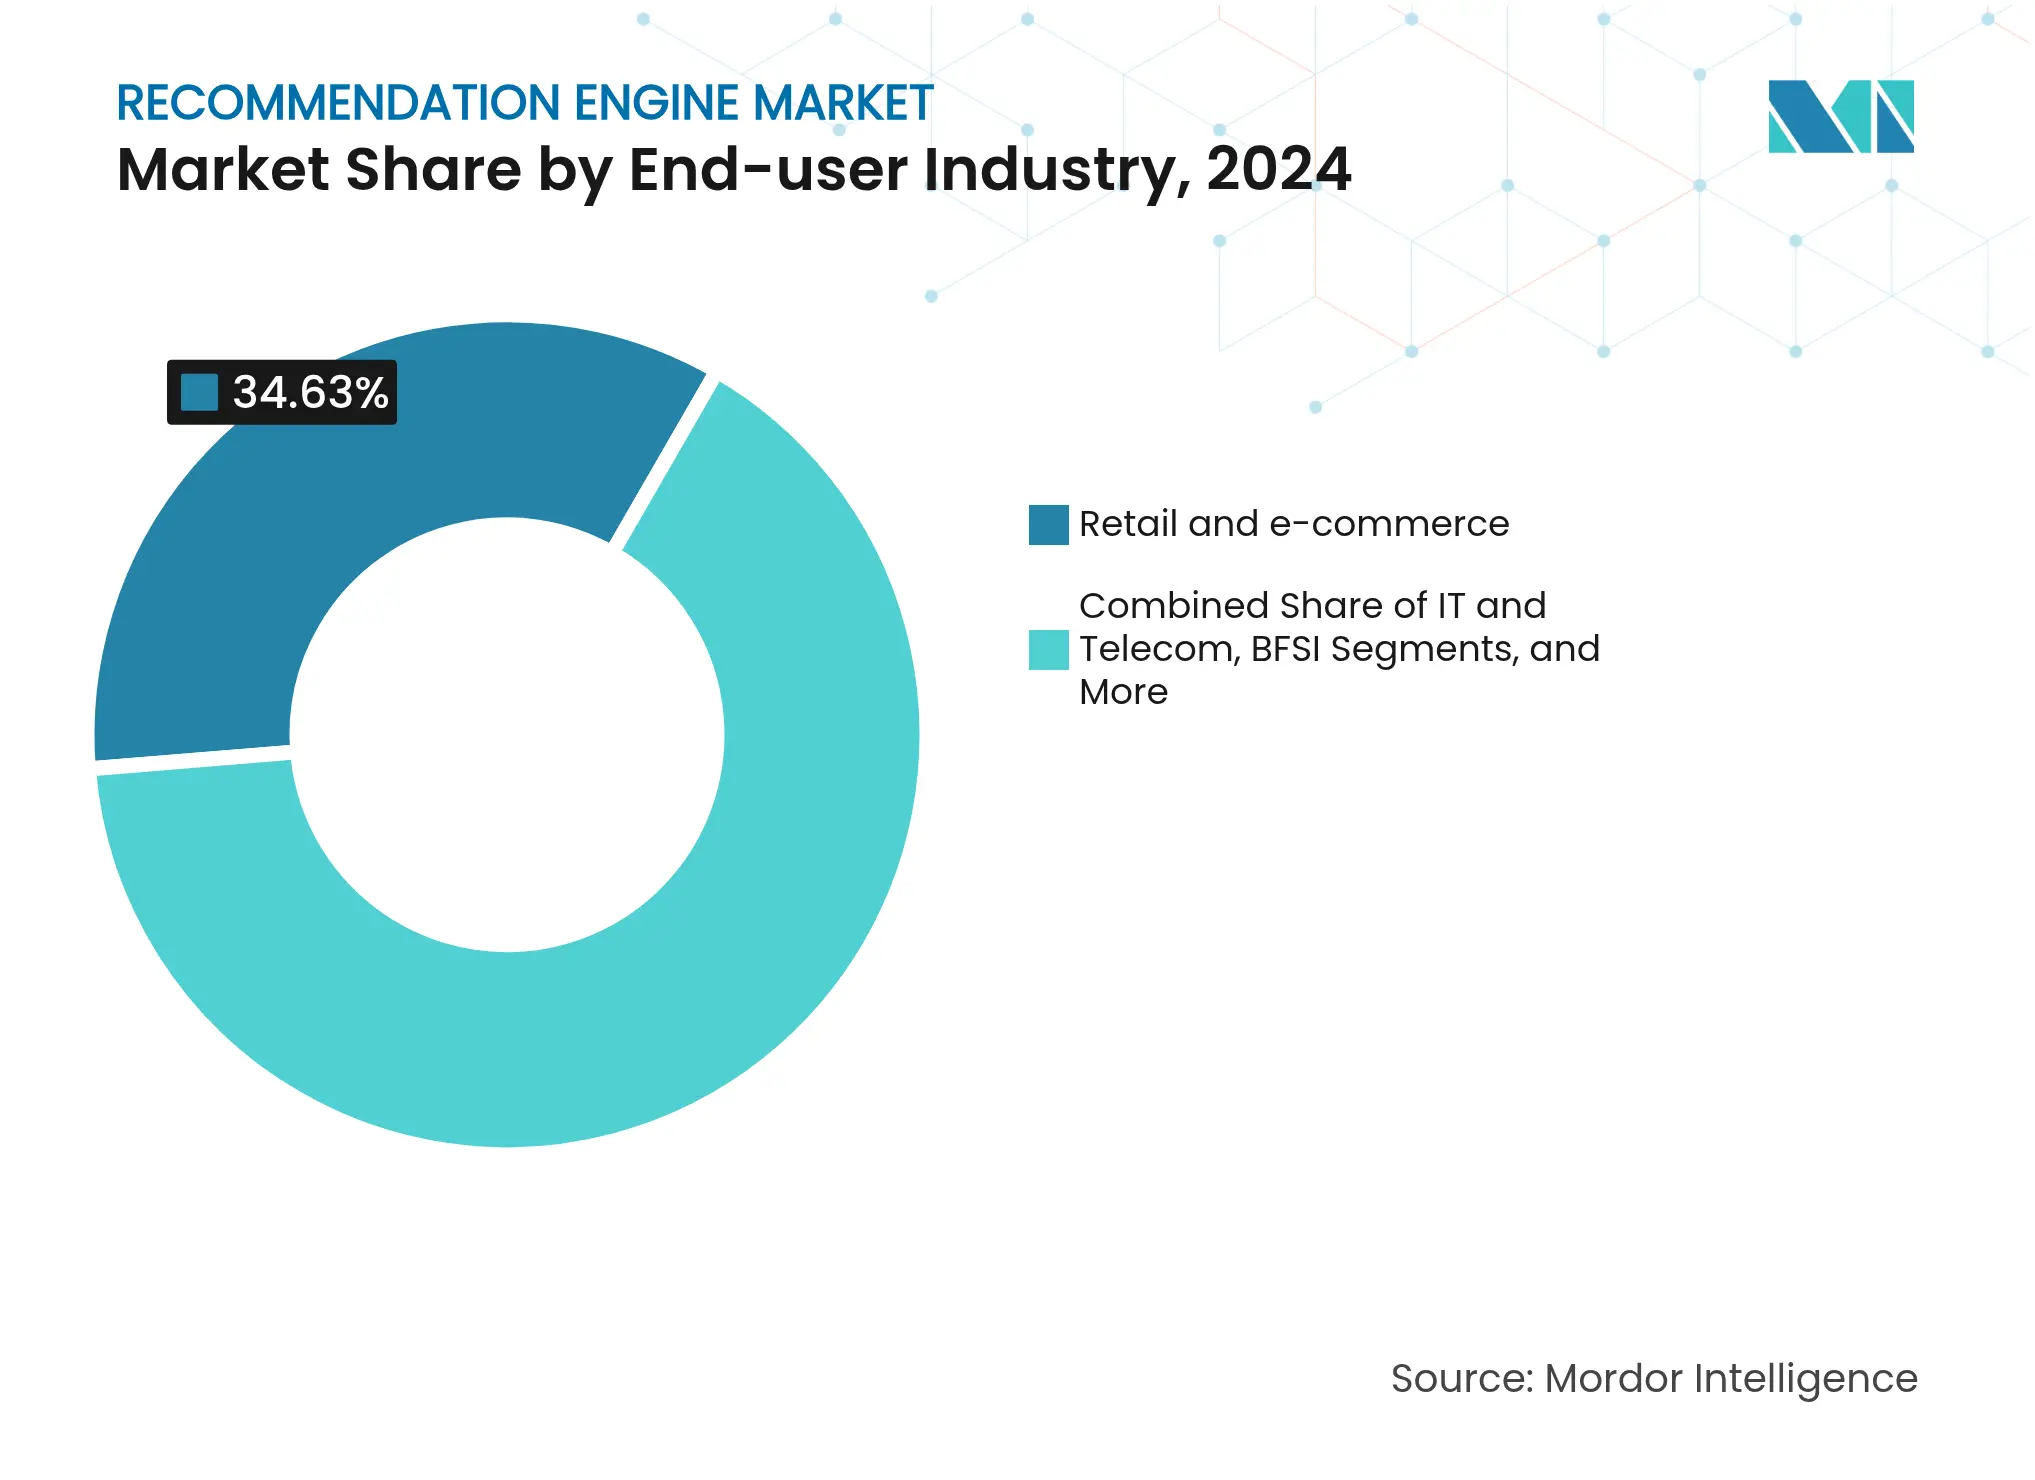
By End-User Industry: Retail Dominance with Healthcare Acceleration
Retail and e-commerce retained 34.63% market share in 2024, exploiting recommendations to boost cross-sell, increase basket size, and optimize inventory turns. Amazon’s Rufus AI assistant is forecast to lift operating profit by USD 700 million in 2025, underscoring monetization potential. Media and entertainment platforms rely on time-based engagement metrics, integrating storyline and mood signals to sustain viewer retention.
The recommendation engine market size for healthcare and life sciences is escalating with a 19% CAGR. AI-powered decision support tailors treatments by matching genomic and lifestyle data with outcome databases. Financial institutions deploy engines for personalized credit, fraud alerts, and micro-investment tips, while telecom operators optimize plan upgrades and 5G rollout through predictive churn insights.
Note: Segment shares of all individual segments available upon report purchase
By Application Channel: Voice Assistants Drive Conversational Commerce
Web and mobile interfaces contributed 56.16% of revenue in 2024, remaining the default discovery path. Progressive web apps integrate geolocation, camera, and payment APIs, letting engines factor local stock and seasonality into ranking. The recommendation engine market size for chatbots and voice assistants is forecast to rise fastest, supported by Amazon’s planned Alexa AI subscription and Walmart’s Sparky assistant.
Conversational interfaces analyze intent and sentiment, enabling contextual upsells like complementary cooking tools when a user orders ingredients. Email, SMS, and push remain cost-effective retention channels, leveraging zero-party preference data for timing and content personalization. In-store kiosks merge computer vision with recommendation logic to create guided selling journeys, encouraging higher attachment rates on accessories.
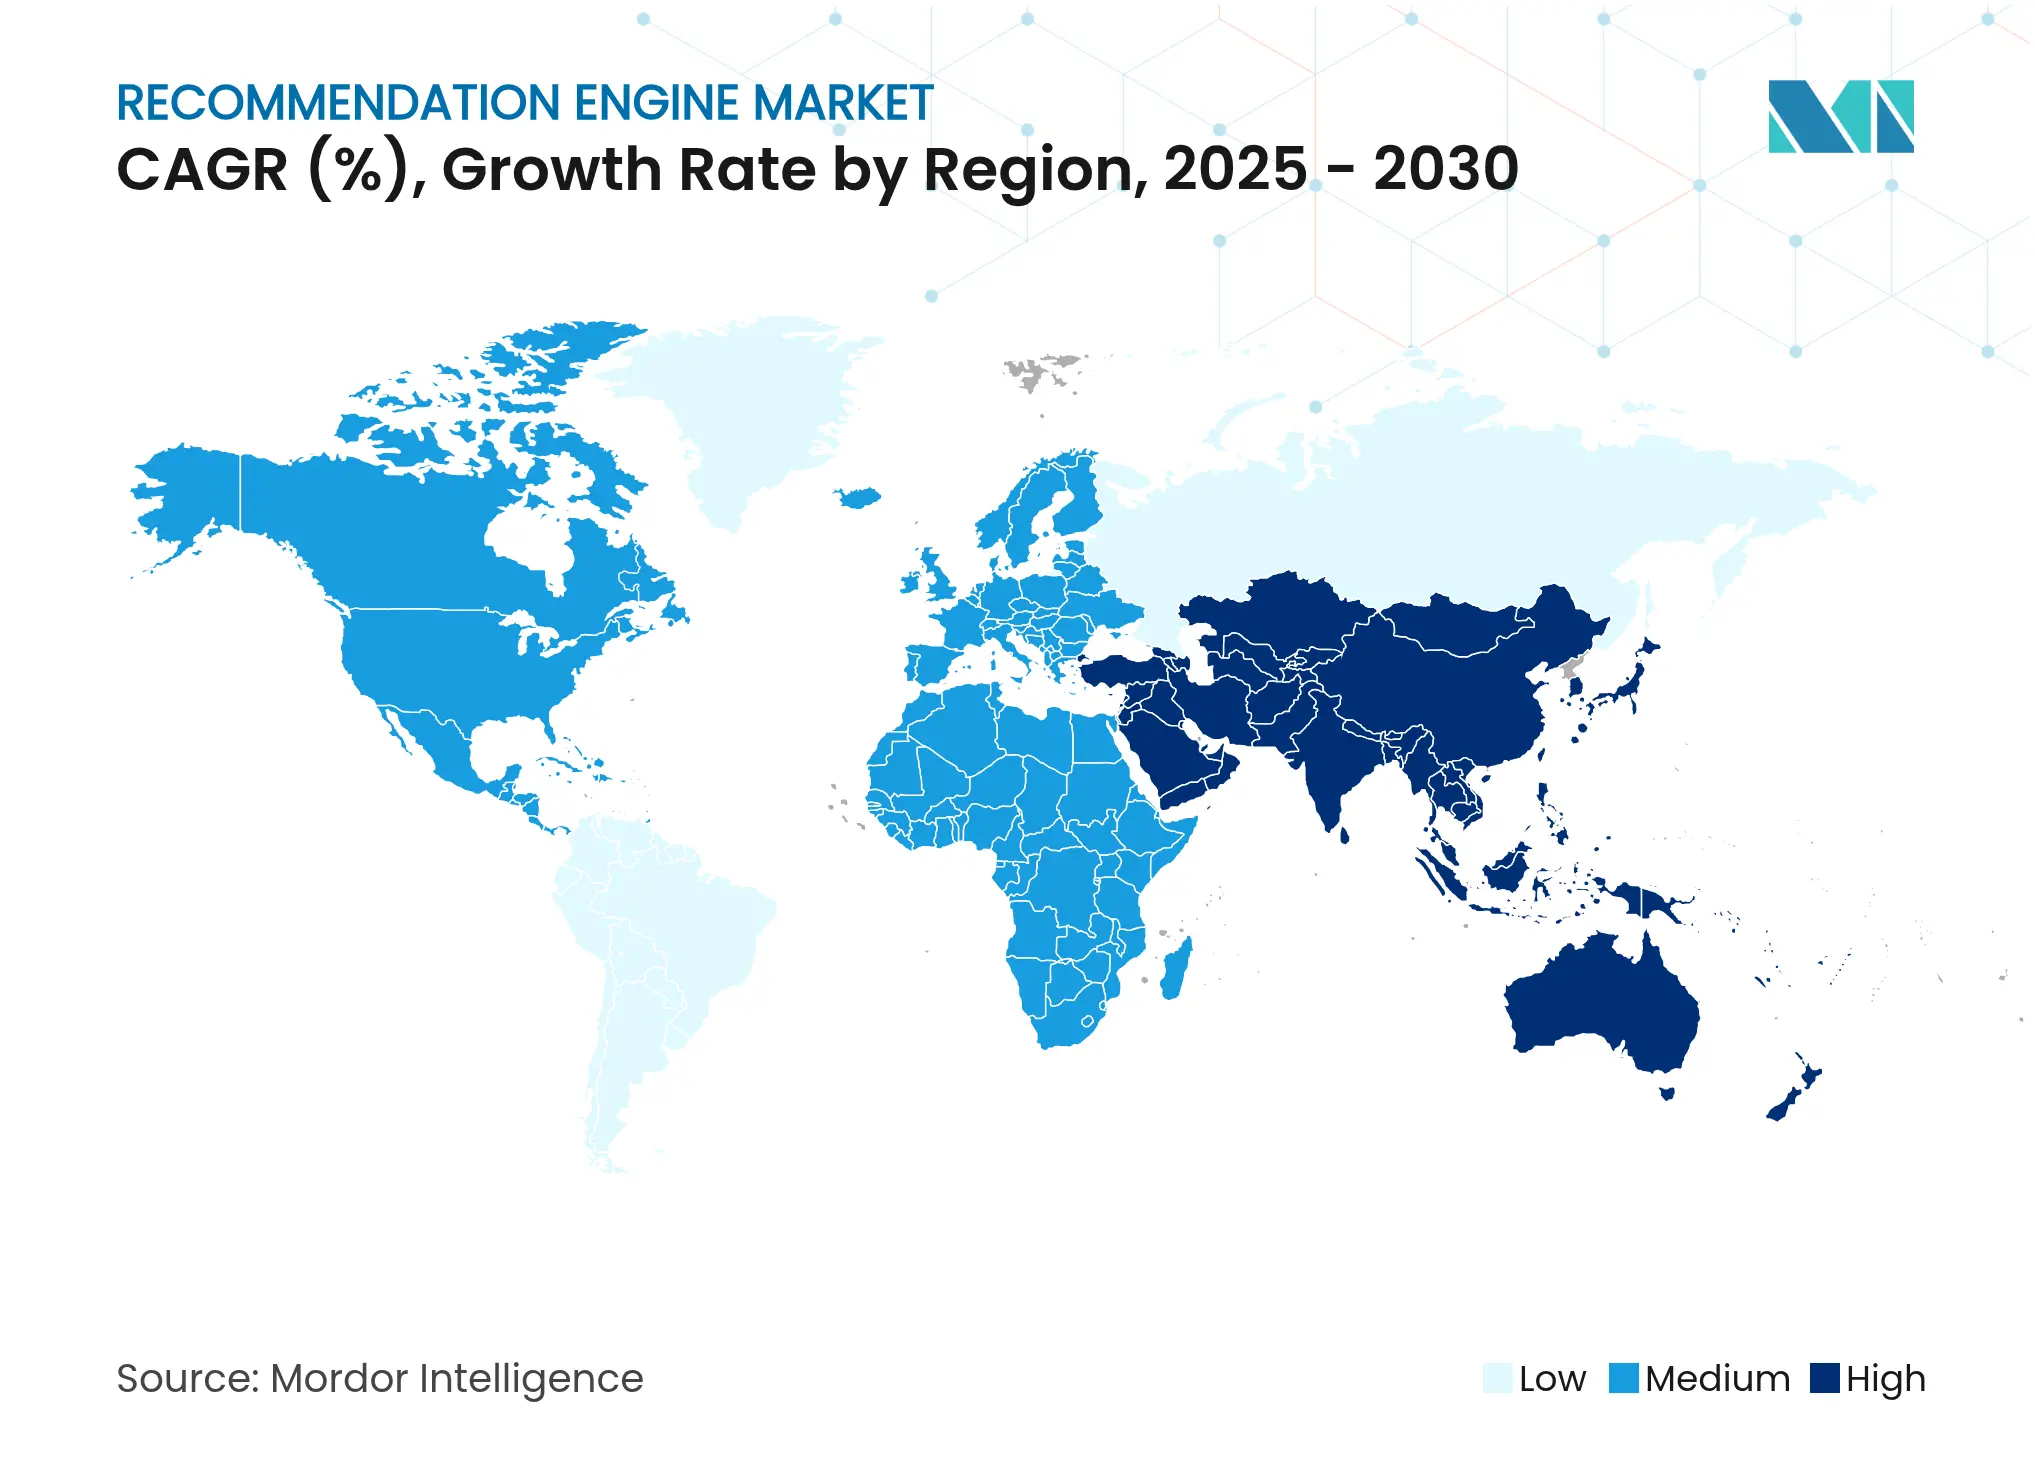
North America held a 39.81% share in 2024, buoyed by mature cloud ecosystems and privacy frameworks that support experimentation. U.S. retailers integrate recommendation engines with retail media networks, cashing in on sponsored placements that depend on relevance scoring. Canadian banks and Mexican marketplaces increasingly adopt cloud-based solutions, widening regional penetration.
Asia-Pacific records the quickest expansion at 17.66% CAGR through 2030. Regional investment in generative AI reached USD 3.4 billion in 2024, with China alone contributing USD 2.1 billion. Indian financial institutions, such as Axis Bank, attribute 45% of term deposits to AI-driven recommendations. Japan and South Korea expand edge-AI retail pilots, while Southeast Asia capitalizes on mobile-first commerce.
Europe balances innovation with strict compliance. GDPR and the forthcoming EU AI Act demand explainability, raising integration costs but enabling exportable privacy-centric frameworks. The Middle East and Africa witness national AI strategies funding e-commerce and fintech recommendation pilots, notably in the United Arab Emirates and Saudi Arabia. South America sees adoption climb within Brazilian and Chilean marketplaces seeking basket-lift through AI bundles.
Market Concentration
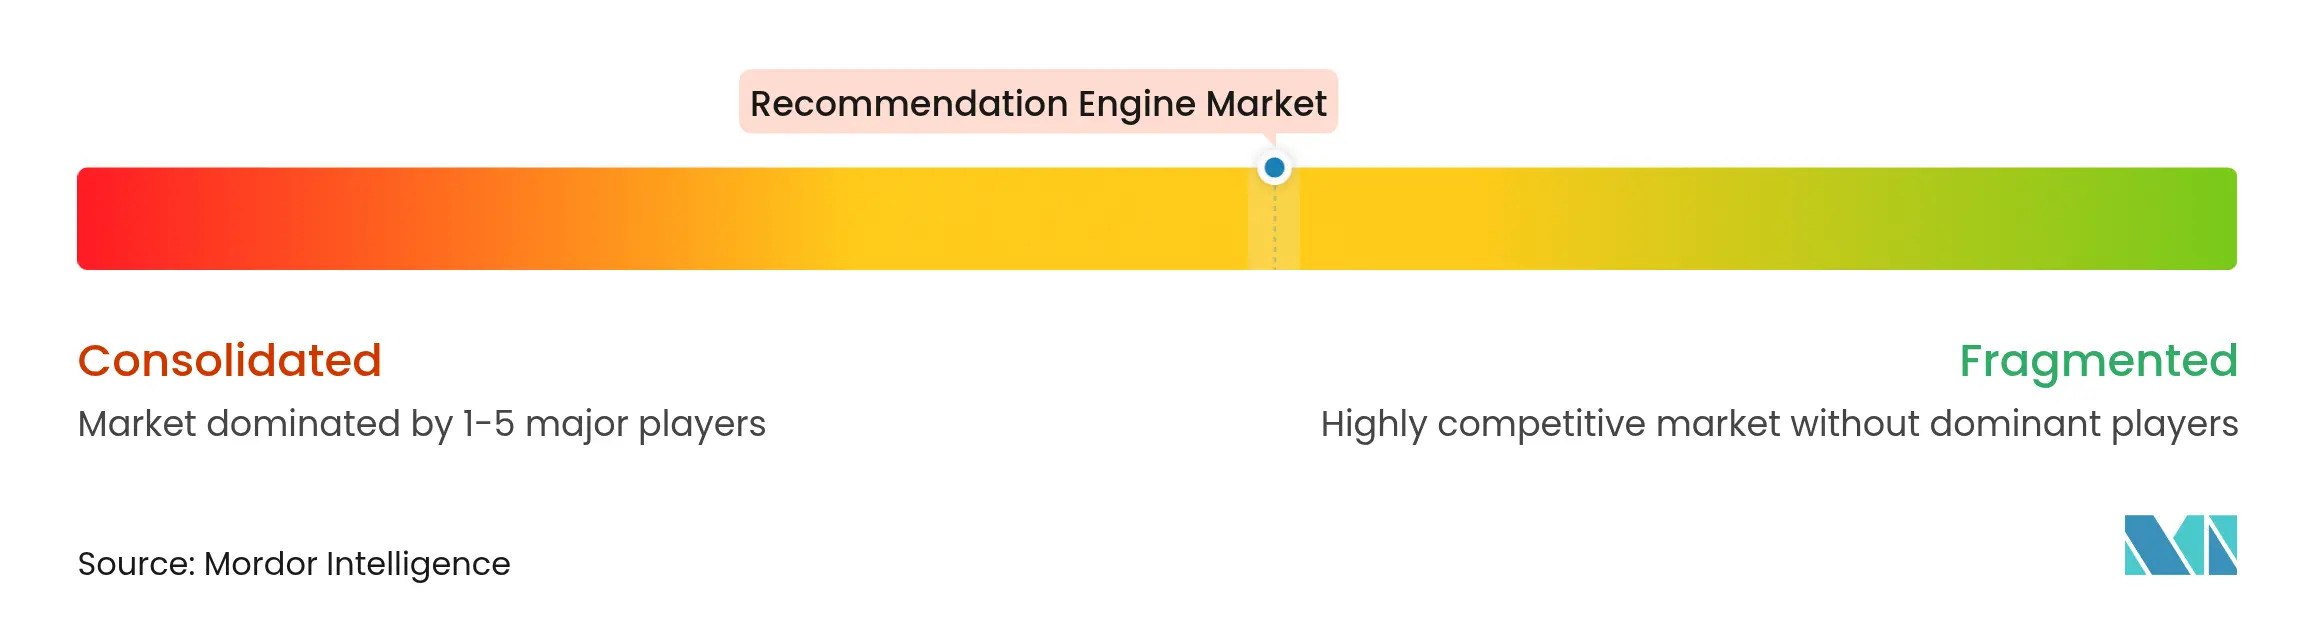
The market remains fragmented, yet consolidation accelerates as cloud hyperscalers embed recommendation features across their platforms. Amazon Web Services deepens ties with merchants via Personalize APIs, leveraging seamless integration into the broader AWS suite. Microsoft couples Azure AI with Dynamics 365 to extend recommendations into CRM workflows, while Google Cloud marries Vertex AI Search with Ads to monetize sponsored placements.
Vertical specialization is rising. Salesforce delivers CRM-native recommendations, Adobe targets marketing and creative personas, and SAP aligns suggestions with supply-chain modules. Healthcare and banking favor niche vendors that solve compliance challenges with domain knowledge. Strategic acquisitions intensify: OpenAI’s June 2025 hire of the Crossing Minds team signals a broader interest in commerce personalization.
Partnership models evolve toward bundled CDP, analytics, and marketing-automation suites, raising switching costs for clients. White-space remains in SME tooling, where cost-efficient feature stores and plug-and-play models could unlock demand. Vendors that address operational expense and data-localization constraints stand positioned to capture latent growth.

*Disclaimer: Major Players sorted in no particular order
1. INTRODUCTION
2. RESEARCH METHODOLOGY
3. EXECUTIVE SUMMARY
4. MARKET LANDSCAPE
5. MARKET SIZE AND GROWTH FORECASTS (VALUE)
6. COMPETITIVE LANDSCAPE
7. MARKET OPPORTUNITIES AND FUTURE TRENDS
Recommendation engines are data filtering tools that use various algorithms and data to recommend the most relevant items to a particular customer. They first capture the past behavior of a customer. Based on that, they recommend products the users are likely to buy. The integrated software analyzes the available data to suggest something a website user might be interested in (products/services), among other possibilities. Recommendation engine systems are common in e-commerce, social media platforms, and content-based websites. The recommendation engine market study includes the revenues generated from the recommendation engine type, such as collaborative filtering, content-based filtering, hybrid recommendation systems, and other types used in various end-user industries through different deployment modes globally. The study also analyzes the overall impact of the COVID-19 pandemic on the ecosystem. The study includes qualitative coverage of the most adopted strategies and an analysis of the key base indicators in emerging markets.
The recommendation engine market is segmented by deployment mode (on-premise, cloud), type (collaborative filtering, content-based filtering, hybrid recommendation systems), end-user industry (IT and telecommunication, BFSI, retail, media and entertainment, healthcare), geography (North America, Europe, Asia-Pacific, Latin America, Middle East and Africa). The market sizes and forecasts are provided in terms of value in USD million for all the above segments.
Pricing Strategy for Semiconductor Components
3 Min Read
Accelerating Additive Manufacturing Adoption in India
3 Min Read
When decisions matter, industry leaders turn to our analysts. Let’s talk.