Market Overview
| Study Period | 2020 - 2031 |
|---|---|
| Forecast Data Period | 2026 - 2031 |
| Historical Data Period | 2020 - 2024 |
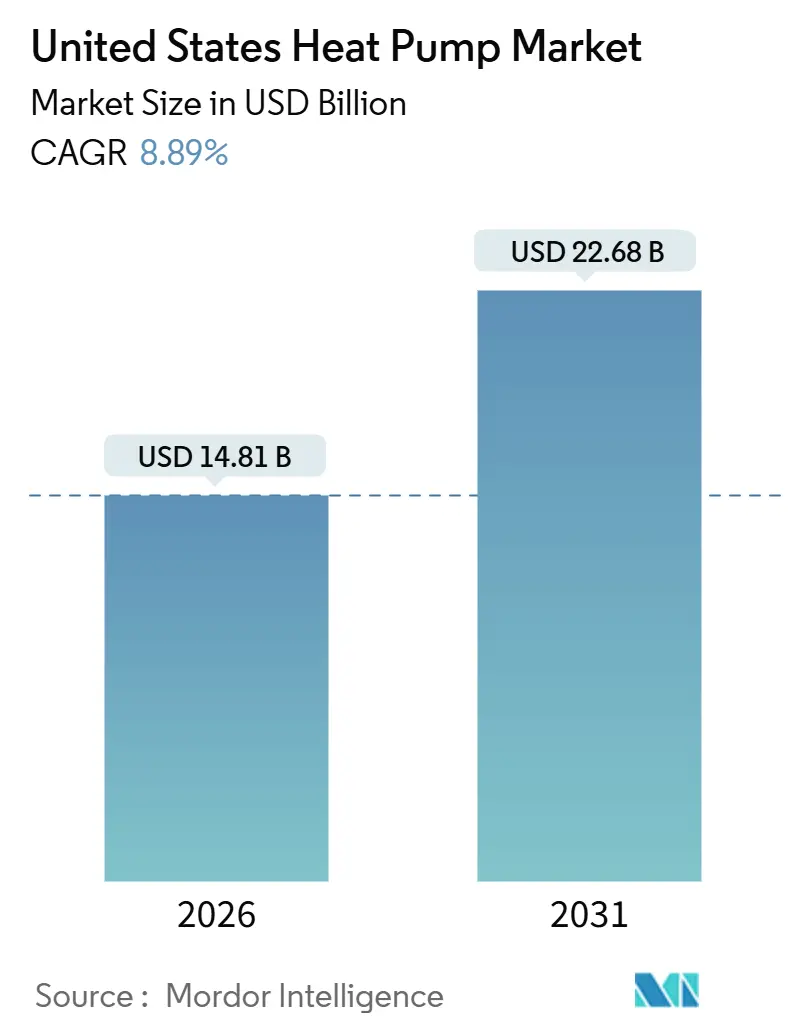
| Market Size (2026) | USD 14.81 Billion |
| Market Size (2031) | USD 22.68 Billion |
| Growth Rate (2026 - 2031) | 8.89% CAGR |
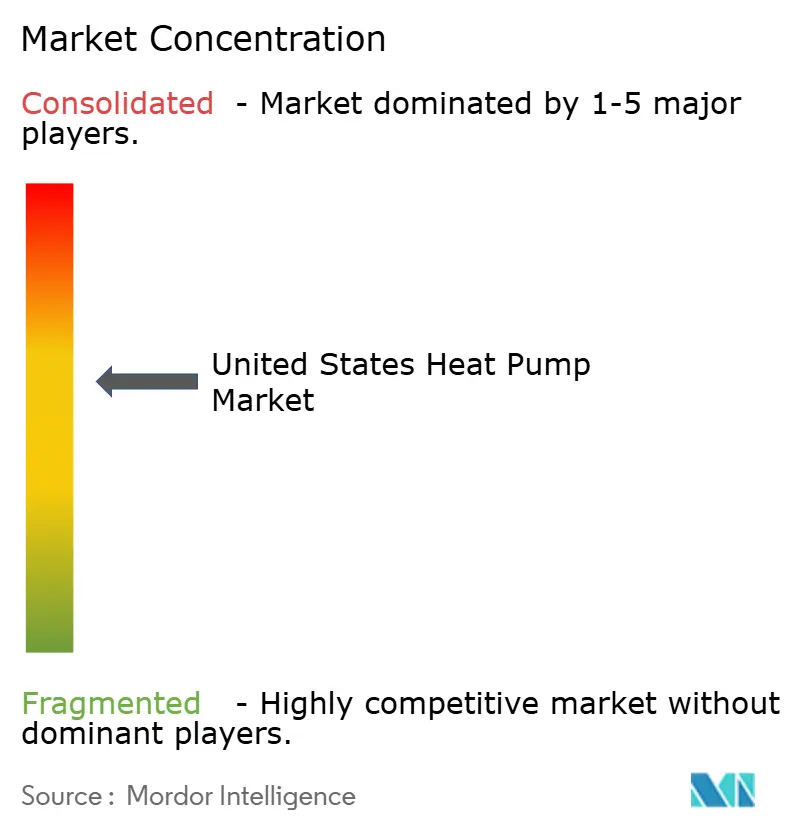
| Market Concentration | Medium |
Major Players *Disclaimer: Major Players sorted in no particular order Image © Mordor Intelligence. Reuse requires attribution under CC BY 4.0. | |
United States Heat Pump Market Analysis by Mordor Intelligence
The United States heat pump market size stood at USD 14.81 billion in 2026 and is projected to reach USD 22.68 billion by 2031, translating into an 8.89% CAGR across the forecast period. This trajectory reflects an inflection point where federal tax incentives, rapid refrigerant-phasedown schedules, and expanding state electrification mandates are accelerating equipment replacement cycles and shortening payback periods. Policy momentum is now reinforced by cold-climate performance breakthroughs, on-shored compressor supply, and rising corporate net-zero commitments that collectively expand the addressable base in both residential and commercial real estate. Manufacturers are responding with variable-speed inverter technology, hybrid system options for legacy buildings, and turnkey financing that lowers first-cost barriers. Meanwhile, installer capacity, refrigerant availability, and electrical-panel constraints temper near-term upside but also create niches for labor-saving installation platforms, low-GWP refrigerant diversification, and managed-load solutions.
Key Report Takeaways
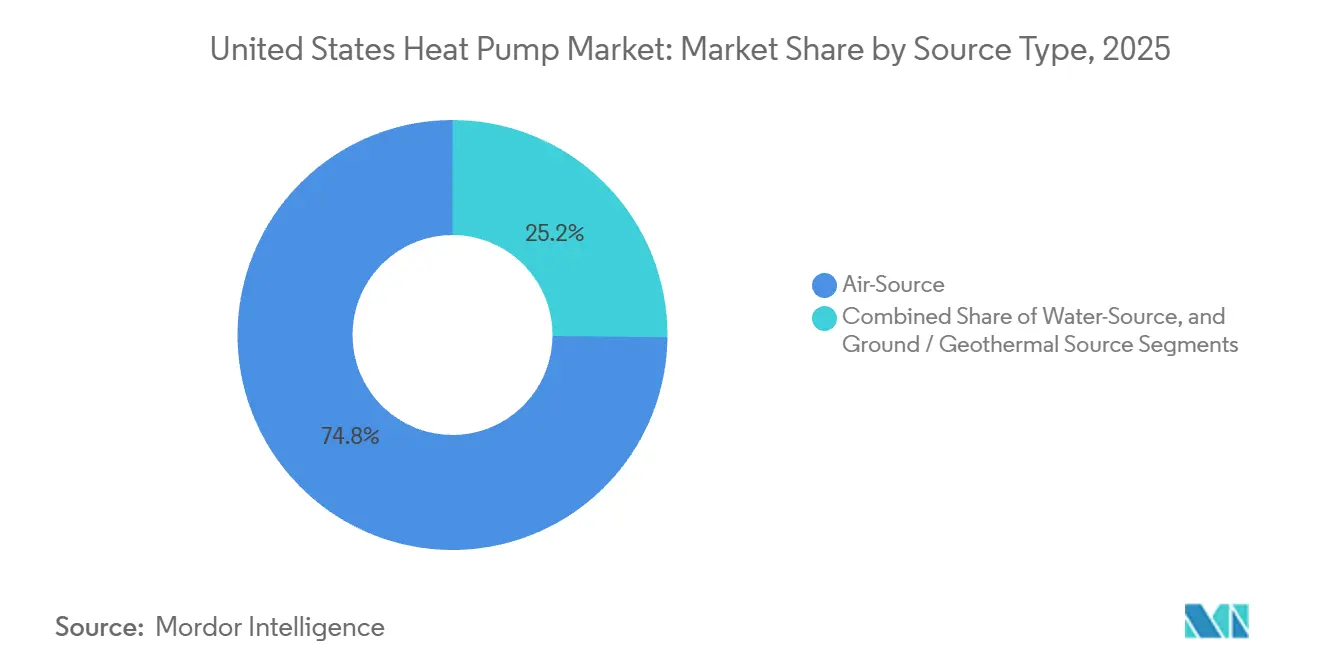
- By source type, air-source systems led with 74.83% revenue share in 2025; ground-source configurations are forecast to expand at a 9.31% CAGR through 2031.
- By rated capacity, units up to 10 kW captured 45.26% of the United States heat pump market share in 2025, while systems above 30 kW are advancing at a 9.78% CAGR through 2031.
- By system design, split configurations held 61.43% of the United States heat pump market size in 2025 and hybrid systems are growing at a 10.16% CAGR through 2031.
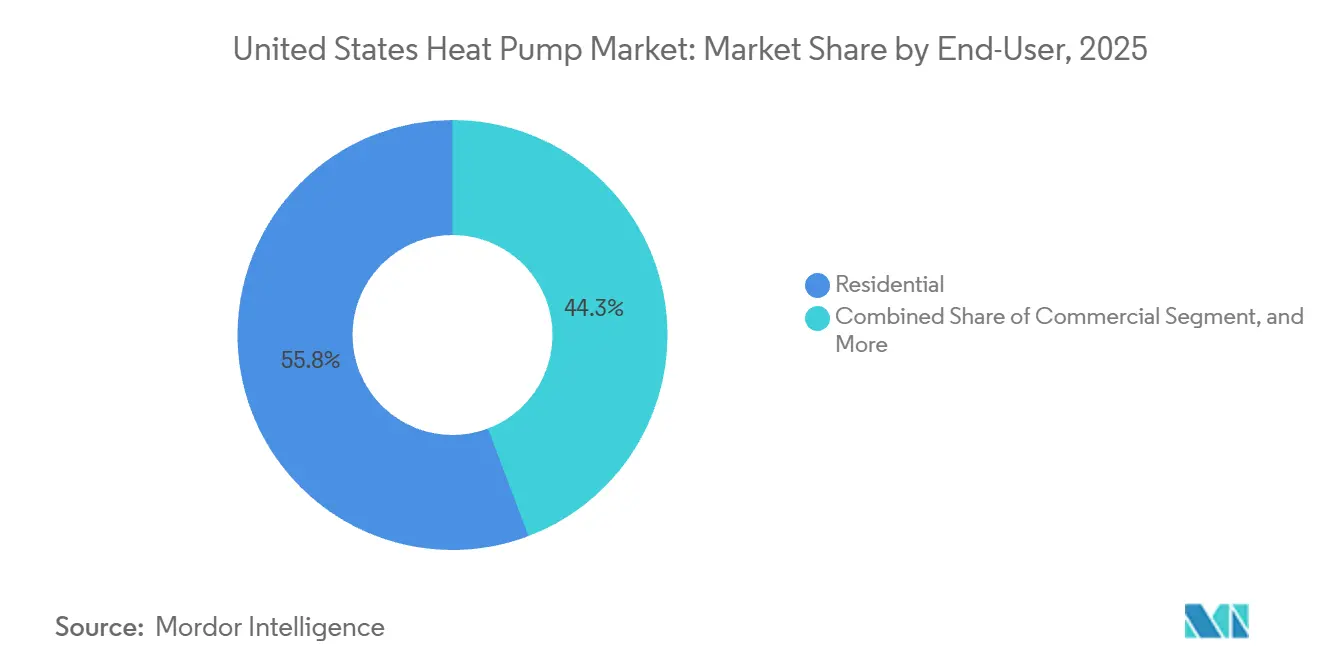
- By end-user, residential applications commanded 55.75% share in 2025; industrial demand is projected to expand at a 9.82% CAGR to 2031.
- By application, space heating and cooling accounted for 62.54% in 2025, whereas district heating grew at a 10.47% CAGR through 2031.
Note: Market size and forecast figures in this report are generated using Mordor Intelligence’s proprietary estimation framework, updated with the latest available data and insights as of January 2026.
United States Heat Pump Market Trends and Insights
Drivers Impact Analysis*
| Driver | (~) % Impact on CAGR Forecast | Geographic Relevance | Impact Timeline |
|---|---|---|---|
| Federal Tax Incentives Under Inflation Reduction Act | +2.1% | Nationwide, strongest in Northeast, Pacific Northwest, Upper Midwest | Medium term (2-4 years) |
| Rapid Phasedown of High-GWP Refrigerants Accelerates Equipment Refresh Cycles | +1.6% | Nationwide, manufacturing clusters in the Southeast | Short term (≤ 2 years) |
| State-Level Electrification Mandates Expand Beyond Coastal States | +1.4% | CA, NY, WA, MA, CO with spillover to OR, MD, IL | Medium term (2-4 years) |
| Cold-Climate Heat Pump Performance Breakthroughs Unlock Northern Demand | +1.3% | Northern tier states from MN to ME | Long term (≥ 4 years) |
| Heat-Pump Water-Heater Rebates Open Parallel Sales Channel | +0.9% | Nationwide, early concentration where utilities stack rebates | Short term (≤ 2 years) |
| OEM On-Shoring of Compressor Production Lowers Cost and Lead-Times | +0.8% | Manufacturing footprints in TN, GA, SC, TX | Medium term (2-4 years) |
| Source: Mordor Intelligence | |||
Federal Tax Incentives Under Inflation Reduction Act Boost Adoption
Section 25C and 25D credits covering up to USD 2,000 for air-source units and 30% of ground-source installed cost are eliminating the historical first-cost penalty that limited mainstream adoption. OEM earnings calls consistently attribute double-digit shipment growth in 2025 to point-of-sale credits that remove cash-flow friction for middle-income households. In cold-weather states where heat loads dominate utility bills, the incentive shortens payback to under seven years, stimulating retrofits even when legacy furnaces remain operational. Contractors report higher close rates because rebates are visible on proposals rather than deferred to tax season. Utilities further amplify demand by layering performance-based rebates, creating stacked incentives that reach 40% to 50% of installed cost in Massachusetts and Oregon.
Rapid Phasedown of High-GWP Refrigerants Accelerates Equipment Refresh Cycles
EPA’s AIM Act caps are cutting R-410A production, raising spot prices and driving distributors to encourage accelerated replacement before service refrigerant scarcity becomes acute.[1]U.S. Environmental Protection Agency, “Phasedown of Hydrofluorocarbons: AIM Act,” epa.gov Manufacturers with certified R-32 or R-454B product lines advertise future-proof compliance, giving them a resale premium in contractor channels. Early adopters benefit from improved seasonal efficiency because lower-density refrigerants pair with variable-speed compressors that reduce part-load losses. The phasedown timeline has also catalyzed ASHRAE to fast-track safety classifications, removing a regulatory bottleneck for mildly flammable refrigerants. While near-term supply tightness curbs margins for service contractors reliant on reclaimed R-410A, OEMs positioned with multi-refrigerant portfolios capture share and command higher ASPs.
State-Level Electrification Mandates Expand Beyond Coastal States
California’s Title 24 update, New York’s CLCPA, and Washington’s cap-and-invest scheme create de facto bans on new gas hookups, locking in structural demand regardless of macro headwinds.[2]California Energy Commission, “2025 Building Energy Efficiency Standards,” energy.ca.gov Colorado, Illinois, and Maryland are replicating these codes, extending policy certainty to markets totaling roughly 35% of U.S. housing starts. Builders must pre-wire new homes for heat pumps, pulling demand forward even as mortgage rates rise. Spillover is visible in neighboring states where voluntary stretch codes and utility incentives benchmark against coastal precedents, forming a ratchet effect that widens the United States heat pump market footprint.
Cold-Climate Heat Pump Performance Breakthroughs Unlock Northern Demand
DOE’s Cold Climate Challenge certified units that sustain COP > 2.0 at 5 °F, proving viability where furnaces historically dominated. Rheem’s field trials in Minnesota and Vermont validated reliability through polar vortex events, boosting utility confidence to raise rebate ceilings. Enhanced vapor-injection compressors, adaptive defrost algorithms, and hydrophilic coil coatings mitigate frost-build, sustaining capacity at −15 °F. This capability unlocks roughly 12 million single-family homes heated by oil or propane in the northern tier, a segment previously considered marginal for the United States heat pump market.
Restraints Impact Analysis*
| Restraint | (~) % Impact on CAGR Forecast | Geographic Relevance | Impact Timeline |
|---|---|---|---|
| Short-Term Refrigerant-Transition Supply Bottlenecks | -1.2% | Nationwide, sharpest in Southeast and Southwest during cooling season | Short term (≤ 2 years) |
| Skilled-Installer Labor Shortage Inflates Installation Costs | -1.4% | Nationwide, most acute in rural and exurban counties | Medium term (2-4 years) |
| Legacy-Home Electrical-Panel Limits Curb Addressable Market | -0.9% | Pre-1980 housing stock in Northeast and Midwest | Long term (≥ 4 years) |
| Rising Interest Rates Dampen HVAC Replacement Decisions | -0.7% | Nationwide, highest sensitivity in middle-income owner-occupied homes | Short term (≤ 2 years) |
| Source: Mordor Intelligence | |||
Skilled-Installer Labor Shortage Inflates Installation Costs
HVAC employment is projected to grow 8% this decade but still lags accelerated demand for heat-pump-specific competencies.[3]U.S. Bureau of Labor Statistics, “Occupational Outlook Handbook: HVAC Mechanics and Installers,” bls.gov Median installer wages touched USD 59,810 in 2024, causing labor to exceed 45% of residential installed cost. Rural territories face extended lead times as contractors travel long distances, inflating soft costs. OEMs have pivoted into workforce development, Carrier’s TechVantage aims to train 100,000 installers by 2028 while distributors experiment with prefabricated line-set kits that cut job-site hours. Despite these moves, wage inflation remains embedded, constraining near-term volume growth.
Legacy-Home Electrical-Panel Limits Curb Addressable Market
Roughly 40% of U.S. detached homes still operate on 100- or 150-amp service, a capacity ceiling that requires USD 2,000–5,000 panel upgrades before heat pump installation. The Inflation Reduction Act offers a USD 600 credit, leaving a financing gap that deters low-income adopters. Utilities piloting on-bill loans report modest uptake given paperwork complexity. Hybrid dual-fuel systems that throttle electric consumption during peak demand partially alleviate the barrier yet dilute decarbonization benefits. Manufacturers now market 120-volt mini-split models and load-management controls that auto-shed EV chargers or dryers, but these remain niche pending broader smart-panel adoption.
*Our forecasts treat driver/restraint impacts as directional, not additive. The impact forecasts reflect baseline growth, mix effects, and variable interactions.
Segment Analysis
By Source Type: Air-Source Dominance Faces Geothermal Disruption
Air-source units accounted for 74.83% of 2025 revenue as the lowest-cost entry point into the United States heat pump market. Most homeowners retrofit existing ducts with variable-speed split systems that ship in under two weeks, while ductless mini-splits give multifamily owners zone control without structural work. Operating efficiency dips in sub-freezing conditions, yet inverter-driven compressors and advanced defrost cycles now keep COP above 1.8 at 0 °F. On the other hand, ground-source solutions, supported by 30% federal credits, achieved a 9.31% CAGR outlook, eroding the lifecycle cost gap despite higher drilling expense. WaterFurnace’s closed-loop vertical systems post COP 5.2, yielding sub-seven-year paybacks in high-load zones. School districts and corporate campuses embrace the technology for LEED certification and long service life, signaling further share migration toward geothermal in the United States heat pump market.
Beyond lifecycle economics, geothermal performance stability shields users from grid-peak price volatility, an attractive hedge as renewables drive intraday rate swings. Equipment suppliers are bundling loop-field design, drilling, and commissioning under single contracts to offset contractor learning curves. This turnkey model accelerates timelines and addresses installer scarcity, positioning geothermal as the premium efficiency choice within the United States heat pump industry.


By Rated Capacity: Residential Units Dominate, Commercial Sizes Surge
Sub-10 kW systems furnished 45.26% of the United States heat pump market size in 2025, reflecting 2- to 5-ton demand in detached housing. Dealers favor these SKUs for inventory turns and standardized installation. Capacity bands above 30 kW, though smaller today, are scaling at 9.78% CAGR as supermarkets, light-manufacturing plants, and distribution centers electrify HVAC loads for Scope 1 reductions. Modular rooftop platforms integrate multiple inverter compressors to track variable internal gains in warehouses, slashing part-load inefficiency. Utilities reward these sites with demand-response incentives, improving net economics relative to gas boiler retrofits.
Industrial adopters pursuing process heat above 160 °F are piloting two-stage compression systems with economized vapor injection. Early projects in dairy pasteurization and textile drying demonstrate 60% fuel-cost cuts versus natural-gas boilers, hinting that high-capacity segments could command a larger slice of the United States heat pump market share by decade-end.
By System Design: Hybrid Configurations Gain Traction
Split systems retained 61.43% installation share in 2025 thanks to flexible line-set routing and minimal indoor noise. Cold-region builders increasingly move toward monobloc air-to-water units where sealed refrigerant circuits mitigate freeze risk and shrink refrigerant charge for AIM-Act compliance. Hybrid dual-fuel packages are rising at 10.16% CAGR, bridging electrical-panel limits and customer range-anxiety over deep-freeze performance. Load-shifting algorithms decide when to fire the legacy furnace versus run the compressor, optimizing for real-time utility tariffs.
Regulators in California and Washington are tightening fossil-backup allowances in new construction, potentially capping hybrid growth post-2028. Still, in retrofit-heavy Midwest markets, dual-fuel remains the fastest route to partial decarbonization, preserving upside for Lennox, Mitsubishi Electric, and Carrier offerings that sync with smart thermostats and utility demand-flexibility platforms.
By End-User: Industrial Segment Emerges as Growth Driver
Residential owners captured 55.75% demand in 2025, propelled by point-of-sale rebates and broad contractor coverage. Single-family retrofits anchor volume while multifamily developers specify centralized variable-refrigerant-flow to hit energy-code targets. Commercial landlords value heat pumps for lower maintenance and cooling-mode efficiency, pairing them with rooftop solar to hedge summer peaks. The industrial cohort is projected to grow at 9.82% CAGR, adopting high-temperature units in food, textile, and chemical operations to curb carbon fees and secure ESG-linked financing.
Process-integrated heat recovery raises overall site efficiency, with Johnson Controls offering skid-mounted modules that retrofit into boiler rooms without altering existing pipework. As more regional carbon-trading schemes materialize, the industrial slice of the United States heat pump market is expected to transition from early pilot phase to mainstream investment.
By Application: District Heating Gains Momentum
Space heating and cooling accounted for 62.54% of 2025 revenue, whereas district heating grew at a 10.47% CAGR through 2031. Water heating is a breakout subsegment thanks to stacked rebates that shrink net cost up to 70% in several Northeast states, turning heat-pump water heaters into gateway products for whole-home electrification. District-energy pilots in Massachusetts and Washington are demonstrating lifecycle costs 20% lower than those of individual gas boilers at density-appropriate campuses. The Framingham wastewater-source loop now heats 200 apartments and 50,000 ft² of retail space, offering a replicable model for other mid-scale municipalities.
Industrial clients integrate waste-heat capture with chilled-water production, enabling simultaneous heating and cooling and maximizing compressor runtime. Emerson and Trane supply configurable units that can flip between heat-rejection modes, a design that opens incremental megawatt-scale opportunities in the broader United States heat pump market.
Geography Analysis
Northern tier states anchor cold-climate opportunity as certified units maintain COP > 2 at sub-zero temperatures, slashing propane and oil dependence and capturing enhanced utility rebates. The Midwest registers accelerated growth after Illinois, Minnesota, and Michigan rolled out heat-pump-ready codes aligned with their climate-action plans. In the Northeast, dense housing stock and 2025 Title 24-style requirements push market penetration past 40% in new builds by 2026. The Southeast still supplies over a quarter of national shipments given its historic mini-split base, although refrigerant transitions exert price pressure during summer cooling peaks.
Pacific Northwest adoption remains the fastest on a per-capita basis as Washington-state cap-and-invest proceeds fund low-income weatherization and heat-pump vouchers. Oregon’s Energy Trust stacks up to USD 3,000 on top of federal credits, keeping payback under five years in moderate climates. Mountain West states such as Colorado and Utah record double-digit unit growth after ski-town municipalities banned new gas hookups. Grid-capacity concerns in rural mountain valleys are mitigated through utility-managed demand-flex platforms that curtail compressor operation during winter peaks.
Coastal metropolitan areas lead in commercial electrification due to aggressive building-performance standards. New York City’s Local Law 97 imposes emissions caps, catalyzing large-scale heat-pump retrofits in Class-A offices. California’s emergence as a launch market for R-454B-charged rooftop units accelerates technology diffusion nationwide. Across geographies, federal IRA incentives create a consistent baseline, but state-specific adders skew ROI and drive regional disparities in the United States heat pump market size.
Competitive Landscape
The market remains moderately fragmented with the top three suppliers Carrier Global Corporation, Daikin Industries, and Trane Technologies holding about 38% share. Carrier’s 2024 acquisition of Viessmann Climate Solutions imported European inverter expertise and an integrated home-energy platform, aimed at defending premium residential segments. Daikin leverages its Texas-based DTTP campus to localize production and short-cycle new refrigerant variants, while Trane prioritizes variable-refrigerant-flow commercial deployments and AI-enabled service analytics.
Geothermal specialists WaterFurnace International and ClimateMaster scale through dealer-certification programs that ease installer onboarding, widening channel reach beyond the niche green-building community. Consumer-electronics entrants LG Electronics and Samsung HVAC differentiate through IoT integration, voice-control readiness, and sleek indoor-unit form factors that resonate with design-conscious homeowners.
Competitors are investing in supply-chain localization for compressor cores, proprietary installer-training academies to solve labor bottlenecks, and digital marketplaces that quote equipment, financing, and labor in one workflow. Disruptors such as Sealed and Gradient package equipment, financing, and performance guarantees in an online check-out, compressing the customer journey and challenging legacy distributor economics. High-temperature industrial solutions emerge as white-space, where Johnson Controls and Emerson compete on two-stage compression and corrosion-resistant metallurgy.
United States Heat Pump Industry Leaders
Carrier Global Corporation
DAIKIN INDUSTRIES, Ltd.,
Trane Technologies plc
Rheem Manufacturing Company
Lennox International Inc.
- *Disclaimer: Major Players sorted in no particular order

Recent Industry Developments
- January 2026: Carrier Global Corporation reported a 30% year-over-year decline in North American residential HVAC volumes but maintained full-year guidance on a strong commercial backlog.
- August 2025: Carrier confirmed Viessmann-branded product launches for North America by year-end 2025 following its EUR 12 billion (USD 13.56 billion) acquisition.
- July 2025: Carrier unveiled the TechVantage program to recruit 1,000 technicians and train 100,000 installers over three years.
- April 2025: Rheem announced its cold-climate system exceeded DOE performance targets, sustaining COP > 2.0 at 5 °F in field trials.


Research Methodology Framework and Report Scope
Market Definitions and Key Coverage
Our study counts every factory-built air, water, and ground-source heat pump that delivers space-conditioning or combined space and water heating in residential, commercial, and light industrial buildings across the fifty states. Systems shipped as part of packaged rooftop units or ductless splits are included, provided their primary function is heat transfer rather than process cooling.
Scope exclusion: stand-alone pool or spa heat-pump heaters, industrial dryers, and cryogenic refrigeration packages sit outside this market's boundary.
Segmentation Overview
- By Source Type
- Air-Source
- Air-to-Air
- Air-to-Water
- Water-Source
- Surface Water
- Open Loop
- Ground / Geothermal Source
- Closed Loop Vertical
- Closed Loop Horizontal
- Direct Expansion
- Air-Source
- By Rated Capacity
- Up to 10 kW
- 10-20 kW
- 20-30 kW
- Above 30 kW
- By System Design
- Split System
- Monobloc
- Hybrid Heat Pump
- By End-User
- Residential
- Commercial
- Industrial
- Institutional
- By Application
- Space Heating and Cooling
- Water Heating
- District Heating
- Process and Industrial Heating
Detailed Research Methodology and Data Validation
Primary Research
Interviews and short surveys with distributors, HVAC contractors, state energy-office staff, and compressor fabricators allowed us to verify unit price ladders, rebate uptake rates, and installation bottlenecks. Respondents spanned the Sunbelt, Northeast retrofit clusters, and emerging cold-climate pilots, giving Mordor analysts balanced regional insight.
Desk Research
We began with public sources that anchor market size fundamentals, such as the U.S. Energy Information Administration's shipment data series, the Department of Energy rebate rulebooks, and state building-code repositories. Analysts also screened trade association briefs from the Air-Conditioning, Heating, and Refrigeration Institute and examined patent clusters via Questel to trace refrigerant-phase-down innovation.
Those totals were enriched with macro inputs, housing starts from the U.S. Census, heat-degree-day trends from NOAA, and import values culled through Volza manifest scans, which helped us map product mix shifts across climate zones.
The sources quoted above illustrate our approach but are not exhaustive; many additional publications, filings, and newsfeeds underpin our desk analysis.
Market-Sizing & Forecasting
A top-down reconstruction using federal shipment tallies and import-export reconciliations yields the initial 2024 volume pool, which is then multiplied by weighted average selling prices to get value. Targeted bottom-up roll-ups, select manufacturer revenues, channel checks, and sampled invoice audits cross-validate that figure. Key variables in the model include building permits issued, state-level incentive budgets, average HSPF requirements, compressor shipment lead times, and residential electricity tariffs. Multivariate regression projects each driver forward, while scenario analysis stress-tests high electrification and muted policy cases before numbers are finalized.
Data Validation & Update Cycle
Outputs pass a two-stage analyst peer review, automated variance scans versus historic ratios, and reconciliation against IEA renewable heat deployment dashboards. We refresh models every twelve months and trigger interim revisions whenever Congress or DOE issues material efficiency mandates.
Why Mordor's US Heat Pump Baseline Earns Trust
Published U.S. estimates often diverge because firms pick different equipment mixes, incentive assumptions, and refresh cadences. Buyers need clarity on which baseline mirrors on-the-ground reality.
Key gap drivers are scope drift into pool heaters, omission of contractor mark-ups in price curves, and optimistic rebate redemption rates.
Mordor excludes non-HVAC heat pumps, layers realistic installation mark-ups confirmed by contractors, and discounts federal funding to the historic 76% claim rate, thereby tempering over-enthusiastic scenarios.
Benchmark comparison
| Market Size | Anonymized source | Primary gap driver |
|---|---|---|
| USD 13.75 B (2025) | Mordor Intelligence | - |
| USD 14.60 B (2024) | Regional Consultancy A | Uses list prices, counts pool heaters |
| USD 11.20 B (2024) | Global Consultancy B | Excludes ductless mini-splits, single climate average |
These comparisons show that when variables are aligned with verifiable shipment data and realistic policy uptake, Mordor's baseline offers a balanced, reproducible foundation for planning decisions.


Key Questions Answered in the Report
How large is the United States heat pump market today?
It reached USD 14.81 billion in 2026 and is on track to grow to USD 22.68 billion by 2031.
What federal incentives are currently driving heat pump adoption?
Section 25C offers up to USD 2,000 for qualifying air-source units, while Section 25D covers 30% of ground-source installed cost, both available at the point of sale.
Are heat pumps viable in very cold U.S. climates?
Yes, DOE-certified cold-climate models maintain a COP above 2.0 at 5 °F and reliable output down to −15 °F, enabling widespread northern deployment.
Which segment is expected to grow fastest through 2031?
Ground-source systems lead with a 9.31% CAGR as tax credits and drilling efficiencies narrow cost gaps.
What is the main barrier to faster residential adoption?
A skilled-installer labor shortage inflates installation cost and extends project timelines, particularly in rural counties.
How will the refrigerant phasedown affect consumers?
Rising R-410A prices and supply caps are encouraging earlier equipment replacement, while next-generation R-32 and R-454B units offer higher efficiency and longer service life.
Page last updated on:


