United States Food Logistics Market Size and Share
Market Overview
| Study Period | 2020 - 2031 |
|---|---|
| Forecast Data Period | 2026 - 2031 |
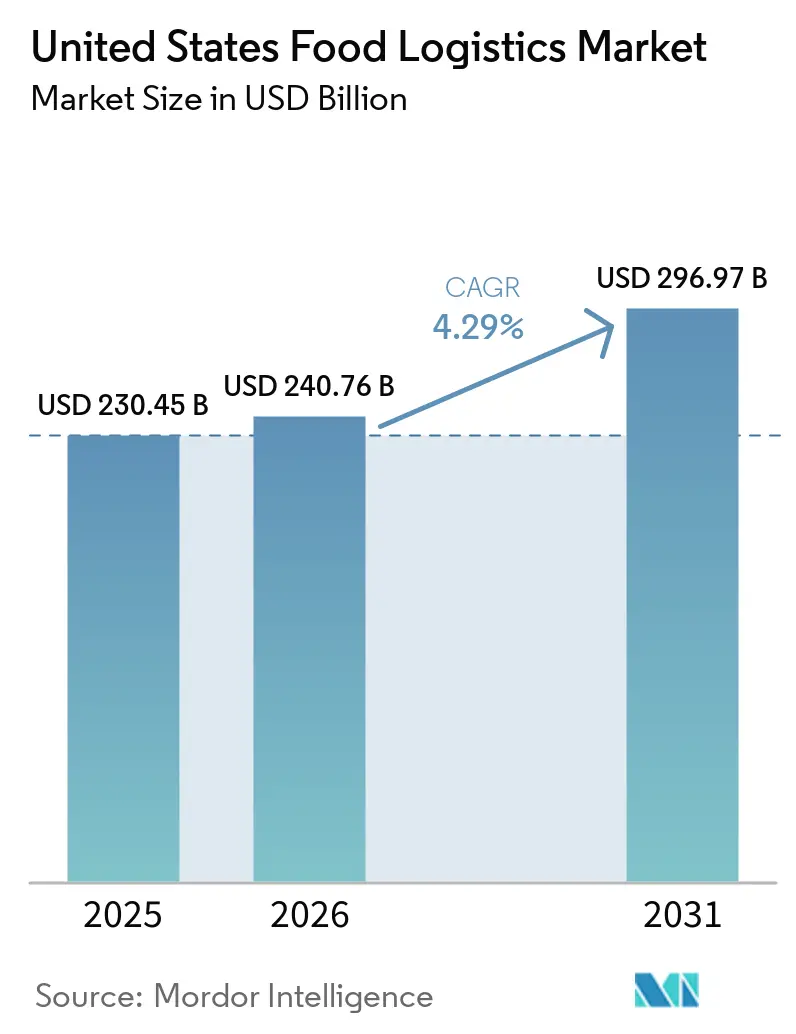
| Base Year Market Size (2025) | USD 230.45 Billion |
| Market Size (2026) | USD 240.76 Billion |
| Market Size (2031) | USD 296.97 Billion |
| Growth Rate (2026 - 2031) | 4.29% CAGR |
| Market Concentration | Medium |
Major Players *Disclaimer: Major Players sorted in no particular order Image © Mordor Intelligence. Reuse requires attribution under CC BY 4.0. | |
United States Food Logistics Market Analysis by Mordor Intelligence
The United States Food Logistics Market size was valued at USD 230.45 billion in 2025 and is estimated to grow from USD 240.76 billion in 2026 to reach USD 296.97 billion by 2031, at a CAGR of 4.29% during the forecast period (2026-2031).
Growth in 2026 centers on faster fulfillment cycles and distributed networks that support fresh and frozen items at scale, with online grocery and click-and-collect lifting order frequency and last-mile routing complexity. Elevated food service demand in 2026 sustains high delivery cadence into restaurants and institutions, even as operators adjust to higher labor and input costs. The extended compliance deadline for the FDA’s Food Traceability Rule gives operators more time to standardize data capture and exchange, while USDA’s large storage investments point to capacity pressure in high-value perishables. Urban congestion and driver availability in 2026 constrain productivity and inflate last-mile costs in dense corridors, pushing operators toward automation, route optimization, and multi-temperature nodes closer to consumers. These shifts reinforce a competitive pattern where operational complexity, regulatory readiness, and technology depth shape pricing power across the United States food logistics market.
Key Report Takeaways
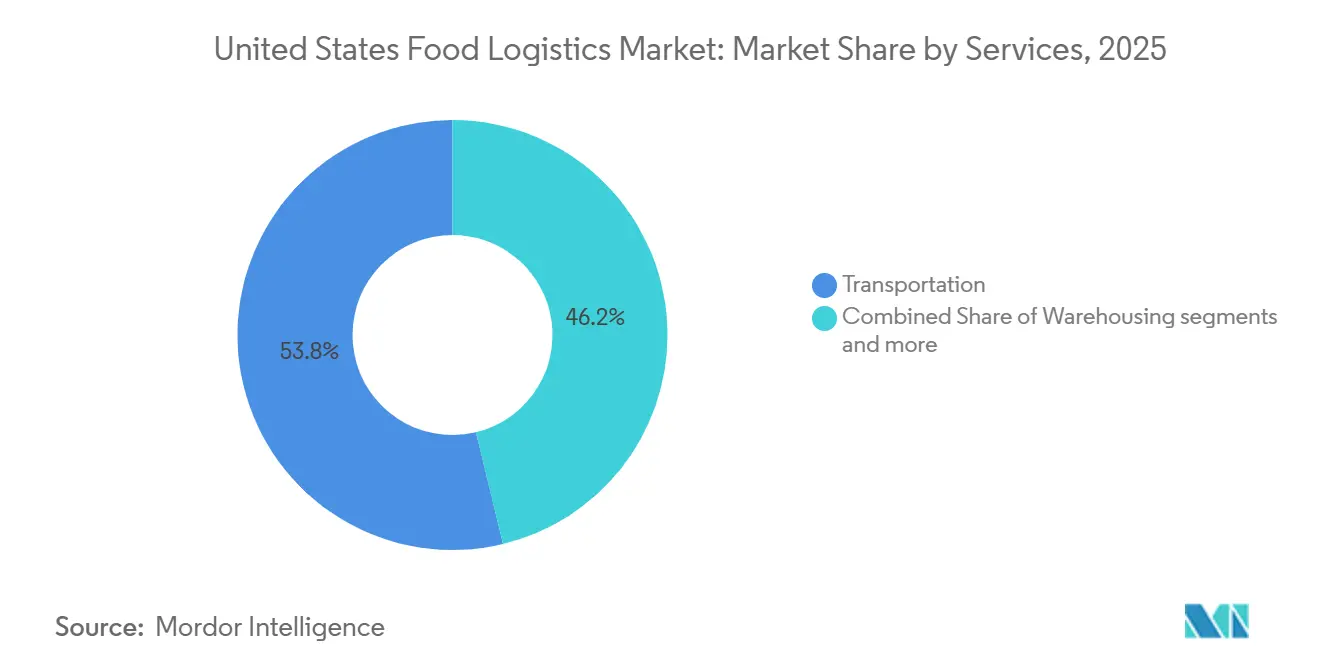
- By services, transportation led with 53.78% of the United States food logistics market share in 2025, while value-added services recorded the fastest growth at 5.8% CAGR to 2031.
- By temperature-control type, cold chain solutions accounted for 64.7% share in 2025. Cold chain is projected to grow at a 5.2% CAGR through 2031.
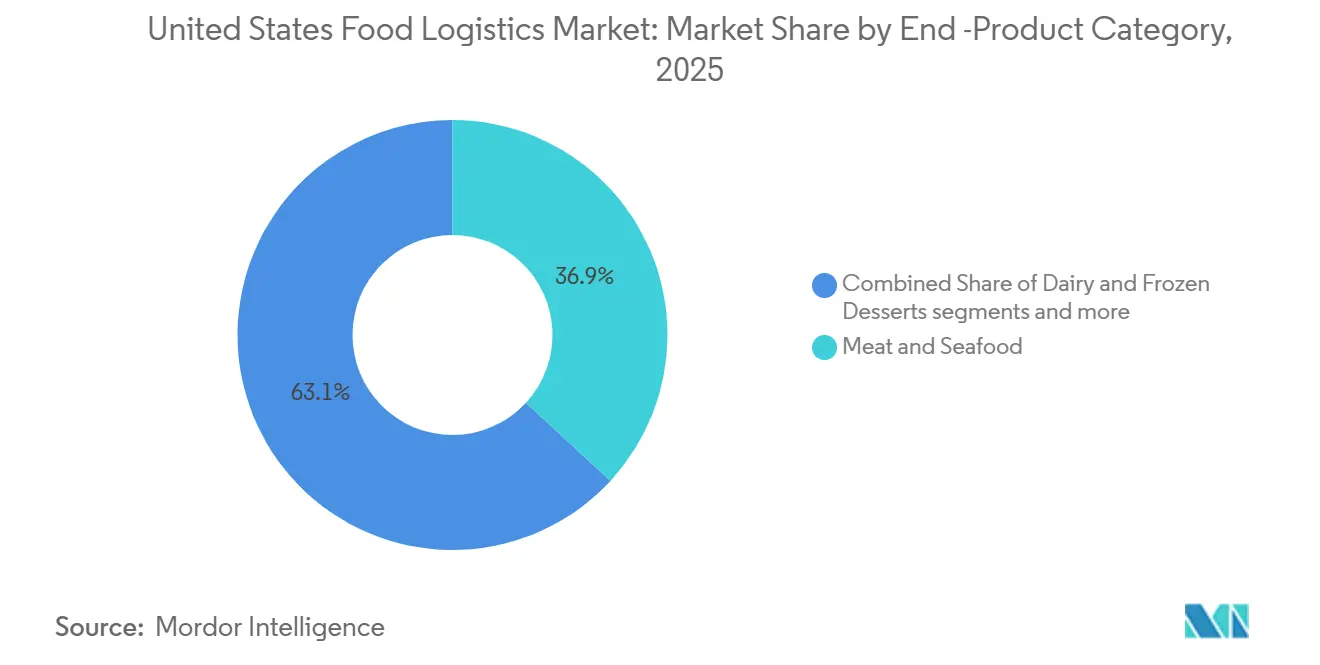
- By end-product category, meat and seafood held the largest share at 36.87% of the United States food logistics market size in 2025, while dairy and frozen desserts registered the top growth at 6.3% CAGR to 2031.
Note: Market size and forecast figures in this report are generated using Mordor Intelligence’s proprietary estimation framework, updated with the latest available data and insights as of January 2026.
United States Food Logistics Market Trends and Insights
Drivers Impact Analysis*
| Driver | (~) % Impact on CAGR Forecast | Geographic Relevance | Impact Timeline |
|---|---|---|---|
| E-commerce and Online Grocery Growth | +0.80% | National, with the highest concentration in coastal metros and Sunbelt expansion zones | Medium term (2–4 years) |
| Cold Chain Infrastructure Expansion | +0.70% | National, with early gains in the Pacific Northwest, the Midwest meat corridors, and Texas distribution hubs | Long term (≥ 4 years) |
| Consumer Demand for Fresh and Perishable Foods | +0.70% | National, particularly urban clusters and high-income demographics | Medium term (2–4 years) |
| Restaurant and Foodservice Industry Recovery | +0.60% | National, with outperformance in high-density urban centers and tourism-dependent regions | Short term (≤ 2 years) |
| Food Safety Regulations and Traceability | +0.50% | National compliance mandate; accelerated adoption in California, the Northeast, and export-oriented facilities | Long term (≥ 4 years) |
| Sustainability and Waste Reduction Initiatives | +0.50% | National, with policy leadership in California, Northeast states, and major metropolitan areas with sustainability ordinances | Long term (≥ 4 years) |
| Source: Mordor Intelligence | |||
E-commerce and Online Grocery Growth
United States retail e-commerce sales reached USD 316.1 billion in Q4 2025, up 5.3% year over year, and full-year 2025 online retail hit USD 1.23 trillion with a 16.4% penetration rate, which increases temperature-controlled deliveries and raises last-mile orchestration complexity across the United States food logistics market. Grocery and food and beverage stores report USD 77.5 billion in January 2026 sales, up 1.9% year over year, underscoring the continued importance of micro-fulfillment and dark-store models for reliable service windows near high-density demand. Networks shift from hub-spoke to spoke-spoke layouts and emphasize smaller drop sizes with higher order frequency, which puts a premium on slotting accuracy and real-time visibility in the United States food logistics market. Perishable fulfillment leaves little tolerance for substitutions or delays, so operators deploy temperature telematics, dynamic routing, and predictive labor planning to protect service levels and reduce spoilage. E-commerce penetration is expected to edge higher in 2026, with food and beverage maintaining momentum as retailers expand owned fleets and click-and-collect options that streamline handoffs and rebalance margin capture in the United States food logistics market[1]U.S. Census Bureau, “Quarterly Retail E-Commerce Sales,” U.S. Census Bureau, census.gov.
Cold Chain Infrastructure Expansion
USDA’s Resilient Food Systems Infrastructure program is channeling funding to aggregation, processing, and cold storage capacity to ease mid-supply chain bottlenecks in perishable categories that rely on dependable temperature control in the United States food logistics market. Additional 2024 awards to independent meat and poultry processors help diversify slaughter capacity and reduce exposure to highly concentrated processing clusters that distort regional flows. USDA’s USD 2 billion for specialty crops recognizes the higher logistics costs for fresh produce and supports climate-controlled transport assets that can lower in-transit loss in berries, leafy greens, and other sensitive SKUs. Private capital aligns with this shift, as DHL Supply Chain’s February 2026 MOU with RLCold targets more than five million square feet of next-generation multi-temperature capacity with FSMA-ready controls and airtight designs that replace aging stock in the United States food logistics market. Groundbreaking-to-ramp timelines of 24 to 36 months stage the relief, but pre-leasing and anchor commitments lock in tenants and pricing, which improves planning horizons for shippers that depend on cold-chain reliability in the United States food logistics market.
Consumer Demand for Fresh and Perishable Foods
Food-away-from-home prices increase in 2026 compared with 2025, yet January 2026 foodservice sales reach USD 92.2 billion and grow 3.9% year over year, which signals durable demand for convenience and sustains frequent deliveries to restaurants. USDA expects beef and veal prices to rise in 2026, with moderated increases in fresh vegetables and flat pricing for fresh fruit, which shapes category-level allocation and promotional pacing in the United States food logistics market. Total nominal food expenditure continued to climb through 2024, and food-away-from-home spending expanded faster than food-at-home, which channels more throughput into institutional formats and demands tight DC-to-store replenishment. Order profiles fragment because the United States food logistics market must serve bulk pallets for retail DCs and high-turn, small-lot runs for restaurants under compressed windows. Per capita vegetable availability fell in 2024, but demand for fresh-cut and minimally processed formats holds, which pushes distributors toward controlled-atmosphere options and ethylene management to extend shelf life.
Restaurant and Foodservice Industry Recovery
Foodservice sales in January 2026 reach USD 92.2 billion, which is a 3.9% year-over-year increase that supports route density and frequent replenishment in urban cores. The sector adds an anticipated 100,000 jobs in 2026, and total employment is 15.8 million, which bolsters institutional and restaurant throughput for the United States food logistics market. The National Restaurant Association projects 2026 sales of USD 1.55 trillion with real gains of 1.3%, which indicates sustained demand despite input cost pressure. Recovery dynamics complicate logistics planning because hybrid schedules at universities and workplaces alter ordering cadences and make route planning less predictable. Independent restaurants and quick-service chains embed third-party delivery and owned fleets into core operations, which fragments last-mile flows and bypasses some traditional broadline distributors. Food-away-from-home prices climb 3.9% in February 2026, so operators seek lower delivery fees and guaranteed windows while logistics providers work to offset wage and fuel inflation with automation and network redesign.
Restraints Impact Analysis*
| Restraint | (~) % Impact on CAGR Forecast | Geographic Relevance | Impact Timeline |
|---|---|---|---|
| Driver Shortage and Labor Challenges | -0.90% | National, acute in long-haul corridors and metros, with a high cost of living | Medium term (2–4 years) |
| Infrastructure Constraints and Congestion | -0.80% | Urban freight corridors: Los Angeles, Atlanta, Chicago, New York, Houston, Dallas-Fort Worth | Short term (≤ 2 years) |
| Food Waste and Spoilage Risks | -0.70% | National, exacerbated in regions with extended transit times and limited cold storage density | Medium term (2–4 years) |
| High Cold Chain Infrastructure Costs | -0.60% | National, concentrated in aging facilities in the Midwest, Northeast, and legacy distribution clusters | Long term (≥ 4 years) |
| Source: Mordor Intelligence | |||
Driver Shortage and Labor Challenges
Transportation sector unemployment reached 5.9% in August 2025, above the national 4.5% rate, while truck transportation employment grew 0.4% year over year, which kept capacity tight and exposed mismatches in driver supply for the United States food logistics market[2]Bureau of Transportation Statistics, “August 2025 U.S. Transportation Sector Unemployment,” U.S. Department of Transportation, bts.gov. The Bureau of Labor Statistics projects 237,600 average annual openings for heavy and tractor-trailer drivers through 2034, driven largely by retirements and career exits, which sustains recruiting pressure despite solid demand. Hours-of-service limits cap daily driving at 11 hours within a 14-hour window and require weekly resets, which constrain asset utilization and force fleets to carry more tractors and drivers for a given route network. Wage inflation in labor-intensive functions such as loading and receiving adds cost at docks, especially in temperature-controlled facilities that must maintain strict standards during peak windows. Leaders invest in automation and robotic retrieval to stabilize throughput, reduce per-order labor, and keep service levels high in the United States food logistics market.
Infrastructure Constraints and Congestion
Urban congestion intensified across major freight corridors in Q4 2024, with Los Angeles reaching 7 hours and 36 minutes of daily delay, which was up 50 minutes from 2023, and Atlanta adding 40 minutes to a 5-hour baseline that lifts last-mile fuel spend by 15% to 20% in dense metros. FHWA’s Urban Congestion Report shows national average congested hours rising by 25 minutes to 3 hours and 29 minutes while the Travel Time Index hit 1.28 and the Planning Time Index reached 2.01 in the October to December 2024 period. Tampa posted the steepest deterioration, with congested hours rising by 1 hour and 30 minutes year over year, which indicates that Sunbelt population growth is outpacing capacity improvements. Chicago added 28 minutes and Dallas-Fort Worth added 41 minutes to reach 4 hours and 38 minutes, which forces temperature-controlled fleets to use predictive routing, tighter time windows, and off-peak delivery programs to protect service levels. Port dwell compounds inland congestion because Los Angeles and Long Beach container terminals average 3.2 days from vessel arrival to gate-out, and refrigerated containers can still face 12 to 18-hour delays during import peaks, which strains the United States food logistics market. The Bipartisan Infrastructure Law funds highways and bridges through 2026, yet a limited share is freight-specific, so operators redesign networks toward exurban distribution centers 30 to 50 miles from demand centers, which trades proximity for velocity and can raise last-mile costs within 18 to 24 months.
*Our forecasts treat driver/restraint impacts as directional, not additive. The impact forecasts reflect baseline growth, mix effects, and variable interactions.
Segment Analysis
By Services: Modal Fragmentation Accelerates Value-Added Growth
Transportation services captured 53.78% of the United States food logistics market share in 2025, confirming the central role of road, rail, water, and air networks to align perishables with service windows across national and cross-border flows. Road transport supports last-mile precision and door-to-door control over temperature, while rail intermodal and refrigerated containers gain share where time sensitivity allows multi-day transits for frozen proteins and grains. Waterborne imports move produce and seafood through Savannah, Long Beach, and Newark, and air remains a targeted option for high-value seafood. Value-added services expand at 5.8% annually as operators embed co-packing, kitting, labeling, and postponement tactics that reduce finished-goods risk and respond faster to real demand signals in the United States food logistics market. These capabilities move the profit pool from cubic footage toward complexity management and traceability-ready execution that supports regulated categories and rapid channel shifts.
Warehousing anchors cross-docking, order consolidation, and temperature stabilization between production and outbound flows, and dwell lengths reflect the added traceability steps required for event-level verification in covered categories. Leading networks deploy automated retrieval and warehouse execution software to compress pick-to-ship cycles, protect product integrity, and reduce energy per pallet in the United States food logistics market. Legacy facilities without automation or energy retrofits face pressure from rising labor and utility costs, while technology-forward nodes price at a premium for bundled co-packing and audit-ready visibility. The United States food logistics market rewards providers that integrate transportation, warehousing, and value-added operations under one control tower to reduce touches and exception rates. The United States food logistics market size for value-added services is projected to expand at a 5.8% CAGR between 2026 and 2031, reflecting durable demand for traceability, postponement, and compliance support. Operators in the United States food logistics industry that standardize automation, software, and renewable energy adoption across sites improve margins and resilience against labor and energy volatility.


By Temperature-Control Type: Cold Chain Dominates Across Multiple Thermal Bands
Cold chain solutions commanded 64.7% of the United States food logistics market share in 2025 and are expanding at a 5.2% CAGR, spanning ambient 15-25°C, chilled 2-8°C, and frozen below 0°C to serve proteins, dairy, produce, and pharmaceuticals that require strict thermal management. Frozen operations retain the largest installed capacity because of long-standing investments in blast freezing, sub-zero storage, and insulated linehaul for proteins, prepared meals, and frozen desserts that rely on long shelf life. Multi-year contracts with foodservice distributors, retail private-label manufacturers, and export-focused processors anchor throughput and emphasize predictable flows that match freezer capacity. Chilled flows are gaining as biologics and narrow-band pharmaceuticals increase, and retailers scale fresh-cut produce programs that reduce consumer prep and compress shelf life, which elevates the value of telemetry and rapid-response controls in the United States food logistics market. The United States food logistics market size for cold chain is projected to expand at a 5.2% annual rate through 2031 as both healthcare and high-turn fresh food categories reinforce temperature-critical handling.
Ambient cold chain in the 15-25°C band serves sensitive items that tolerate wider temperature swings than chilled or frozen but still require humidity control, insulated transport, and climate stability to avoid condensation and pest risk. These include selected fresh produce, bakery items, and specialty ingredients that degrade if exposed to uncontrolled temperature extremes during multi-day transit. Non-cold chain logistics covers shelf-stable canned goods, dry grains, packaged snacks, and ambient beverages, which grow more slowly as consumer preferences tilt toward fresh and minimally processed options. Throughput velocity and margin per pallet now define the temperature hierarchy, with frozen leading on installed cubic feet, chilled on transaction frequency and pricing power, and ambient on geographic reach across metro and rural trade areas in the United States food logistics market. Multi-temperature facilities share labor, plant capacity, and dock assets to lower cost per case while preserving safety and quality, though design complexity and upfront capital needs limit these builds to large anchor projects that suit the United States food logistics industry.
By End-Product Category: Dairy Ascends While Meat Retains Largest Share
Meat and seafood accounted for 36.87% of end-product throughput in 2025, underscoring its volumetric density, high per-unit value, and stringent cold-chain standards that support premium logistics spend across the United States food logistics market. Federal support in 2024 for independent meat and poultry processors expanded regional capacity and created new anchor nodes for temperature-controlled holding and co-packing near slaughter facilities. USDA expects beef and veal prices to increase in 2026 as supply tightens, which reinforces the need for segregated handling and rapid inspection turnarounds to reduce dwell. Dairy and frozen desserts are the fastest-growing category at a 6.3% CAGR, supported by direct-to-consumer subscriptions for specialty cheeses, organic milk, and premium ice cream that demand fragmented last-mile cold delivery in the United States food logistics market. The United States food logistics market size for dairy and frozen desserts is expected to grow at a 6.3% CAGR through 2031 as premium positioning and home delivery intensify category-level demand for precise temperature control.
Fresh produce faces tight availability in 2024 data, while demand for fresh-cut formats persists, so distributors adopt controlled-atmosphere transport and ethylene mitigation to protect shelf life in the United States food logistics market. Imports dominate fresh vegetable supply, with Mexico as the lead source for key items, which concentrates inspections and temperature checks at southern crossings and lengthens stop times during peak seasons. USDA’s USD 2 billion specialty crop initiative targets temperature and humidity-controlled transport equipment to reduce in-transit loss that can consume significant shares of produce loads before they reach retail USDA.GOV. Processed foods and ready-to-eat meals occupy a steady mid-tier position with longer shelf life than fresh produce, though temperature vigilance remains central to preserving sensory quality and food safety during distribution. The “others” bucket contains niche flows such as edible oils, condiments, and specialty ingredients that increasingly require segregated handling to meet allergen-free and organic certifications demanded by buyers across the United States food logistics market.
Geography Analysis
Regional patterns are shaped by production clusters, port concentration, and population density, which together define storage placement, mode mix, and last-mile costs in the United States food logistics market. The Midwest holds dense meat and poultry processing, with states like Nebraska, Iowa, Kansas, and South Dakota anchoring slaughter capacity and requiring cold storage near plants to manage post-harvest stabilization. Many assets need modernization, and USDA’s resilient infrastructure funding is structured to address cooling upgrades and capacity gaps over the medium term. The Pacific Northwest remains vital for fruit and vegetable flows and seafood, where port adjacency supports imports and coastal distribution, with portfolio moves by leading cold-storage operators confirming strategic positioning at these nodes.
The South Atlantic and Southeast regions, including Florida, Georgia, North Carolina, and Texas, show fast growth due to population migration, tourism-driven demand, and rising import volumes through Savannah and Houston. Texas has been a priority for automated capacity tied to meat and poultry distribution into Dallas-Fort Worth, Austin, and Houston, as strategic projects moved forward in 2025. Florida straddles fresh produce supply and tourism, which creates balanced headhaul and backhaul opportunities that reduce empty miles. The Northeast corridor commands premium pricing as congestion intensifies, which compresses delivery windows and raises last-mile costs relative to less dense metros. Zero-emission mandates in certain states and metros push operators to pilot electric trucks and renewable energy at warehouses to maintain service and comply with evolving regulations.
The West Coast, led by California, generates significant revenue in the United States food logistics market because of heavy agricultural output and inbound containers through Los Angeles-Long Beach and Oakland. Congestion in Los Angeles increased in late 2024 and continues to compound dwell and rehandling at urban docks, which encourages inland DC siting to trade proximity for velocity. Regional compliance drivers for clean fleets and cold storage efficiency add capital needs but also open room for differentiation by operators with scalable renewable energy strategies and equipment refresh programs. The Mountain West and Great Plains continue to support grain, pulses, and organics with intermodal rail links into export lanes, which keep a baseline of ambient and chilled flows in those corridors. Multi-region partnerships focused on new multi-temperature capacity aim to balance proximity to farms with access to major consumption centers, a mix that favors secondary metros with lower land costs and strong interstate access.
Competitive Landscape
The United States food logistics market shows moderate concentration where a handful of integrated cold storage leaders control significant capacity, while strong regional operators hold anchor relationships in local distribution ecosystems. Competition is driven more by service depth and technology than by base price, and automation is central to lifting throughput, reducing energy per pallet, and stabilizing service in tight labor conditions. Lineage Logistics has expanded automation and software adoption throughout its network, positioning those capabilities as a hedge against labor shortages and as a baseline for traceability-ready workflows. Following its 2024 IPO, Lineage accelerated capital deployment into construction and acquisitions to consolidate regional gaps and align capacity with regulated categories and export corridors.
Americold increased assets under construction in 2025 and leaned into store-support and retail solutions that fold fulfillment, cross-docking, and last-mile staging into single sites, which lowers customer touches and improves visibility. DHL Supply Chain’s 2026 MOU with RLCold targets multi-temperature, FSMA-compliant capacity that uses airtight construction, advanced refrigeration controls, and energy solutions to replace aging stock. XPO refreshed its fleet and continued to improve on-time performance, while piloting electric trucks and building out charging infrastructure in compliance-sensitive regions that demand lower emissions on the last mile. The combination of execution capacity with sustainability credentials is becoming a standard bid requirement for anchor contracts in dense metros.
Sustainability retrofits stand out as a white-space vector in the United States food logistics market, with on-site solar, battery storage, and energy management software reducing per-unit utility costs and emissions. Lineage reported large-scale solar deployments that reduced kilowatt-hours per pallet in automated sites relative to comparable conventional facilities, suggesting that environmental performance and cost efficiency align. Smaller specialists pursue hyperlocal nodes of 5,000 to 10,000 square feet that enable two-hour grocery delivery and bypass older hub-spoke structures, which changes the margin split between intermediaries and operators that control these assets. Emergent IP in robotics, energy, and analytics reinforces the transition from real estate focus to technology-enabled services that can scale quality controls and compliance across diverse product sets.
United States Food Logistics Industry Leaders
Lineage Logistics
Americold Logistics
XPO Logistics
J.B. Hunt Transport Services
FedEx Logistics
- *Disclaimer: Major Players sorted in no particular order

Recent Industry Developments
- March 2026: Lineage, Inc. declared an increased dividend for the first quarter of 2026, reflecting confidence in operational cash flow generation and signaling continued shareholder returns despite ongoing capital deployment in automation and greenfield construction.
- February 2026: DHL Supply Chain signed a Memorandum of Understanding with RLCold to accelerate the development of over five million square feet of advanced temperature-controlled facilities across the United States, targeting next-generation food and beverage cold-chain infrastructure with multi-temperature zones, FDA FSMA compliance, humidity management, and sustainable energy solutions.
- February 2026: USDA proposed updates to federal line speed regulations in poultry and pork establishments operating under modern inspection systems, aimed at lowering food costs for consumers, reducing regulatory barriers for processors, and supporting a more efficient food supply chain while maintaining full federal oversight.
- February 2026: Americold Realty Trust announced fourth quarter and full year 2025 results, highlighting assets under construction increasing to USD 756.8 million, strengthened balance sheet initiatives, expansion into high-value retail and store-support solutions, and the appointment of Chris Papa as Chief Financial Officer to bolster capabilities for the next phase of strategic execution.


United States Food Logistics Market Report Scope
The United States Food Logistics Market Report is Segmented by Services (Transportation, Warehousing, Value-Added Services and Others), by Temperature-Control Type (Cold Chain and Non-Cold Chain), by End-Product Category (Meat & Seafood, Dairy & Frozen Desserts, Fruits & Vegetables, Food and Beverages, and Others). The Market Forecasts are Provided in Terms of Value USD.
| Transportation | Road |
| Rail | |
| Water | |
| Air | |
| Warehousing | |
| Value-Added Services and Others |
| Cold Chain | Ambient 15-25 °C |
| Chilled 2-8 °C | |
| Frozen Less than 0 °C | |
| Non-Cold Chain |
| Meat & Seafood |
| Dairy & Frozen Desserts |
| Fruits & Vegetables |
| Food and Beverages |
| Others |
| By Services | Transportation | Road |
| Rail | ||
| Water | ||
| Air | ||
| Warehousing | ||
| Value-Added Services and Others | ||
| By Temperature-Control Type | Cold Chain | Ambient 15-25 °C |
| Chilled 2-8 °C | ||
| Frozen Less than 0 °C | ||
| Non-Cold Chain | ||
| By End-Product Category | Meat & Seafood | |
| Dairy & Frozen Desserts | ||
| Fruits & Vegetables | ||
| Food and Beverages | ||
| Others | ||


Key Questions Answered in the Report
What is the current size and growth outlook for the United States food logistics market?
The United States food logistics market size is USD 240.76 billion in 2026 and is on track to reach USD 296.97 billion by 2031 at a 4.29% CAGR.
Which service category is the largest and which is growing fastest in the United States food logistics market?
Transportation led with 53.78% share in 2025, while value-added services are the fastest growing at 5.82% CAGR to 2031.
How is temperature-control demand shifting in the United States food logistics market?
Cold Chain holds the majority at 64.67% share, with a growing CAGR of 7.23% due to increasing demand for temperature-sensitive food products, rising e-commerce penetration, and stricter food safety regulations in the United States.
Which end-product categories drive volume and growth in the United States food logistics market?
Meat and seafood hold the largest 2025 share at 36.87%, and dairy and frozen desserts lead growth at 6.31% CAGR to 2031.
What regulatory changes will shape network design in the United States food logistics market through 2028?
FDA extended the Food Traceability Rule compliance date to July 2028, which accelerates adoption of event-level data capture and interoperable systems across warehousing and transport.
Where are infrastructure investments most likely to relieve capacity pressure in the United States food logistics market?
USDA programs and private MOUs target new and modernized multi-temperature capacity across the Pacific Northwest, Midwest meat corridors, Texas hubs, and port-proximate nodes, with ramp-ups expected 24 to 36 months after groundbreaking.
Page last updated on:


