Mexico Food Logistics Market Size and Share
Market Overview
| Study Period | 2020 - 2031 |
|---|---|
| Forecast Data Period | 2026 - 2031 |
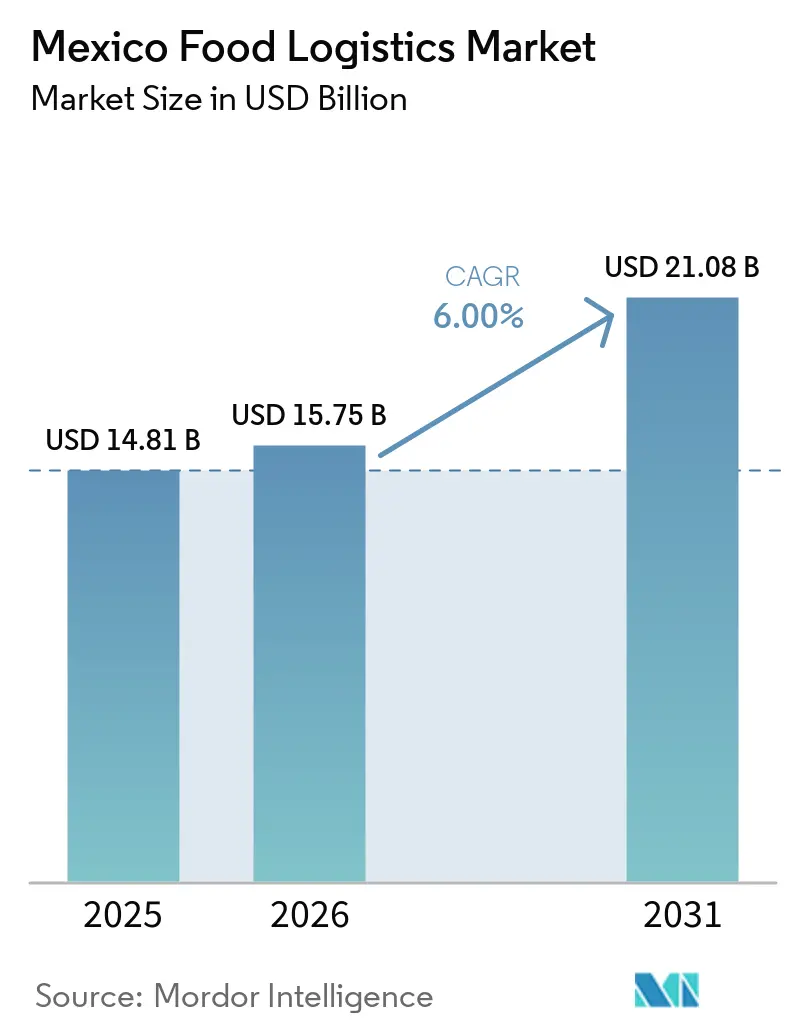
| Base Year Market Size (2025) | USD 14.81 Billion |
| Market Size (2026) | USD 15.75 Billion |
| Market Size (2031) | USD 21.08 Billion |
| Growth Rate (2026 - 2031) | 6.00% CAGR |
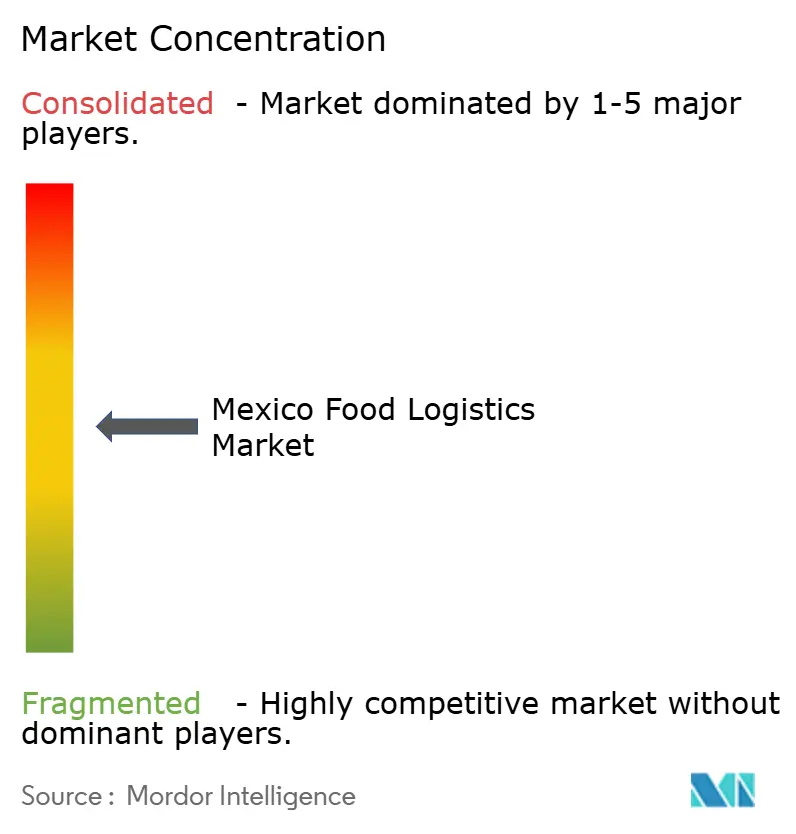
| Market Concentration | Medium |
Major Players *Disclaimer: Major Players sorted in no particular order Image © Mordor Intelligence. Reuse requires attribution under CC BY 4.0. | |
Mexico Food Logistics Market Analysis by Mordor Intelligence
The Mexico food logistics market size is projected to expand from USD 14.81 billion in 2025 and USD 15.75 billion in 2026 to USD 21.08 billion by 2031, registering a CAGR of 6% between 2026 to 2031.
Retail-driven blockchain traceability rules, government tax incentives for energy-efficient refrigeration, and cargo diversions from the Panama Canal are reshaping competitive priorities across the Mexico food logistics market. Transportation continues to hold a numerical lead, yet value-added services such as blast freezing and inventory optimization are expanding more quickly as shippers look for integrated solutions. Shore-power infrastructure at Manzanillo, Lazaro Cardenas, and Veracruz reduces diesel costs for refrigerated containers and rewards operators able to access electrified berths. Rail investments connecting inland hubs to Gulf and Pacific ports widen modal options, while technician shortages, volatile electricity tariffs, and seasonal reefer-container scarcity temper service reliability.
Key Report Takeaways
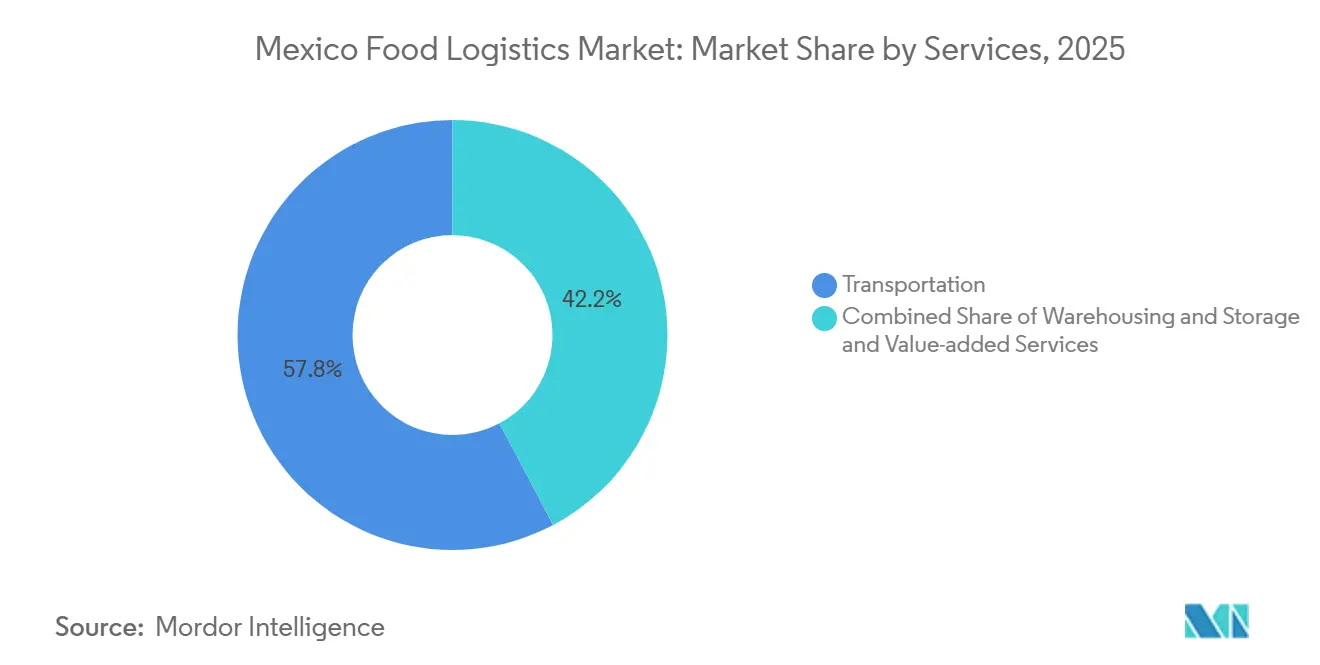
- By service type, transportation captured 57.77% of the Mexico food logistics market share in 2025, while value-added services are projected to post the fastest growth at an 8.56% CAGR through 2031.
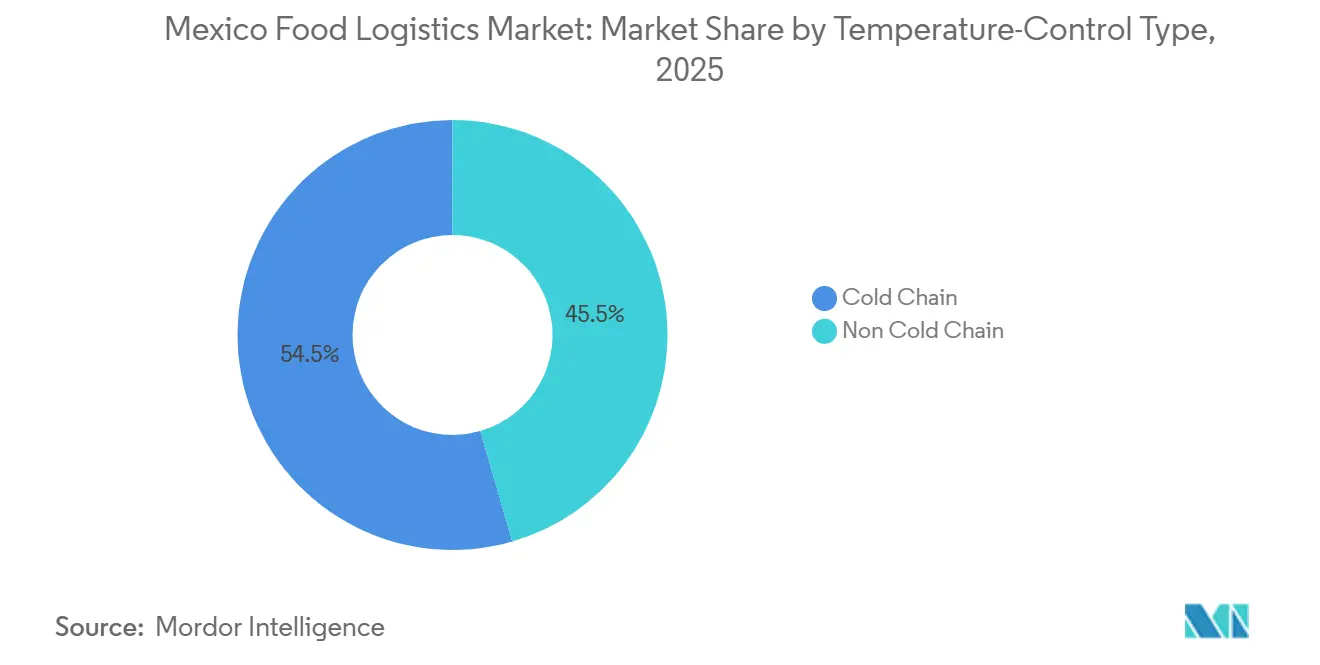
- By temperature-control, cold chain operations accounted for 54.49% of the Mexico food logistics market size in 2025 and are expected to advance at a 7.43% CAGR to 2031.
- By end-product category, horticulture led with 29.64% revenue share in 2025, whereas pet food is forecast to expand at an 8.85% CAGR between 2026 and 2031.
Note: Market size and forecast figures in this report are generated using Mordor Intelligence’s proprietary estimation framework, updated with the latest available data and insights as of January 2026.
Mexico Food Logistics Market Trends and Insights
Drivers Impact Analysis*
| Driver | (~) % Impact on CAGR Forecast | Geographic Relevance | Impact Timeline |
|---|---|---|---|
| Government Tax Incentives for Energy-Efficient Refrigeration Retrofits | +0.9% | National, industrial corridors | Medium term (2-4 years) |
| Expansion of Refrigerated Rail Spur Connections at Inland Logistics Parks | +1.2% | Central, Bajío, northern corridors | Long term (≥ 4 years) |
| Retail-Driven Blockchain Traceability Mandates Accelerating Cold-Chain Upgrades | +0.8% | National, export regions | Short term (≤ 2 years) |
| Cargo-Flow Diversion from Pacific to Gulf Ports | +1.4% | Gulf Coast ports | Medium term (2-4 years) |
| Consolidation of Micro-Carriers into Cooperative Fleets | +0.7% | Regional corridors | Medium term (2-4 years) |
| Shore-Power Infrastructure at Ports | +0.6% | Manzanillo, Lázaro Cárdenas, Veracruz | Long term (≥ 4 years) |
| Source: Mordor Intelligence | |||
Government Tax Incentives for Energy-Efficient Refrigeration Retrofits
Fiscal programs administered by CONUEE allow 20-30% of retrofit spending to be offset through accelerated depreciation and direct tax credits, improving return profiles for mid-sized firms upgrading legacy compressors and insulation. Operators able to certify energy savings see lower operating costs and gain preference from food brands pursuing carbon cuts. Administrative complexity limits participation by very small fleets, but the policy’s multi-year horizon underpins steady capital spending, lifting service quality across the Mexico food logistics market.
Expansion of Refrigerated Rail Spur Connections at Inland Logistics Parks
Completion of the Isthmus of Tehuantepec corridor and CPKC’s USD 127 million cold hub expands rail access for perishables moving more than 800 km. Lower theft exposure and fuel savings attract exporters of berries, avocados, and frozen proteins. Daily-service limitations and fixed scheduling mean trucking still dominates final-mile legs, yet the modal diversification reduces congestion risks for the Mexico food logistics market[1]Comisión Nacional de Sanidad, Inocuidad y Calidad Agroalimentaria, “Reglamentos SENASICA,” senasica.gob.mx.
Retail-Driven Blockchain Traceability Mandates Accelerating Cold-Chain Upgrades
Walmart de Mexico, Soriana, and other chains require 5-minute interval temperature records stored on blockchain platforms, pressuring carriers to adopt IoT sensors and data gateways. Cloud-based subscriptions lower entry barriers, but maintaining multiple formats for different retailers raises IT overhead. Operators complying first capture higher-margin lanes and strengthen reputations in the Mexican food logistics market.
Cargo-Flow Diversion from Pacific to Gulf Ports
Panama Canal transit caps shift Asian shipments to Veracruz and Altamira, adding backhaul demand for Mexican produce bound for Asia and the EU. Port authorities fast-track reefer yard extensions and shore-power hookups, yet limited rail and crane capacity cause peak-season congestion. Network redesign costs challenge smaller forwarders serving the Mexico food logistics market.
Restraints Impact Analysis*
| Restraint | (~) % Impact on CAGR Forecast | Geographic Relevance | Impact Timeline |
|---|---|---|---|
| Shortage of Certified Refrigeration Technicians | –0.8% | National, secondary markets | Long term (≥ 4 years) |
| Stringent Sanitary-Import Inspections Causing Border Dwell Times | –0.6% | Laredo, Pharr crossings | Medium term (2-4 years) |
| Seasonal Scarcity of Food-Grade ISO Reefer Containers | –0.5% | Pacific ports, produce regions | Short term (≤ 2 years) |
| Volatile Electricity Tariffs Undermining Cold-Storage Cost Predictability | –0.7% | National, independent warehouses | Medium term (2-4 years) |
| Source: Mordor Intelligence | |||
Shortage of Certified Refrigeration Technicians Lengthening Maintenance Cycles
Demand for ammonia and CO₂ system specialists exceeds vocational-school output, inflating wages by up to 40% and extending out-of-service intervals during peak harvests. Larger fleets fund in-house academies, yet need two to three years to certify staff. Smaller firms rely on general mechanics, raising failure risk and uneven service quality within the Mexico food logistics market.
Stringent Sanitary-Import Inspections Causing Prolonged Border Dwell Times
Average reefer wait at Laredo now spans 8-12 hours, doubling fuel consumption for gensets maintaining set points. Advanced documentation portals shorten clearance for prepared operators, but limited refrigerated holding rooms still create bottlenecks at peak periods, slowing cross-border velocity for the Mexico food logistics market.
*Our forecasts treat driver/restraint impacts as directional, not additive. The impact forecasts reflect baseline growth, mix effects, and variable interactions.
Segment Analysis
By Service Type: Transportation Dominance Meets Value-Added Momentum
Transportation accounted for 57.77% of the Mexico food logistics market size in 2025, yet its share inches downward as shippers diversify toward integrated packages. Value-added services such as blast freezing and quality inspections draw a projected 8.56% CAGR, signaling that functional expertise now rivals simple line-haul capacity for market leadership.
Road remains essential for sub-500 km hauls, while the rail cold hub network lengthens reach to both coasts. Warehousing aligns with nearshoring, adding cross-dock nodes close to production centers. Together these shifts redefine the Mexico food logistics market as a spectrum of blended offerings rather than siloed service lanes.


By Temperature-Control: Cold Chain Investments Outpace Ambient Options
Cold chain operations captured 54.49% of the Mexico food logistics market share in 2025 and led growth at a 7.43% CAGR, underlining how traceability rules convert temperature compliance into a purchasing criterion. Chilled (2–8 °C) volumes dominate, but frozen capacity earns higher yields per cubic meter. Multi-temperature trucks enable route consolidation, optimizing asset turns and reinforcing the Mexico food logistics market size expansion.
Ambient services face pricing pressure as grain and canned-goods owners seek bundled contracts with providers that can also move perishables. Blockchain reporting pushes even ambient cargo to adopt sensor tracking, further blurring cold and non-cold boundaries inside the Mexico food logistics market[2]SupplyChain247 Staff, “Lineage Tops 2025 List of Largest Cold Storage Warehouses,” supplychain247.com .
By End-Product Category: Horticulture Leads, Pet Food Rises
Horticulture retained 29.64% of the Mexico food logistics market size in 2025 as Mexico’s produce remains central to the United States winter supply chains. Pet food, strengthened by fresh and refrigerated SKUs, records the fastest 8.85% CAGR, driven by new factories serving North American demand. Meat, seafood, and poultry rely on strict SENASICA oversight, rewarding carriers fluent in biosafety norms across the Mexico food logistics market.
Premium dairy and frozen dessert makers require sub-zero storage with variable-speed compressors, while processed-food consignors appreciate longer shelf lives but now request traceability affidavits mirroring those in sensitive categories. Specialty items like mole and artisanal cheeses open export niches, enriching category diversity within the Mexico food logistics market.
Geography Analysis
Northern border states amass the densest cold chain footprint, propelled by maquiladora output and cross-border perishables volumes. Nuevo León hosts multi-temperature distribution centers that backhaul United States retail returns, reinforcing its role in the Mexico food logistics market. Security risks along Highway 57 encourage shippers to favor CPKC rail links that bypass high-theft corridors.
The Bajío corridor leverages new refrigerated rail spurs to support both automotive suppliers and food processors, blending industrial and agricultural flows. Central Mexico, anchored by Mexico City’s 20 million residents, absorbs the largest consumption share yet struggles with congestion; operators invest in satellite hubs at Queretaro and Puebla to stage last-mile routes efficiently.
Pacific ports, notably Manzanillo, process Asian goods and high-value mango and berry exports, but drought-driven Panama Canal limits steer some inbound flows toward Veracruz. Southern states remain underserved, despite ample tropical fruit harvests, highlighting a development gap the Mexico food logistics market is likely to address as infrastructure spending spreads southward[3]The Loadstar, “Mexican President to Launch Major Expansion at Manzanillo,” theloadstar.com .
Competitive Landscape
The Mexico food logistics market comprises global integrators such as DHL, Kuehne + Nagel, and DSV, domestic conglomerates like Traxion, and cooperative fleets formed by micro-carriers. Scale players exploit digital control towers and IoT temperature tags to secure premium retail contracts. Traxion’s 2025 purchase of Solistica created the country’s largest integrated platform, blending truckload, 4PL, and cold storage operations. Emergent Cold Latin America and Frialsa Frigoríficos expand cubic capacity to meet e-commerce grocery growth, while Americold partners with CPKC on rail-based cold hubs that widen geographic coverage.
Cooperative truck groups negotiate collective fuel and maintenance rates, filling rural first-mile gaps and injecting fresh rivalry into the Mexico food logistics market. Competitive advantage tilts toward firms mastering compliance: SENASICA protocols, CFE tariff hedging, and blockchain data feeds. Operators unable to finance energy-efficient retrofits or technician training risk margin squeeze and contract loss. Consolidation pressures rise, yet fragmented niches persist where local familiarity outweighs scale[4]Lloyd’s List, “Asian Container Lines Team Up to Launch New Mexican Route,” lloydslist.com .
Mexico Food Logistics Industry Leaders
Traxion
DHL Supply Chain Mexico
Frialsa Frigoríficos
Kuehne + Nagel
Emergent Cold LatAm
- *Disclaimer: Major Players sorted in no particular order

Recent Industry Developments
- March 2026: DHL expanded its global airfreight cold chain network, which can indirectly influence best practice cold logistics and infrastructure growth in connected regions (e.g., North America / Mexico).
- February 2026: DHL Supply Chain signed a memorandum of understanding (MOU) with real estate developer RLCold to jointly develop >5 million ft² of cold storage facilities in North America (driven by online grocery and food delivery demand).
- December 2025: DHL Express Mexico completed a USD 81 million expansion initiative, increasing its ground fleet by ~20% and opening ~100 new service points across Mexico in 2025. This strengthened last mile logistical capacity and overall infrastructure relevant for food logistics and express perishable transport.
- December 2025: Americold announced a partnership with On the Run (OTR) to support its convenience store distribution supply chains in Australia, signaling expansion into new segments. Though outside Mexico, it underscores Americold’s broader cold chain growth strategy that influences its global footprint.


Mexico Food Logistics Market Report Scope
| Transportation | Road |
| Rail | |
| Sea and Inland Water | |
| Air | |
| Warehousing and Storage | |
| Value-added Services (Blast Freezing, Labeling, Inventory Management, etc.) |
| Cold Chain | Ambient (15-25 °C) |
| Chilled (2–8 °C) | |
| Frozen (Less than 0 °C) | |
| Non Cold Chain |
| Meat, Seafood, and Poultry |
| Dairy Products and Frozen Deserts (Milk, Ice-cream, Butter, etc.) |
| Horticulture (Fresh Fruits & Vegetables) |
| Processed Food Products |
| Pet Food |
| Others (Spreads, Seasoning, dressing, Specialty & Functional Foods, etc.) |
| By Services | Transportation | Road |
| Rail | ||
| Sea and Inland Water | ||
| Air | ||
| Warehousing and Storage | ||
| Value-added Services (Blast Freezing, Labeling, Inventory Management, etc.) | ||
| By Temperature-Control Type | Cold Chain | Ambient (15-25 °C) |
| Chilled (2–8 °C) | ||
| Frozen (Less than 0 °C) | ||
| Non Cold Chain | ||
| By End-Product Category | Meat, Seafood, and Poultry | |
| Dairy Products and Frozen Deserts (Milk, Ice-cream, Butter, etc.) | ||
| Horticulture (Fresh Fruits & Vegetables) | ||
| Processed Food Products | ||
| Pet Food | ||
| Others (Spreads, Seasoning, dressing, Specialty & Functional Foods, etc.) | ||


Key Questions Answered in the Report
How fast is the Mexico food logistics market expected to grow?
The market is forecast to rise from USD 15.75 billion in 2026 to USD 21.08 billion by 2031 at a 6% CAGR.
Which service type contributes the most revenue?
Transportation held 57.77% of 2025 revenue, but its lead is narrowing as shippers seek value-added capabilities.
Why are cold chain services expanding more quickly than ambient services?
Retail blockchain mandates and export quality standards demand continuous temperature control, driving a 7.43% CAGR in cold chain revenue.
What bottlenecks affect cross-border refrigerated trade?
Rigorous SENASICA inspections extend dwell times to 8–12 hours, increasing fuel costs and complicating delivery schedules.
How are security challenges impacting operators?
Elevated cargo-theft rates along key corridors add 0.5-1.0% insurance premiums and prompt investment in escorts and tracking, raising operating costs and influencing route choices.
How are energy costs influencing warehouse investment?
CFE tariff volatility of 15–20% between bills pressures operators to adopt on-site generation and energy-management systems to stabilize expenses.
Page last updated on:


