India Dairy Market Size and Share
Market Overview
| Study Period | 2021 - 2031 |
|---|---|
| Forecast Data Period | 2026 - 2031 |
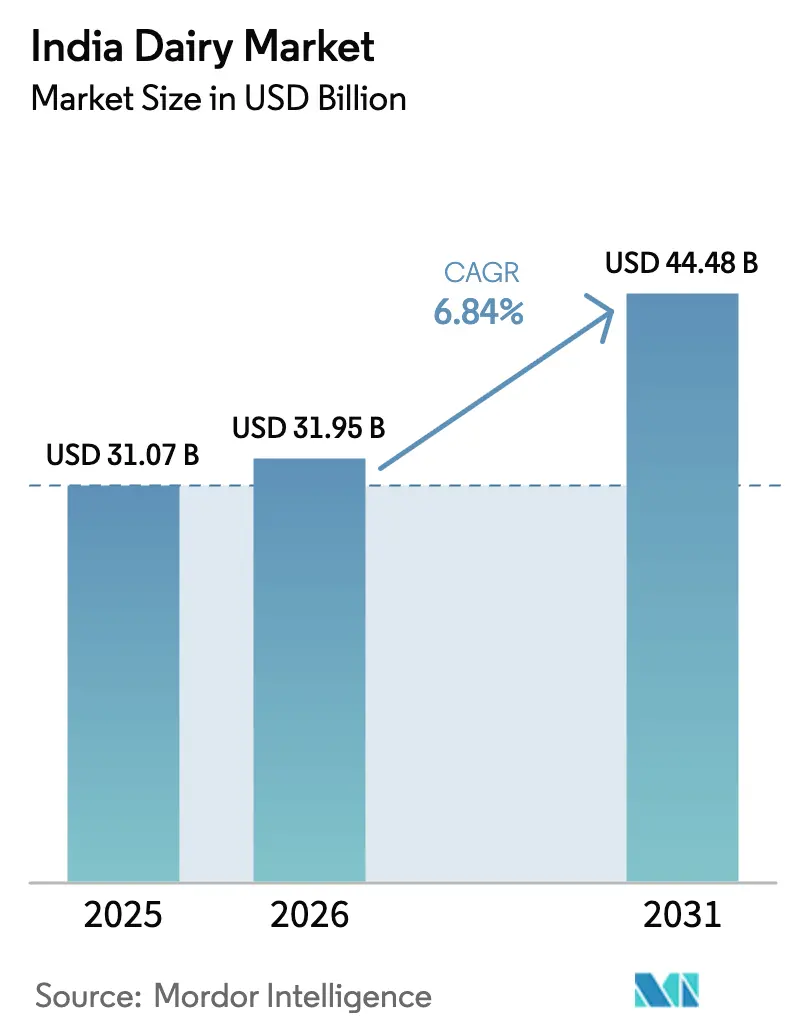
| Base Year Market Size (2025) | USD 31.07 Billion |
| Market Size (2026) | USD 31.95 Billion |
| Market Size (2031) | USD 44.48 Billion |
| Growth Rate (2026 - 2031) | 6.84% CAGR |
| Market Concentration | Low |
Major Players
*Disclaimer: Major Players sorted in no particular order Image © Mordor Intelligence. Reuse requires attribution under CC BY 4.0. |
|
India Dairy Market Analysis by Mordor Intelligence
The India dairy market size expanded from USD 31.07 billion in 2025 to USD 31.95 billion in 2026 and is projected to reach USD 44.48 billion by 2031, registering a 6.84% CAGR from 2026 to 2031. In 2023-24, India solidified its status as the world's top milk producer, churning out 239.3 million tonnes, thanks to the efforts of 80 million dairy farmers and a cooperative system that handles over 60% of the marketed milk[1]Source: Department of Animal Husbandry and Dairy, "India's Dairy Sector,"dahd.nic.in. With rising disposable incomes, an expanding organized retail sector, and broader cold-chain coverage, the Indian dairy market is pivoting towards value-added products that yield higher margins. Branded companies are leveraging digital traceability, aseptic packaging, and IoT-driven quality assessments to curb the leakages that have long troubled fragmented smallholder supply chains. Urban consumers, associating protein density with wellness, are driving the premiumization trend, favoring Greek yogurt, fortified milk, and high-protein cheese. Quick-commerce platforms like Blinkit and Zepto are revolutionizing delivery, shrinking windows to just 15 minutes. This has ignited a demand for short-shelf-life products in tier-2 cities, areas that until 2024, struggled with reliable cold-chain facilities. Both cooperatives and private processors are ramping up research and development, crafting region-specific products like turmeric-infused A2 milk, beetroot yogurt, and mango lassi protein shakes, blending traditional flavors with contemporary health trends.
Key Report Takeaways
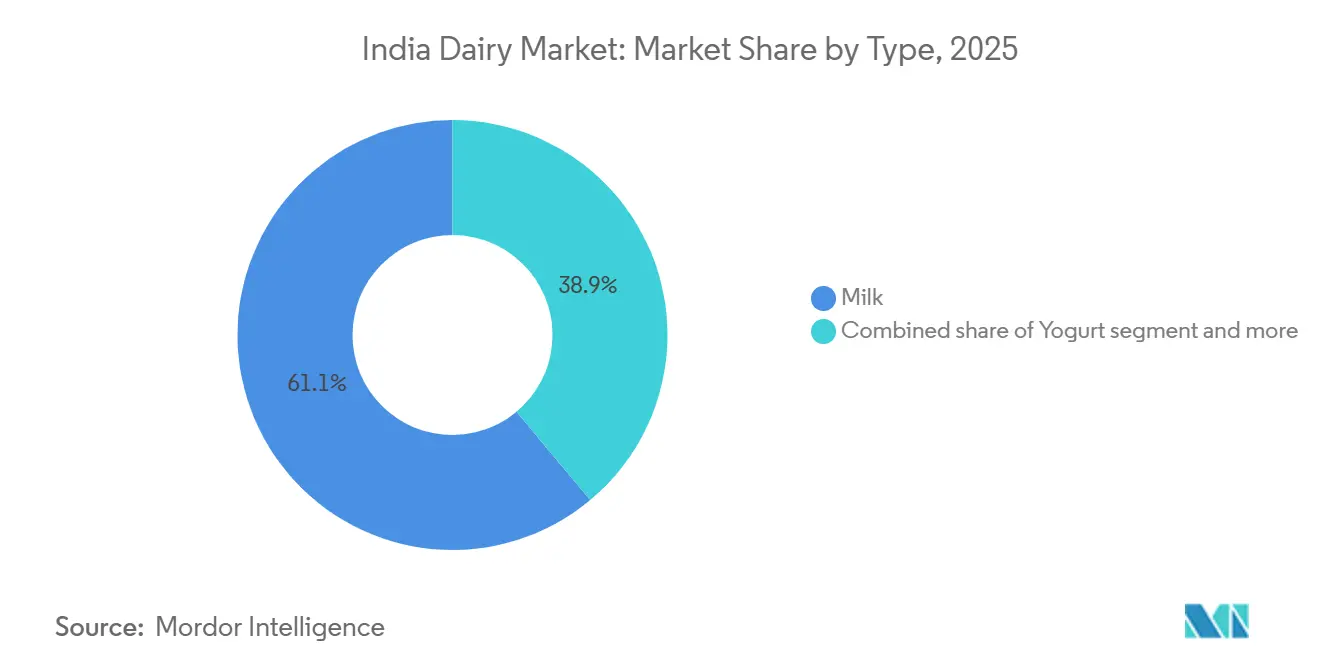
- By product type, milk captured 62.07% of India dairy market share in 2025, while yogurt is forecast to grow at an 8.01% CAGR through 2031.
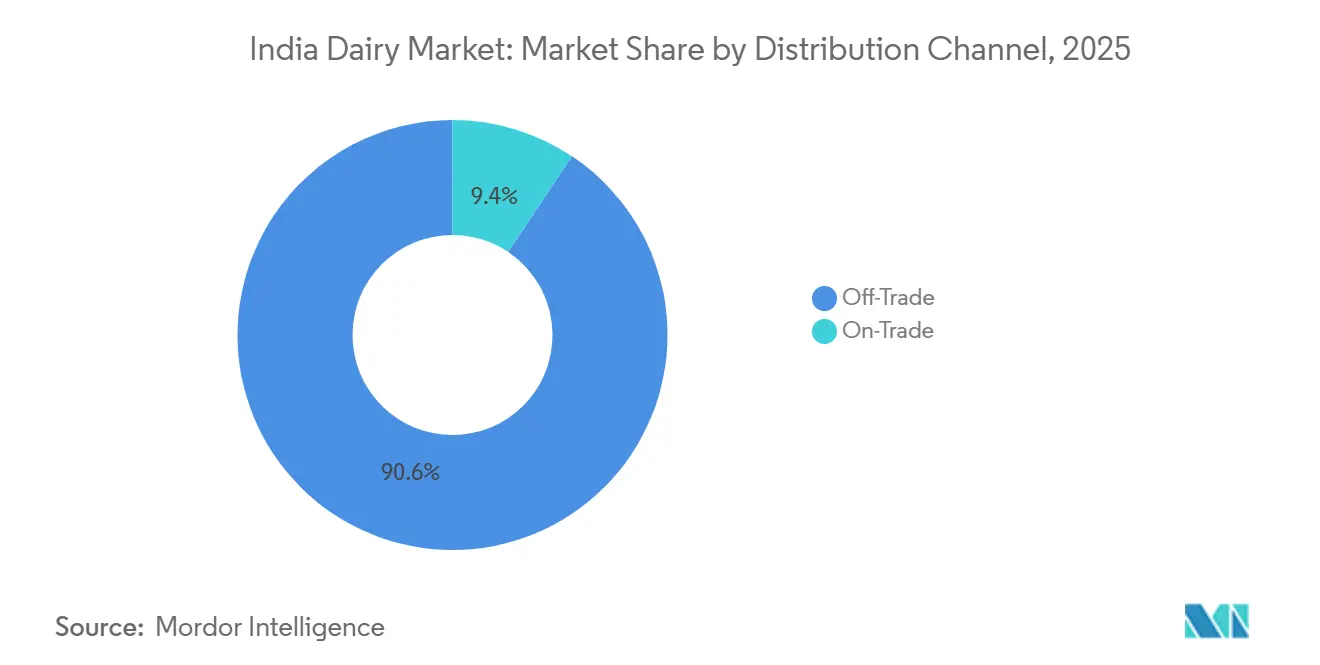
- By distribution channel, off-trade outlets dominated with a 90.62% share of the India dairy market size in 2025, but on-trade channels are poised to expand at a 7.42% CAGR over 2026-2031.
- Regionally, western states led volume and revenue in 2025; southern states will post the fastest value CAGR at 8.7% through 2031.
Note: Market size and forecast figures in this report are generated using Mordor Intelligence’s proprietary estimation framework, updated with the latest available data and insights as of 2026.
India Dairy Market Trends and Insights
Drivers Impact Analysis*
| Driver | (~) % Impact on CAGR Forecast | Geographic Relevance | Impact Timeline |
|---|---|---|---|
| Rising health consciousness and protein-centric diets | +1.2% | National, early gains in major metros | Medium term (2-4 years) |
| Product innovation in flavors, packaging, and formats | +1.0% | National with tier-2 spill-over | Short term (≤ 2 years) |
| Growth of ready-to-eat convenience dairy | +0.9% | Urban clusters and tier-2 catch-up | Medium term (2-4 years) |
| Rapid expansion of organized micro-fulfillment cold-chain | +1.1% | Metros and tier-1 hubs | Short term (≤ 2 years) |
| Digitization of farm-level milk quality via IoT sensors | +0.7% | Nationwide cooperative networks | Long term (≥ 4 years) |
| Surge in institutional demand from cloud kitchens | +0.8% | Metros with dense QSR footprints | Medium term (2-4 years) |
| Source: Mordor Intelligence | |||
Rising health consciousness and protein-centric diets
Urban consumers are shifting their grocery spending towards fortified milk, Greek yogurt, and paneer, signaling a growing emphasis on protein intake as a marker of wellness. The 2025 dietary guidelines raised the recommended protein intake to 0.9 g/kg of body weight, spurring demand for dairy products that offer 12–15 g of protein per serving. In fiscal 2025, Amul’s protein-enriched milk saw a 34% surge in volume, driven by increased consumer awareness and targeted marketing campaigns. Meanwhile, within just nine months, Mother Dairy’s high-protein lassi captured 18% of the drinkable-yogurt market in Delhi NCR, supported by its strategic distribution network and product positioning. Mid-tier cooperatives are now adopting ultrafiltration lines, enabling them to concentrate protein without compromising taste, thus shortening their payback periods and improving operational efficiency. Additionally, government-led nutrition initiatives targeting anemia reduction have bolstered sales of iron-fortified milk by 29% in 2025, reflecting the success of public health campaigns and growing consumer trust in fortified dairy products[2]Source: Ministry of Health and Family Welfare, "Anaemia Mukt Bharat Strategy Overview," mohfw.gov.in.
Product innovation in flavors, packaging, and formats
Brands are rolling out 8–12 new flavors annually, capturing impulse buys and countering the growing competition from plant-based substitutes. In October 2025, Britannia introduced a turmeric-ginger cheese spread and a beetroot yogurt, which achieved a 12% distribution in South India within five months, showcasing the brand's ability to innovate and meet regional taste preferences. Hatsun Agro's aseptic 200 ml QR-coded cartons, designed to ensure product safety and traceability, secured a 41% penetration in Tamil Nadu's school meal program, where tamper-proof packaging is mandatory to maintain food safety standards. Single-serve formats, such as 100 g yogurt cups and 20 g cheese cubes, are expanding 26% faster than bulk packs, driven by the increasing prevalence of nuclear-family demographics and the demand for convenience. Parag Milk Foods' resealable Go Cheese slices captured a 9% share of Maharashtra's processed cheese market within four months, highlighting the growing consumer preference for easy-to-use and versatile packaging.
Growth of ready-to-eat convenience dairy
Flavored milk, drinkable yogurt, and ready-to-use cheese spreads are becoming staples in dual-income households, streamlining meal preparation and catering to the fast-paced lifestyles of working individuals. In March 2025, Nestlé India launched a squeeze-tube condensed milk, which not only simplified usage but also resulted in a 37% sales boost among working women aged 25–40, highlighting its appeal to this demographic. Cloud kitchens, capitalizing on the growing demand for convenience, now source 22% of their dairy in institutional packs. This surge in demand has prompted processors like Schreiber Dynamix to introduce five-kilogram mozzarella blocks with a 90-day shelf life, catering to the operational needs of these kitchens. In 2025, the FSSAI approved retort-processed paneer, enabling a 12-month shelf-stable distribution that is particularly advantageous for rural markets with limited cold chain infrastructure[3]Source: Food Safety and Standards Authority of India, " Product Approvals," fssai.gov.in. Heritage Foods rolled out ready-to-cook paneer kits, achieving a notable 19% household penetration in Andhra Pradesh and Telangana within just six months, showcasing the growing consumer preference for convenient and ready-to-use dairy products.
Rapid expansion of organized micro-fulfillment cold-chain
Quick-commerce operators have opened dark stores equipped with dedicated cold rooms for dairy products, successfully reducing spoilage rates from 8% to under 2%. Blinkit now operates 480 hubs, offering 120–150 dairy SKUs, a significant increase from the 40–60 typically found in kirana stores. This expansion has led to a surge in trials for premium yogurt and imported cheese. In August 2025, Swiggy Instamart inked a deal with the Karnataka Milk Federation, capturing 12% of Bengaluru’s home-delivery milk market within just three months. Third-party logistics firms, Snowman and Gati-KWE, are expanding their refrigerated warehousing by an impressive 1.2 million ft³ annually, resulting in a 14–18% reduction in last-mile delivery costs. This enhanced infrastructure now provides broader access to Greek yogurt and fresh cream, especially in urban areas where consumers once relied on daily store visits. The quick-commerce sector's focus on cold chain optimization is reshaping consumer habits and driving demand for premium dairy products.
Restraints Impact Analysis*
| Restraint | (~)% Impact on CAGR Forecast | Geographic Relevance | Impact Timeline |
|---|---|---|---|
| High perishability limiting shelf life | -0.9% | National, acute in rural and tier-3 cities | Short term (≤ 2 years) |
| Adulteration and safety concerns | -0.7% | Nationwide loose-milk clusters | Medium term (2-4 years) |
| Escalating fodder-price volatility from climate shocks | -1.0% | Drought-prone states | Long term (≥ 4 years) |
| Fragmented smallholder base limiting traceability | -0.8% | Heartland states with micro-herds | Long term (≥ 4 years) |
| Source: Mordor Intelligence | |||
High perishability limiting shelf life
Logistics costs soar due to an ambient shelf life of just 24–72 hours, especially when cold-chain access lingers below 12%. According to ICAR, 6–8% of milk spoils before reaching consumers, translating to a staggering wastage valued between USD 1.8 and 2.4 billion. In Uttar Pradesh and Bihar, summer temperatures exceeding 40 °C lead to rejection rates of 4–6% at collection centers. While UHT and aseptic treatments can prolong shelf life, they come at an added cost of INR 8–12 per liter, a price point that alienates 68% of value-conscious buyers. Meanwhile, FSSAI's pilot on hydrogen-peroxide cold-pasteurization, pending toxicology clearance by mid-2027, promises a 10-day shelf life without refrigeration. This innovation could significantly reduce wastage and improve supply chain efficiency. Additionally, it may open new opportunities for market penetration in regions with limited cold-chain infrastructure.
Adulteration and safety concerns
In 2025, synthetic milk accounted for 12–15% of loose sales, leading 9% of urban households to switch to packaged brands, even with an 18–22% price premium. A June 2025 incident in Uttar Pradesh, where authorities seized 8,000 liters of detergent-laced milk, resulted in a 14% drop in district loose-milk demand that lasted three months. The FSSAI's January 2026 mandate on blockchain technology requires QR-coded traceability for packs over 1 liter. This regulation is expected to shrink margins for smaller players by INR 0.50–0.80 per unit. As long as enforcement remains lax, perceptions of safety will continue to limit volume growth. The shift toward packaged milk is also driven by increasing consumer awareness of food safety. Additionally, advancements in blockchain technology are expected to enhance transparency in the supply chain.
*Our forecasts treat driver/restraint impacts as directional, not additive. The impact forecasts reflect baseline growth, mix effects, and variable interactions.
Segment Analysis
By Product Type: Yogurt Premiumization Outpaces Commodity Milk
In 2025, fluid milk commanded the Indian dairy market, securing 62.07% of total revenue, thanks to its staple status in households. Brands like Mother Dairy, seizing the opportunity, boosted UHT variant sales by 27% in Bihar and Uttar Pradesh. They tackled cold-chain challenges, offering consumers the convenience of shelf-stable products. While commodities like condensed and powdered milk cater to institutional and export needs, they're ceding domestic value to fresher alternatives. Yet, despite this shift, milk's dominant scale continues to anchor the market's overall stability.
Yogurt is on the rise, boasting an 8.01% CAGR through 2031, fueled by health-conscious consumers gravitating towards its probiotic benefits and the convenience of drinkable formats. Flavored milk is making waves with a 14% annual surge, bolstered by school initiatives and the sports nutrition boom. Natural cheese, riding the wave of pizza and café culture, sees a 12% yearly climb. This is underscored by Britannia's swift rollout of mozzarella sticks, achieving an impressive 8% distribution in modern retail within just three months. Cream, benefiting from the home-baking trend, sees whipping cream capturing 34% of the Delhi NCR market. Meanwhile, sour-milk beverages like lassi and chaas are up 7%, especially the spiced and digestive variants. Premium niches are emerging, with specialty desserts and artisanal ice creams priced at INR 400–600 per pint, paving the way for regional innovators. This momentum towards value-added products underscores a significant market shift, with these higher-margin SKUs outpacing traditional plain milk.


By Distribution Channel: Quick Commerce Reshapes Off-Trade Dynamics
In 2025, off-trade channels, including supermarkets, convenience stores, and specialist outlets, dominated India's dairy market, generating a substantial 90.62% of total revenue. While supermarkets accounted for the majority of sales volume, convenience stores, particularly those located in transport hubs and offices, experienced a notable 11% growth last year. Notably, 7-Eleven reported that dairy products constituted 18% of its sales. Specialist organic chains, by offering premium variants like A2, lactose-free, and grass-fed products at 25–40% markups, captured 6% of urban revenue. Although traditional kiranas remain in the fray, they're increasingly challenged by quick-commerce platforms, which stock 120–150 SKUs compared to the 60 typically found in kiranas. This significant scale highlights the foundational role of off-trade channels in the market.
Conversely, on-trade channels are set to experience the most rapid growth, projected at a 7.42% CAGR through 2031. This surge is driven by the rise of cafés, hotels, and delivery kitchens. Café chains have ramped up their milk purchases by 28% year-on-year. Meanwhile, cloud kitchens are consuming an average of 180 kg of cheese and 120 liters of cream monthly, leading to a spike in demand for bulk packaging. Online retail, a subset of the off-trade, is witnessing an even more impressive surge at 22% annually. This growth is making premium yogurts and imported cheeses more accessible to the digital-savvy populace, thanks to a wider assortment and swift fulfillment. The FSSAI's 2025 certification rules are raising industry standards, favoring accredited processors. Additionally, subscription-based DTC startups are successfully sidestepping traditional distributors. Collectively, these trends indicate a significant shift towards both experiential and digital growth in the on-trade sector.
Competitive Landscape
In the moderately fragmented Indian dairy market, the top five players, Amul, Nestlé India, Britannia, Hatsun Agro, and Mother Dairy, account for 35% of organized revenue. While cooperatives, through 190,000 village societies, dominate liquid-milk procurement, private processors are reaping greater rewards in cheese, yogurt, and flavored milk, boasting gross margins exceeding 25%, compared to just 8–12% for fluid milk. To stabilize the raw-milk supply, cooperatives are strategically backward integrating into fodder and veterinary services. In contrast, private firms are moving forward, integrating into proprietary retail. This trend is exemplified by Hatsun's 1,200 Daily stores and Go Cheese's 840 franchised outlets.
Technology is carving out competitive advantages. For instance, Dodla Dairy's blockchain initiative, spanning 4,200 farmer clusters, clinched a five-year INR 180-crore supply agreement with Swiggy Instamart, emphasizing end-to-end transparency. In response, multinationals are localizing their research and development efforts: Nestlé has introduced turmeric-infused A2 milk, Danone is pushing probiotic lassi, and Lactalis has rolled out paneer-tikka cheese spreads, collectively generating INR 420 crore in FY 2025. Meanwhile, mid-tier players are investing in aseptic lines and QR-coded packaging, gearing up for FSSAI’s traceability mandate set for January 2026.
Despite witnessing double-digit growth, categories like lactose-free, organic, and fortified products remain under-penetrated at below 4%. Startups such as Country Delight, Sid’s Farm, and Akshayakalpa are tapping into subscription models, achieving gross margins of 28–32%. However, their volumes are modest, peaking at 120,000 L/day. With incumbents on the lookout for digital capabilities and premium brands, a surge in merger and acquisition activity is anticipated to bolster their presence in the Indian dairy landscape.
India Dairy Industry Leaders
-
Gujarat Cooperative Milk Marketing Federation (GCMMF)
-
Hatsun Agro Product Ltd.
-
Karnataka Milk Federation (KMF)
-
Tamil Nadu Milk Federation (Aavin)
-
Milky Mist Dairy Food Ltd.
- *Disclaimer: Major Players sorted in no particular order

Geography Analysis
In the Indian dairy market, regional disparities dictate procurement models, consumption habits, and product preferences. Northern states like Uttar Pradesh, Haryana, and Punjab, which produce 38% of the country's milk, tend to consume less value-added dairy. Instead, they show a preference for loose or boiled milk, typically sold by neighborhood vendors. In the West, states such as Gujarat, Maharashtra, and Rajasthan leverage dense cooperative networks. Notably, Amul processes a staggering 28 million liters per day through its 18,600 village societies, achieving the highest organized penetration rate in the country. Meanwhile, the southern states of Tamil Nadu, Karnataka, Andhra Pradesh, and Telangana are witnessing a swift premiumization trend. Their yogurt consumption stands at 4.2 kg per capita, outpacing the national average of 2.8 kg. This trend is a nod to their curd-rice traditions and a growing awareness of probiotics.
Eastern markets, including West Bengal, Bihar, and Odisha, remain relatively underserved, holding only an 18% share in the organized sector. However, this gap has been narrowed by 11 percentage points in 2025, thanks to quick-commerce entrants launching in Kolkata and Patna. The National Dairy Development Board (NDDB) made a strategic investment in 240 bulk milk coolers spread across the "milk belt." This move reduced pre-processing spoilage from 6% to a mere 2%, significantly boosting raw milk quality for processors. Flavor innovations tailored to local tastes are driving incremental revenue. For instance, Hatsun Agro's rose milk, Parag's saffron lassi, and Dodla's mango yogurt collectively raked in an impressive INR 340 crore in 2025. On the export front, a momentum is building: 68,000 tons of skim powder, ghee, and UHT milk found their way to Bangladesh, the UAE, and Sri Lanka in 2025. This marks a 24% year-over-year increase, largely attributed to Codex-aligned standards that ease regulatory challenges.
Looking ahead, Western hubs are set to maintain their dominance in processing capacity. Northern states are poised to invest in traceability, aiming to convert loose-milk buyers. Southern metros are leading the charge in introducing premium SKUs. For eastern markets, growth is contingent on the expansion of cold chains and the embrace of digital retail. With these regional dynamics and focused product innovations, the Indian dairy market is poised to shift from a volume-driven approach to one centered on value-led expansion.
Recent Industry Developments
- June 2025: In a strategic partnership with FranGlobal, the international business arm of Franchise India, Yogurt Factory, France's leading frozen yogurt brand, has made its official debut in the Indian market. With its gourmet frozen yogurt boasting 0% fat and a delectable assortment of smoothies, milkshakes, waffles, and bubble teas, Yogurt Factory aims to transform the dessert scene in India.
- April 2025: Locally made at Britannia Bel Foods' new state-of-the-art facility in Ranjangaon, Maharashtra, the improved cheese range blends French cheese-making expertise with recipes customized for Indian palates. The brand's relaunch, conceptualized by Schbang, features updated packaging, five essential nutrients, and a novel engagement through a Gen-AI recipe bot on WhatsApp.
- March 2025: At Ahaar 2025, held at Pragati Maidan, Galacia Cheese made its debut, marking the entry of Paras Dairy—a prominent name in India's dairy sector and a brand under VRS Foods Limited—into the cheese market. This premium cheese range, made from the finest cow milk, highlights Paras Dairy's dedication to providing top-tier dairy products to consumers nationwide.


India Dairy Market Report Scope
Dairy products refer to processed and packaged dairy products retailed across the on-trade and off-trade channels across India. The dairy products market is segmented by Product Type, Distribution Channel, and Geography. Based on Product Type, the market is segmented into butter, cheese, cream, dairy desserts, milk, yogurt, sour milk drinks, and others. Based on the distribution channel, the market studied is segmented into on-trade and off-trade. For each segment, the market sizing and forecasts have been done based on the value in USD million.
| Butter | ||
| Cheese | Natural Cheese | Cheddar |
| Cottage | ||
| Ricotta | ||
| Parmesan | ||
| Others | ||
| Processed Cheese | ||
| Cream | Fresh Cream | |
| Cooking Cream | ||
| Whippng Cream | ||
| Others | ||
| Dairy Desserts | Ice Cream | |
| Cheesecakes | ||
| Frozen Desserts | ||
| Others | ||
| Milk | Condensed milk | |
| Flavored Milk | ||
| Fresh Milk | ||
| UHT Milk (Ultra-high temperature milk) | ||
| Powdered Milk | ||
| Yogurt | Drinkable | |
| Spoonable | ||
| Sour Milk Drinks | ||
| On-trade | |
| Off-trade | Convenience Stores |
| Specialist Retailers | |
| Supermarkets and Hypermarkets | |
| Online Retail | |
| Others |
| Product Type | Butter | ||
| Cheese | Natural Cheese | Cheddar | |
| Cottage | |||
| Ricotta | |||
| Parmesan | |||
| Others | |||
| Processed Cheese | |||
| Cream | Fresh Cream | ||
| Cooking Cream | |||
| Whippng Cream | |||
| Others | |||
| Dairy Desserts | Ice Cream | ||
| Cheesecakes | |||
| Frozen Desserts | |||
| Others | |||
| Milk | Condensed milk | ||
| Flavored Milk | |||
| Fresh Milk | |||
| UHT Milk (Ultra-high temperature milk) | |||
| Powdered Milk | |||
| Yogurt | Drinkable | ||
| Spoonable | |||
| Sour Milk Drinks | |||
| Distribution Channel | On-trade | ||
| Off-trade | Convenience Stores | ||
| Specialist Retailers | |||
| Supermarkets and Hypermarkets | |||
| Online Retail | |||
| Others | |||


Market Definition
- Butter - Butter is a yellow-to-white solid emulsion of fat globules, water, and inorganic salts produced by churning the cream from cows’ milk
- Dairy - Dairy product include milk and any of the foods made from milk, including butter, cheese, ice cream, yogurt, and condensed and dried milk.
- Frozen Desserts - Frozen dairy dessert means and includes products containing milk or cream and other ingredients which are frozen or semi-frozen prior to consumption, such as ice milk or sherbet, including frozen dairy desserts for special dietary purposes, and sorbet
- Sour Milk Drinks - Sour milk is thick, curdled milk, with a sour taste, obtained from the fermentation of milk. Sour milk drinks such as kefir, laban, buttermilk have been considered in the study
| Keyword | Definition |
|---|---|
| Cultured Butter | Cultured butter is prepared by having the raw butter go through chemical processing and has been added with certain emulsifiers and foreign ingredients. |
| Uncultured Butter | This type of butter is one which has not been processed in any way |
| Natural Cheese | The type of cheese in its most natural form. It is made from natural and simple products and ingredients, including fresh and natural salts, natural colors, enzymes, and high-quality milk. |
| Processed Cheese | Processed cheese undergoes the same processes as natural cheese; however, it requires more steps and many different forms of ingredients. Making processed cheese involves melting natural cheese, emulsifying it, and adding preservatives and other artificial ingredients or colorings. |
| Single Cream | Single cream contains around 18% fat. It’s a single layer of cream that appears over boiled milk. |
| Double Cream | Double cream contains 48% fat, more than double the amount of fat of single cream. It’s heavier and thicker than single cream |
| Whipping Cream | This has a much higher fat percentage than single cream (36%). Used to top cakes, pies, and puddings and as a thickener for sauces, soups, and fillings. |
| Frozen Desserts | Desserts that are meant to be eaten in frozen condition. E.g., sherbets, sorbets, frozen yogurts |
| UHT Milk (Ultra-high temperature milk) | Milk heated at a very high temperature. Ultra-high-temperature processing (UHT) of milk involves heating for 1–8 sec at 135–154°C. which kills the spore-forming pathogenic microorganism, resulting in a product with a shelf-life of several months. |
| Non-dairy butter/Plant-based butter | Butter made from plant-derived oil such as coconut, palm, etc. |
| Non-dairy Yogurt | Yogurt made from typically made from nuts, like almonds, cashews, coconuts, and even other foods like soybeans, plantains, oats, and peas |
| On-trade | It refers to restaurants, QSRs, and bars. |
| Off-trade | It refers to supermarkets, hypermarkets, on-line channels, etc. |
| Neufchatel cheese | One of the oldest kinds of cheese in France. It is a soft, slightly crumbly, mold-ripened, bloomy-rind cheese made in the Neufchâtel-en-Bray region of Normandy. |
| Flexitarian | It refers to a consumer preferring a semi-vegetarian diet, that is centered on plant foods with limited or occasional inclusion of meat. |
| Lactose Intolerance | Lactose intolerance is a reaction in digestive system to lactose, the sugar in milk. It causes uncomfortable symptoms in response to the consumption of dairy products. |
| Cream Cheese | Cream cheese is a soft and creamy fresh cheese with a tangy taste made from milk and cream. |
| Sorbets | Sorbet is a frozen dessert made using ice combined with fruit juice, fruit purée, or other ingredients, such as wine, liqueur, or honey. |
| Sherbet | Sherbet is a sweetened frozen dessert made with fruit and some sort of dairy product such as milk or cream. |
| Shelf stable | Foods that can be safely stored at room temperature, or "on the shelf," for at least one year and do not have to be cooked or refrigerated to eat safely. |
| DSD | Direct Store Delivery is the process in supply chain management wherein the product is delivered from manufacturing plant directly to the retailer. |
| OU Kosher | Orthodox Union Kosher is a kosher certification agency based in New York City. |
| Gelato | Gelato is a frozen creamy dessert made with milk, heavy cream and sugar. |
| Grass-fed Cows | Grass-fed cows are allowed to graze in pastures, where they eat a variety of grasses and clover. |


Research Methodology
Mordor Intelligence follows a four-step methodology in all our reports.
- Step-1: Identify Key Variables: In order to build a robust forecasting methodology, the variables and factors identified in Step 1 are tested against available historical market numbers. Through an iterative process, the variables required for market forecast are set, and the model is built on the basis of these variables.
- Step-2: Build a Market Model: Market-size estimations for the forecast years are in nominal terms. Inflation is not a part of the pricing, and the average selling price (ASP) is kept constant throughout the forecast period for each country.
- Step-3: Validate and Finalize: In this important step, all market numbers, variables, and analyst calls are validated through an extensive network of primary research experts from the market studied. The respondents are selected across levels and functions to generate a holistic picture of the market studied.
- Step-4: Research Outputs: Syndicated Reports, Custom Consulting Assignments, Databases & Subscription Platforms


