
Market Overview
| Study Period | 2020 - 2031 |
|---|---|
| Market Size (2026) | USD 50.17 Billion |
| Market Size (2031) | USD 73.91 Billion |
| Growth Rate (2026 - 2031) | 8.06 % |
| Fastest Growing Market | Asia Pacific |
| Largest Market | North America |
| Market Concentration | Medium |
Major Players *Disclaimer: Major Players sorted in no particular order Image © Mordor Intelligence. Reuse requires attribution under CC BY 4.0. | |
Product Lifecycle Management (PLM) Software Market Analysis by Mordor Intelligence
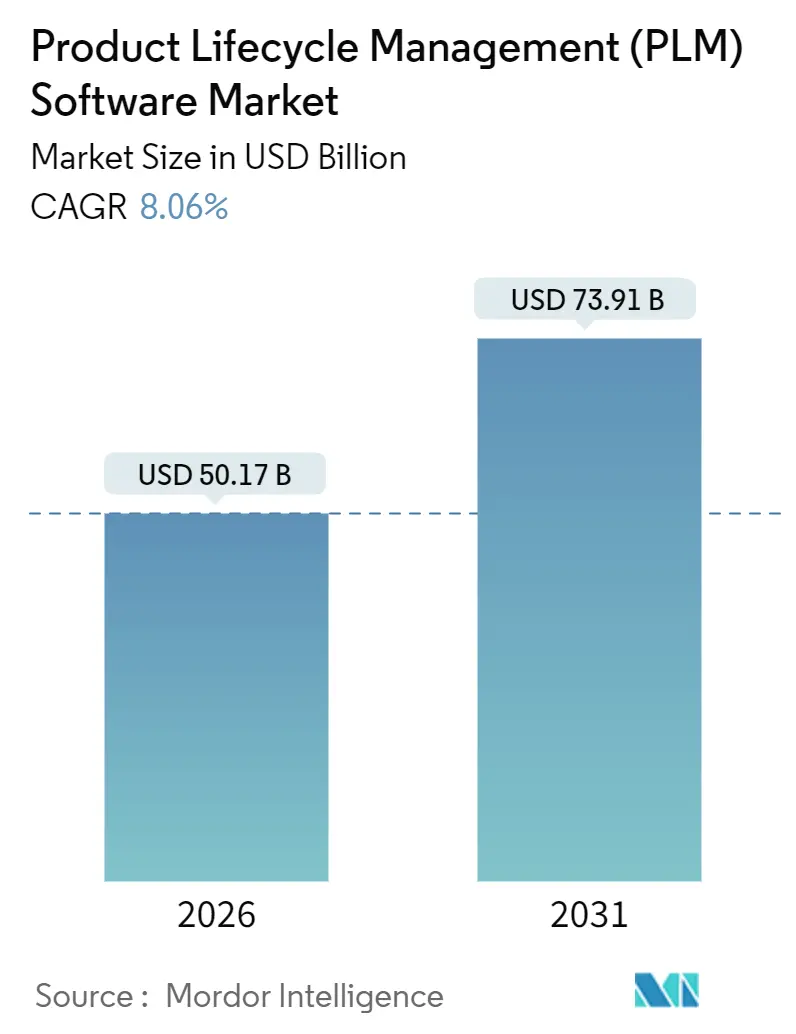
The Product Lifecycle Management (PLM) Software Market size reached USD 50.17 billion in 2026 and is projected to advance to USD 73.91 billion by 2031, reflecting an 8.06% CAGR during 2026-2031. This trajectory is underpinned by fast-rising cloud adoption, the infusion of generative-AI copilots into engineering toolchains, and mounting regulatory demands for end-to-end digital traceability in automotive, aerospace, electronics, and life-sciences manufacturing. Tier-1 manufacturers are shifting toward SaaS platforms as elastic compute reduces simulation bottlenecks and real-time collaboration slashes review cycles. Incumbent vendors have moved aggressively to embed simulation, quality, and sustainability capabilities through acquisitions and platform extensions, while open-source alternatives apply price pressure, especially in cost-sensitive regions. Cyber-security concerns remain, yet continuous certification against FedRAMP, ISO 27001, and SOC 2 Type II is easing hesitancy among regulated industries. Mid-market firms, long held back by upfront capital outlays, now tap micro-subscription bundles that democratize access to best-of-breed PLM workflows.
Key Report Takeaways
- By deployment type, cloud commanded 43.34% revenue in 2025 and is set to grow at a 10.96% CAGR through 2031.
- By solution type, collaborative product data management held 48.26% revenue share in 2025, while digital manufacturing and MES-PLM integration is tracking a 9.32% CAGR to 2031.
- By organisation size, large enterprises represented 72.54% of implementations in 2025; small and medium enterprises are expanding at an 11.84% CAGR over 2026-2031.
- By end-user industry, automotive and transportation led with 26.86% revenue share in 2025, whereas electronics and high-tech is advancing at a 9.56% CAGR.
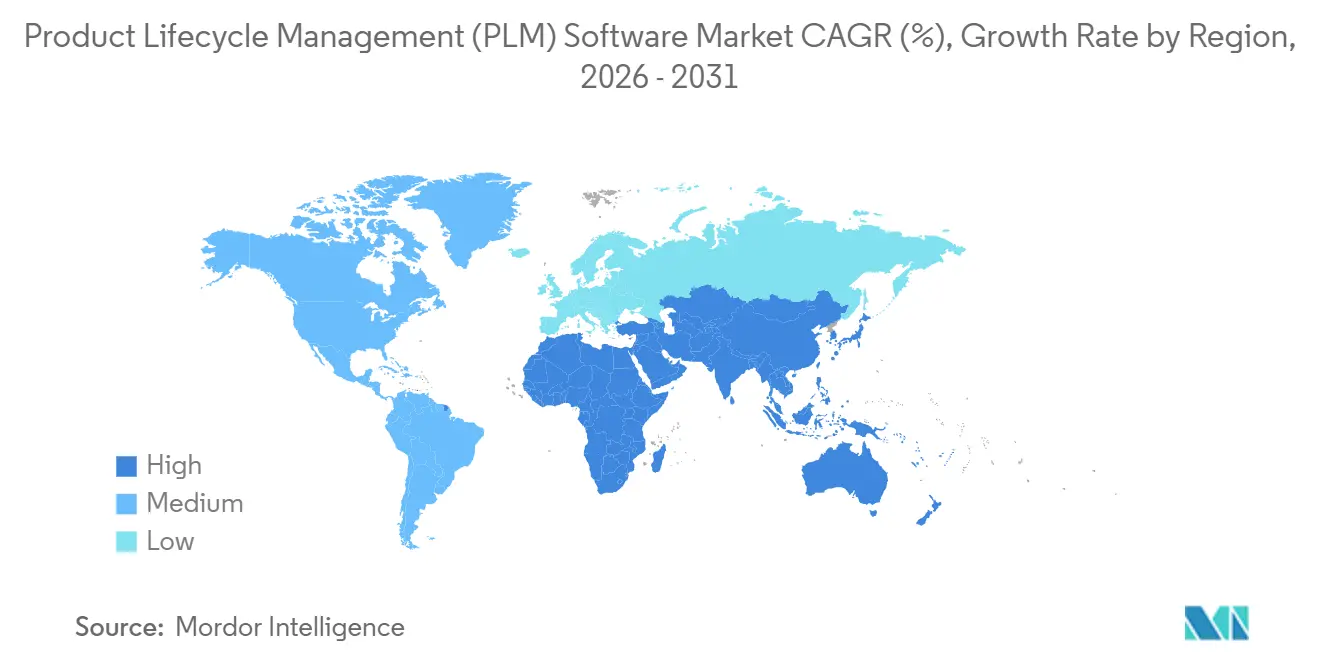
- By geography, North America captured 35.28% of revenue in 2025, yet Asia Pacific is pacing a 10.44% CAGR through 2031.
Note: Market size and forecast figures in this report are generated using Mordor Intelligence’s proprietary estimation framework, updated with the latest available data and insights as of January 2026.
Market Trends and Insights
Drivers Impact Analysis of Product Lifecycle Management (PLM) Software Market*
| Driver | (~) % Impact on CAGR Forecast | Geographic Relevance | Impact Timeline |
|---|---|---|---|
| Cloud-first adoption among Tier-1 manufacturers | +1.8% | Global, with concentration in North America and Europe | Medium term (2-4 years) |
| Growing need for end-to-end digital thread | +1.5% | Global, strongest in aerospace and defense sectors | Long term (≥ 4 years) |
| Regulatory push for product traceability and sustainability reporting | +1.2% | Europe (CSRD), North America (FDA), Asia Pacific (emerging) | Medium term (2-4 years) |
| Generative-AI copilots trimming engineering change-order cycles | +1.4% | North America and Europe early adopters, Asia Pacific following | Short term (≤ 2 years) |
| Micro-subscription PLM bundles for SMB value chains | +0.9% | Global, with high uptake in Asia Pacific and South America | Short term (≤ 2 years) |
| Low-code PLM platforms democratizing custom workflows | +0.7% | Global, particularly SMEs in Asia Pacific and emerging markets | Medium term (2-4 years) |
| Source: Mordor Intelligence | |||
Cloud-First Adoption Among Tier-1 Manufacturers
Cloud-native PLM architectures reduce reliance on proprietary data centers and shorten global review loops. Siemens reported that cloud annual recurring revenue reached 49% of its EUR 5.3 billion (USD 5.67 billion) software ARR in fiscal Q4 2025, illustrating the velocity of SaaS migrations. PTC forecasts 7-9% ARR growth for 2026 as Windchill+ SaaS deployments accelerate. Elevated cloud uptake stems from on-demand compute that scales generative-design workloads without hardware over-provisioning, while real-time access for suppliers slashes engineering change-order latency.
Growing Need for End-to-End Digital Thread
A continuous digital thread links requirements, CAD, simulation, manufacturing instructions, and field data, enabling closed-loop feedback. NIST published a 2024 framework urging adoption of STEP AP242 and related schemas to knit PLM, ERP, and MES data together.[1]Norbert Aschenbrenner, “Siemens Reports Strong Q4 2025 Results,” press.siemens.com Deloitte and Siemens formed the Digital Thread and Twin Alliance to operationalize such frameworks for aerospace and automotive clients. Early adopters report lower scrap, faster design iterations, and audit readiness as regulators request granular as-built traceability.
Regulatory Push for Product Traceability and Sustainability Reporting
The European Union’s Corporate Sustainability Reporting Directive (CSRD) compels Scope 3 emission tracking beginning fiscal 2025, driving manufacturers to embed lifecycle-assessment engines directly in PLM systems.[2] European Commission, “Corporate Sustainability Reporting Directive,” finance.ec.europa.eu The U.S. FDA’s 2024 draft guidance clarifies that cloud PLM systems serving medical-device design history files must comply with 21 CFR Part 11, elevating vendor security scrutiny. Compliance mandates are nudging paper-heavy sectors toward digital workflows to cut audit prep from weeks to hours.
Generative-AI Copilots Trimming Engineering Change-Order Cycles
Microsoft’s Product Change Management agent in Dynamics 365, released November 2024, analyzes bill-of-material dependencies and recommends substitutions when suppliers issue obsolescence notices. IBM, Oracle, and SAP similarly infused AI assistants into PLM suites, slashing documentation, validation, and instruction-authoring workloads. Electronics manufacturers, where product lifecycles now span just 12-18 months, find that AI-augmented change management preserves margins by minimizing redesign delays.
Restraints Impact Analysis of Product Lifecycle Management (PLM) Software Market*
| Restraint | (~) % Impact on CAGR Forecast | Geographic Relevance | Impact Timeline |
|---|---|---|---|
| Persistent interoperability gaps between legacy CAD and modern PLM | -1.1% | Global, particularly in North America and Europe with legacy infrastructure | Long term (≥ 4 years) |
| Cyber-security and IP leakage concerns in multi-tenant SaaS | -0.8% | Global, heightened in aerospace, defense, and high-tech sectors | Medium term (2-4 years) |
| Growing open-source digital-twin stacks cannibalizing paid licenses | -0.5% | Asia Pacific and emerging markets with cost-sensitive SMEs | Medium term (2-4 years) |
| Trade-policy-driven chip export controls disrupting PLM upgrade cycles | -0.6% | China and Asia Pacific, with spillover to global supply chains | Short term (≤ 2 years) |
| Source: Mordor Intelligence | |||
Persistent Interoperability Gaps Between Legacy CAD and Modern PLM
Hybrid CAD estates spanning CATIA, NX, SolidWorks, and Creo introduce data-translation errors when ported into cloud repositories. ITI documented that 30-40% of migrations still need manual remediation, inflating project timelines. Siemens’ acquisition of Altair in January 2025 targets tighter integration of HyperWorks simulation with Teamcenter, yet neutral formats such as STEP remain unevenly adopted.
Cyber-Security and IP Leakage Concerns in Multi-Tenant SaaS
Attackers view shared SaaS infrastructure as a high-value target. Oracle’s October 2024 critical patch for Agile PLM fixed CVE-2024-21287 and CVE-2024-20953, which allowed remote code execution.[3]Oracle, “Critical Patch Update Advisory,” oracle.com Aerospace suppliers governed by the U.S. DoD Cybersecurity Maturity Model Certification are demanding data-at-rest encryption and dedicated-tenant options to mitigate espionage risks. Until vendors satisfy these controls, risk-averse programs keep sensitive datasets on-premise despite higher total cost.
*Our forecasts treat driver/restraint impacts as directional, not additive. The impact forecasts reflect baseline growth, mix effects, and variable interactions.
Product Lifecycle Management (PLM) Software Market Segment Analysis
By Deployment Type:
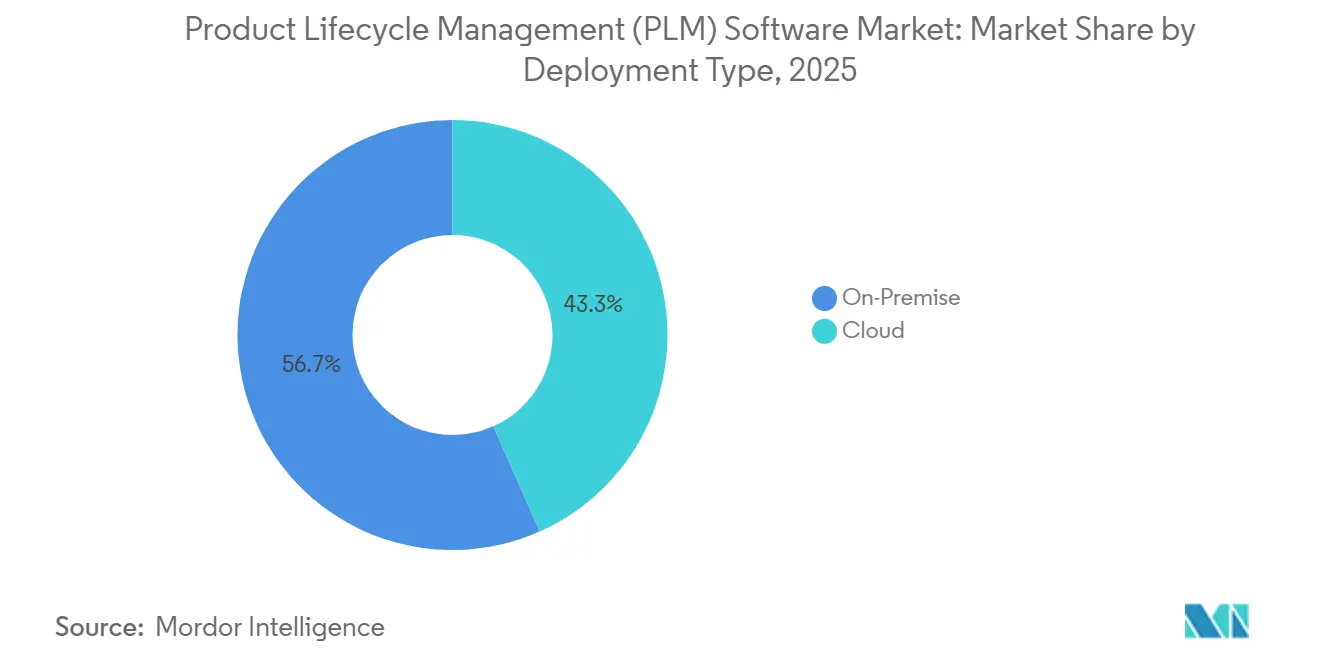
Cloud Gains Momentum Despite On-Premise DominanceOn-premise installations accounted for 56.66% revenue in 2025, a reminder that controlled technical data and legacy contracts still anchor many programs. The cloud segment of the PLM software market is growing at 10.96% CAGR to 2031, propelled by elastic compute that absorbs simulation spikes and supports global design reviews. The PLM software market size for cloud deployments is set to expand from USD 21.75 billion in 2026 to USD 36.61 billion in 2031, underscoring an irreversible shift toward SaaS. Siemens noted that cloud ARR equaled 49% of its software subscriptions by late 2025, confirming mainstream acceptance among Tier-1 manufacturers.
Hybrid topologies have emerged as a pragmatic compromise. Sensitive IP remains behind firewalls while supplier portals, digital twin analytics, and high-performance simulation burst to the cloud. Autodesk credits Fusion 360 for 15-16% manufacturing revenue growth in fiscal 2025 as mid-market fabricators adopted pay-as-you-go licensing. On-premise deployments will persist in defense and pharma, yet as cloud vendors attain FedRAMP and ISO 27001, growth will keep tilting to SaaS, reshaping support and upgrade economics across the Product Lifecycle Management (PLM) Software market.


By Solution Type:
Collaborative PDM Leads While Digital Manufacturing SurgesCollaborative PDM maintained 48.26% revenue share in 2025 thanks to its core role in version control, change governance, and BOM hierarchy management. However, digital manufacturing and MES-PLM integration is the breakout segment, advancing at 9.32% CAGR. The Product Lifecycle Management (PLM) Software market size attributable to digital manufacturing solutions is anticipated to climb from USD 8.13 billion in 2026 to USD 12.75 billion in 2031. Siemens knitted Opcenter MES into Teamcenter to propagate engineering changes to shop-floor schedules, trimming scrap tied to outdated work instruction. Rockwell Automation achieved similar synergy by aligning FactoryTalk with PTC Windchill.
Simulation and analysis add-ons, now often delivered as cloud micro-services, reinforce the pull of integrated suites. Ansys introduced cloud-native solvers that handshake with Windchill and Teamcenter, compressing multi-physics validation from weeks to days. MCAD integration remains necessary for automotive chassis engineering, while application lifecycle management strengthens in electronics where firmware and hardware must co-evolve. Vendors bundling PDM, MES, and simulation under one contract gain stickiness, fortifying platform moats across the PLM software market.
By Organisation Size:
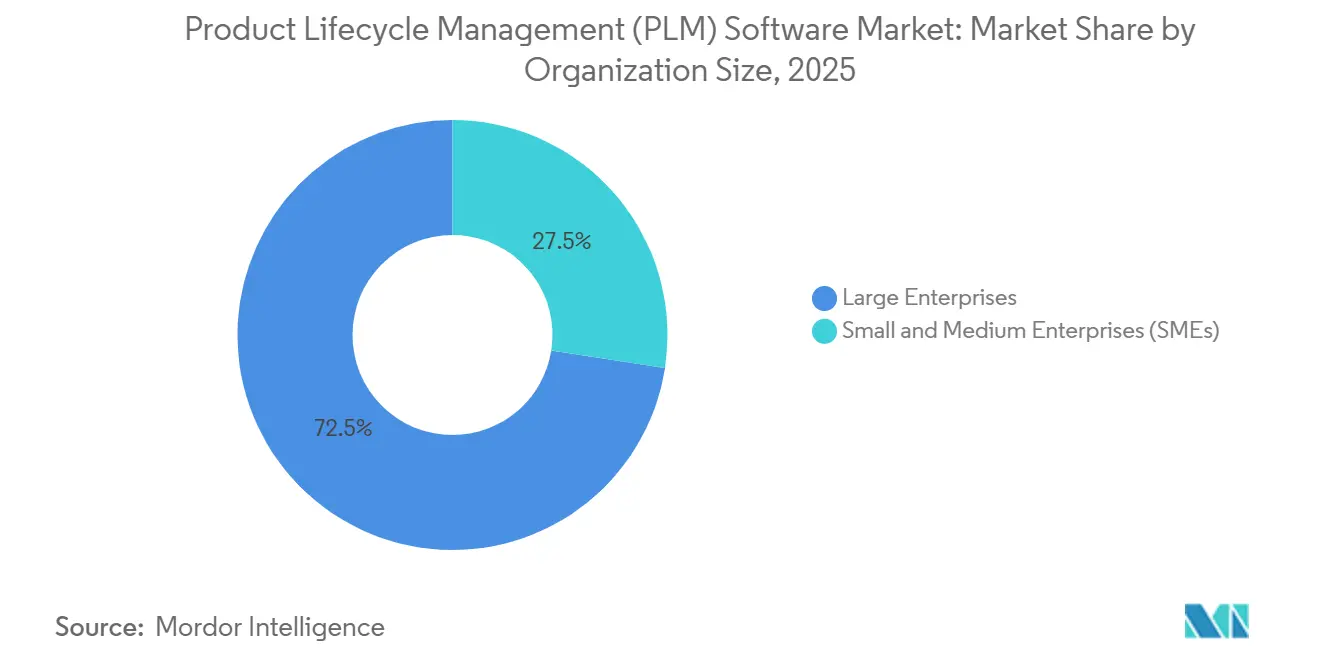
Large Enterprises Dominate Yet SMEs AccelerateLarge enterprises held 72.54% of 2025 deployments, reflecting program complexity and budget headroom. Yet SMEs represent the fastest expansion line, with an 11.84% CAGR through 2031. Consumption-based tiers as low as USD 99 per user per month, such as Arena PLM, remove cost barriers and align with project cash flows. OpenBOM’s USD 25 per user tier is courting contract manufacturers in Asia Pacific and South America. For SMEs, regulatory pressures like the EU Machinery Regulation effective 2027 mandate digital technical files, making PLM adoption unavoidable.
Low-code development upends customization economics. Siemens Mendix lets citizen developers craft approval workflows without specialist coding, a boon for resource-constrained SMEs. While large enterprises will retain the lion’s share of spending, SME velocity injects diversity into the Product Lifecycle Management (PLM) Software, encouraging vendors to refine pricing and onboarding to capture lifetime value.
By End-User Industry:
Automotive Leads While Electronics AcceleratesAutomotive and transportation captured 26.86% revenue in 2025, anchored by electric-vehicle platform expansion and software-defined-vehicle architectures. Electronics and high-tech, meanwhile, is sprinting at a 9.56% CAGR. The PLM software market size for electronics is set to top USD 12.8 billion by 2031, fueled by advanced packaging and AI accelerator demand. Qualcomm stated that AI-driven design automation inside its PLM stack cut 5G radio-access-network chipset timelines by months. Samsung adopted similar flows for the Snapdragon 8 Elite chip inside the Galaxy S25 to tame thermal loads.
Aerospace and defense uphold strict AS9100 and ITAR compliance, making secure PLM indispensable, while life sciences integrate ISO 13485 modules for design control. Industrial machinery firms use PLM-fed digital twins to predict component failure, reducing warranty costs. Architecture, engineering, and construction embraces PLM-adjacent BIM tools for clash detection. The electronics surge, however, narrows lifecycles to 12-18 months, cementing concurrent engineering as a survival imperative and boosting adoption across the PLM software market.
Geography Analysis
North America Product Lifecycle Management (PLM) Software Market
North America maintained 35.28% revenue share in 2025, spearheaded by entrenched PLM infrastructures in automotive, aerospace, and industrial machinery. The PLM software market share of the region reflects robust digital transformation budgets and early compliance with emerging cyber-security norms. U.S. manufacturers leverage tax credits for cloud R&D spending, smoothing SaaS transitions. Canadian aerospace clusters tap public-private consortia to pilot digital twins that integrate PLM with field sensor data.
APAC Product Lifecycle Management (PLM) Software Market
Asia Pacific remains the fastest-growing region, posting a 10.44% CAGR through 2031. China’s 14th Five-Year Plan actively subsidizes domestic PLM deployment to cut reliance on foreign engineering tools. India’s digital manufacturing mission is pushing both domestic OEMs and global tier-one suppliers to unify design and production data via SaaS PLM. ASEAN electronics hubs in Vietnam and Thailand pair PLM rollouts with 5G factory networks, facilitating high-volume PCB design iterations.
Europe Product Lifecycle Management (PLM) Software Market
Europe contributes sizable demand, centered in Germany, France, and the United Kingdom. CSRD-driven environmental reporting is prompting lifecycle-assessment plug-ins across PLM suites, while automotive and aerospace primes upgrade to manage hydrogen propulsion and urban air-mobility programs. Eastern Europe’s contract manufacturers join EU value chains, adopting lightweight PLM to comply with customer audit requirements.
MEA and South America Product Lifecycle Management (PLM) Software Market
South America, the Middle East, and Africa remain nascent yet promising. Brazil’s flex-fuel vehicle producers deploy PLM to juggle ethanol and gasoline variant engineering. Saudi Arabia’s Vision 2030 funds digital industrial corridors where PLM orchestrates modular equipment builds. African telecom equipment refurbishers evaluate cloud PLM to optimize spare-parts logistics. Although absolute revenue lags, rising green-field investments yield double-digit growth pockets across the Product Lifecycle Management (PLM) Software Market.

Regulatory Landscape
Regulation affecting PLM software adoption increasingly centers on cybersecurity assurance, auditability, and traceability of product records used across regulated manufacturing. In the United States, Executive Order 14028 and related federal guidance on software supply chain security have pushed vendors serving public-sector and defense-adjacent programs to strengthen secure development practices and provide procurement-ready evidence, while NIST SP 800-171 Rev. 3 remains a common baseline for protecting Controlled Unclassified Information (CUI) in contractor environments. The DoD Cybersecurity Maturity Model Certification (CMMC) program operationalizes these requirements through third-party assessments and ongoing affirmations, raising demand for PLM platforms that can demonstrate role-based access controls, immutable audit trails, and governed collaboration.
In Europe, sustainability and AI governance are shaping PLM roadmaps. CSRD-driven Scope 3 reporting starting from fiscal 2025 has accelerated the need to capture lifecycle attributes and supplier data within the digital thread, bringing PLM closer to compliance reporting workflows. The EU AI Act adds additional requirements for AI-enabled engineering assistants and automation embedded in PLM toolchains, with high-risk categories requiring conformity assessments on a defined timeline (including an August 2026 compliance milestone referenced in industry and policy interpretations). That timeline increases expectations for technical documentation, human oversight, and model governance within engineering software environments.
Value Chain Analysis
The PLM software value chain starts with core platform IP and enabling technologies (cloud infrastructure, databases, identity and access management, and security tooling), then extends into solution packaging such as PDM, workflow, configuration/change management, simulation connections, and digital manufacturing and MES integration. Upstream, CAD/CAE/ECAD and MBSE tools supply authoring data that must be normalized into PLM data models, and standards and schemas such as STEP AP242 are increasingly used to reduce translation friction across multi-CAD estates. Midstream, PLM vendors and hyperscaler partners deliver SaaS or hybrid deployments, while system integrators and specialized consultancies handle data migration, process design, and integration to ERP, MES, and quality systems, which often becomes the critical path due to the documented manual remediation burden in legacy-to-cloud moves.
Downstream, manufacturers operationalize PLM as a supplier-collaboration and compliance backbone, distributing controlled product definitions to tiered supply chains and connecting engineering changes to production and service. Recent platform moves also point to a growing AI layer across the chain: Propel Software announced production availability of Model Context Protocol (MCP) in June 2026 to connect enterprise AI platforms to live product data, reflecting how AI agents and external intelligence are becoming part of PLM consumption. Value capture increasingly comes from integrated suites and ecosystems (marketplaces, pre-built connectors, and domain templates), while bottlenecks persist around interoperability, security accreditation demands in regulated programs, and the scarcity of PLM transformation skills needed to implement a true digital thread across organizations.
Competitive Landscape
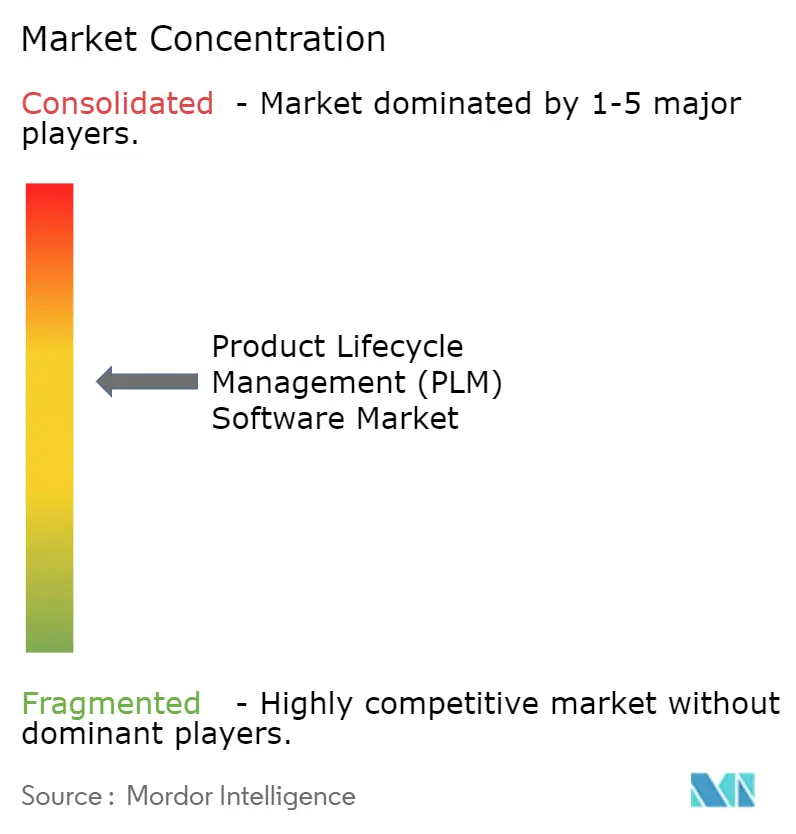
The PLM software market is moderately concentrated. Siemens, Dassault Systèmes, and PTC controlled an estimated 40-45% revenue in 2025. Siemens acquired Altair Engineering for USD 10.6 billion in January 2025 to fuse multiphysics simulation with Teamcenter and fortify its Xcelerator portfolio. Dassault extended 3DEXPERIENCE into ISO 13485 quality modules, addressing medical-device workflows. PTC sharpened its SaaS focus by divesting non-core analytics assets and redirecting capital toward Windchill+ feature depth.
Start-ups exploit white spaces. Aras delivers open architecture with perpetual subscription, courting automotive suppliers seeking upgrade agility. Propel’s Salesforce-native design unifies product and customer data in a single SaaS tenant, resonating with hardware start-ups that emphasize commercialization speed. Open-source frameworks such as Eclipse Sirius and OpenBOM undercut list pricing, forcing incumbents to justify premiums via tighter integration, compliance content, and 24/7 support.
Technology differentiation is migrating from baseline PDM to domain-specific AI copilots, no-code configuration, and pre-packaged regulatory canvases. Vendors race to earn FedRAMP High authorizations and SOC 2 Type II attestations, prerequisites for aerospace, defense, and life-sciences bids. Oracle’s October 2024 security incident spotlighted the reputational hazard of lapses, reinforcing market demand for provable security hygiene. Competitive pressure will intensify as AI commoditizes entry-level features, shifting the battle to ecosystem breadth and data-model depth across the PLM software market.
Product Lifecycle Management (PLM) Software Industry Leaders
Siemens AG
SAP SE
Autodesk Inc.
PTC Inc.
Dassault Systèmes SE
- *Disclaimer: Major Players sorted in no particular order
Product Lifecycle Management (PLM) Software Market Companies Covered in this Report
- Siemens AG
- Dassault Systems SE
- PTC Inc.
- SAP SE
- Autodesk Inc.
- Oracle Corporation
- IBM Corporation
- ANSYS Inc.
- Aras Corporation
- Arena (SaaS by PTC)
- Infor Inc.
- Hexagon AB
- Bentley Systems Inc.
- Altair Engineering Inc.
- Propel Software
- IFS AB
- HCLTech xLMCloud
- Accenture Industry X
- OpenBOM
- Propulsion-PLM
- Centric Software
- CONTACT Software
Read Analysis of Product Lifecycle Management (PLM) Software Companies

Market Opportunities and Future Outlook
A major opportunity is compliance-driven digital traceability and sustainability reporting becoming operational requirements rather than periodic documentation exercises. The EU CSRD, with Scope 3 reporting starting fiscal 2025, is pulling lifecycle attributes, supplier data, and as-built traceability deeper into PLM, creating whitespace for vendors that bundle lifecycle assessment, supplier collaboration, and governed reporting workflows into the core platform. In regulated environments, procurement pressure from frameworks such as NIST SP 800-171 Rev. 3 and CMMC elevates demand for PLM deployments with provable access controls and audit logs. That supports differentiated offerings around secure tenancy, attestation-ready controls, and standardized evidence packaging for audits.
Another opportunity is the expansion of PLM beyond discrete manufacturing into faster-cycle, software-defined and network product environments where product data, configurations, and change governance cross organizational boundaries. Evidence of this shift includes Ericsson using Dassault Systèmes 3DEXPERIENCE with SIMULIA CST Studio Suite to centralize antenna component libraries and databases for telecom product development, and telecom operators using PLM-based digital threads during merger integration to standardize catalogs, pricing, and engineering modifications. Vendor investments that embed supply chain intelligence into lifecycle workflows further open value pools in sourcing-aware design and rapid component requalification, aligning PLM with resilience requirements that increasingly influence engineering decisions alongside logistics.
Recent Industry Developments in Product Lifecycle Management (PLM) Software Market
- June 2026: Siemens announced a new 3D electrical systems design workflow in its Capital software that integrates with Teamcenter. The update strengthens cross-domain collaboration between electrical and mechanical engineering data inside PLM, supporting tighter digital thread continuity for electromechanical products.
- May 2026: Siemens partnered with Xometry and disclosed a USD 50 million minority investment to embed AI-native supply chain intelligence into the Siemens Xcelerator ecosystem. Bringing sourcing and manufacturability signals closer to engineering workflows expands PLM from design governance into earlier, supply-aware decision-making.
- August 2024: SAP and Hilti expanded their collaboration to bring product lifecycle management capabilities to the cloud, positioning PLM closer to enterprise processes and broader user bases. The move highlights continued vendor focus on cloud delivery and tighter integration between PLM and adjacent business systems for global product organizations.


Product Lifecycle Management (PLM) Software Market Report Scope and Research Methodology
Market Definition and Coverage
For this study, the market covers revenue earned from product lifecycle management (PLM) software that helps companies manage product data and processes from early concept and design through manufacturing, service, and end of life, delivered as on-premise licenses or cloud subscriptions.
Scope exclusions: We do not count pure CAD tools, standalone BOM editors, or custom in-house builds that are not commercial PLM software offerings.
Segments Covered in This Report
- By Deployment Type
- On-Premise
- Cloud
- By Solution Type
- Collaborative PDM / cPDM
- MCAD Integration PLM
- Simulation and Analysis
- Digital Manufacturing and MES-PLM
- ALM / SLM
- By Organisation Size
- Large Enterprises
- Small and Medium Enterprises (SMEs)
- By End-user Industry
- Automotive and Transportation
- Aerospace and Defence
- Electronics and High-Tech
- Industrial Machinery and Heavy Equipment
- Architecture, Engineering and Construction
- Life Sciences and Medical Devices
- Consumer Packaged Goods / Retail
- Other End-user Industries
- By Geography
- North America
- United States
- Canada
- Mexico
- Europe
- Germany
- United Kingdom
- France
- Italy
- Spain
- Russia
- Rest of Europe
- Asia Pacific
- China
- Japan
- India
- South Korea
- Australia and New Zealand
- Rest of Asia Pacific
- South America
- Brazil
- Argentina
- Rest of South America
- Middle East
- Saudi Arabia
- United Arab Emirates
- Turkey
- Rest of Middle East
- Africa
- South Africa
- Nigeria
- Rest of Africa
- North America
Data Sources, Market Sizing, and Validation
Desk Research
Desk work starts by mapping what buyers actually pay for in PLM software and how those budgets show up in public data. We review sources such as the US Securities and Exchange Commission filings, the US Bureau of Economic Analysis and Bureau of Labor Statistics for relevant IT spend indicators, OECD and World Bank macro series, and broad digital manufacturing and standards context from bodies such as NIST and ISO. This helps keep the market boundary tied to software revenue, rather than drifting into broader engineering services.
We also use annual reports, earnings transcripts, product documentation, customer case notes, and reputable press coverage to understand packaging changes, cloud migration, and typical renewal patterns. When a company discloses limited line items, paid company financials and intelligence databases are used to normalize reporting periods and currency presentation. This list is illustrative, and many other public sources were also used for data collection, cross-checking, and clarification.
Primary Interviews and Surveys
Primary work is used to test our desk assumptions against how PLM is purchased and deployed in real programs. We speak with software publishers, channel and implementation partners, and enterprise users across major regions to confirm adoption pace, cloud pricing shifts, and module attach rates, and then feed those findings back into the model.
Distribution of primary research fieldwork respondents
| Company type | Respondent position | Region |
|---|---|---|
| Top tier: 30% | CXOs: 16% | APAC: 48% |
| Mid tier: 48% | Functional/Unit leaders: 35% | EMEA: 29% |
| Smaller Players: 22% | Managers: 49% | Americas: 23% |
Market-Sizing & Forecasting
Market sizing is built using top-down logic, where software spend pools are reconstructed by region and industry, and then filtered by PLM penetration and typical PLM budget share within engineering and manufacturing IT. To keep totals realistic, results are corroborated with selective bottom-up checks, such as sampling vendor revenue disclosures, partner channel signals, and sampled license or subscription pricing multiplied by estimated active seats in key industries.
A few inputs that matter in this market include the cloud versus on-premise mix, average subscription price per user (and how it steps up with added modules), renewal and churn behavior for enterprise contracts, engineering headcount trends in manufacturing-heavy verticals, and the pace of digital manufacturing and connected product programs that pull PLM into the core stack. When a bottom-up check has gaps, the missing pieces are handled through conservative ranges anchored to peer disclosures, and then tightened through interview feedback.
Forecasting relies mainly on scenario analysis, since adoption and pricing can shift quickly when cloud migrations accelerate or large programs are delayed. We project key drivers first, such as cloud mix, seat growth, and pricing progression, and then roll them into revenue forecasts that are reviewed with expert expectations gathered in primary discussions.
Data Validation & Update Cycle
Validation is done through multiple checks, not only by re-reading the same source twice. Our team compares outputs against independent signals, such as disclosed software revenue trends, cloud subscription growth cues, and regional manufacturing and engineering activity indicators, and then investigates any variance that appears too high given the demand environment.
Before sign-off, the model goes through stepwise analyst reviews so that scope boundaries, currency handling, and time-series behavior remain consistent. Reports are refreshed annually, and interim updates are made when material events occur, such as major pricing changes, new compliance requirements, or large shifts in deployment preference. Right before delivery, a fresh pass is completed so clients get the most current view supported by the latest evidence.
Mordor Intelligence's Product Lifecycle Management Software Market Size Measured Against Other Published Estimates
Published market sizes for PLM software can look far apart, even when they are all trying to describe the same space. The differences usually come from how each study draws the line between software and services, how cloud subscriptions are annualized, and which modules are treated as PLM versus adjacent engineering tools.
Revenue disclosures and renewal signals, together with channel feedback on seat counts and pricing steps, are used as checks that keep Mordor Intelligence anchored to a software-only PLM demand pool starting from 2026 at USD 50.17 B. Once those anchors are set, the spread versus other figures is typically explained by what gets added around the edges, how fast pricing is assumed to rise, and how often the model is refreshed for deployment mix changes and currency timing.
Benchmark comparison
| Source | Market Size | Gaps in Research Methodology |
|---|---|---|
| Mordor Intelligence | USD 50.17 B (2026) | |
| Global Consultancy A | USD 29.00 B (2024) | Uses an earlier base year and a tighter 2024 snapshot, and its scope appears to mix software with professional services language in places, which can compress the software-only total depending on how services are netted out. |
| Industry Research Group B | USD 34.70 B (2024) | Covers the broader PLM market including services, and the reported 2024 value can move higher or lower versus software-only sizing based on how implementation and managed services revenue is counted and how cloud subscription revenue is recognized. |
Taken together, the table shows that year selection and scope boundaries are the biggest levers for PLM sizing, and they can outweigh pure growth assumptions. By keeping the model traceable to software revenue mechanics (subscription annualization, module attach, and deployment mix) and then re-checking those assumptions with real buying signals, we can present a market size that is easier to reproduce and explain on a step-by-step basis.


Key Questions Answered in the Report
What is the current value of the PLM software market?
The PLM software market size stood at USD 50.17 billion in 2026 and is forecast to reach USD 73.91 billion by 2031.
Which deployment model is growing fastest?
Cloud-based PLM is the fastest-growing deployment model, registering a 10.96% CAGR through 2031, as manufacturers shift away from on-premise servers.
Which industry segment will expand most quickly?
Electronics and high-tech is projected to grow at a 9.56% CAGR, driven by advanced packaging, 5G, and AI accelerator design cycles.
Why are SMEs adopting PLM now?
Micro-subscription pricing and cloud delivery remove upfront infrastructure costs, allowing SMEs to access enterprise-grade functionality on demand.
Why are regulatory mandates important for PLM adoption?
Rules such as the EU’s CSRD and the U.S. FDA’s 21 CFR Part 11 require granular product traceability, pushing companies to digitize design records within PLM systems.
How does generative AI affect PLM workflows?
Generative-AI copilots automate change-order analysis, requirements generation, and work-instruction authoring, reducing engineering cycles and documentation overhead.
Is the market fragmented or consolidated?
With the top five vendors holding about 55% revenue share, the landscape is moderately consolidated but remains open to niche and open-source challengers.
Page last updated on:


 Your data is secure and never sold or shared.


