Market Overview
| Study Period | 2021 - 2031 |
|---|---|
| Forecast Data Period | 2026 - 2031 |
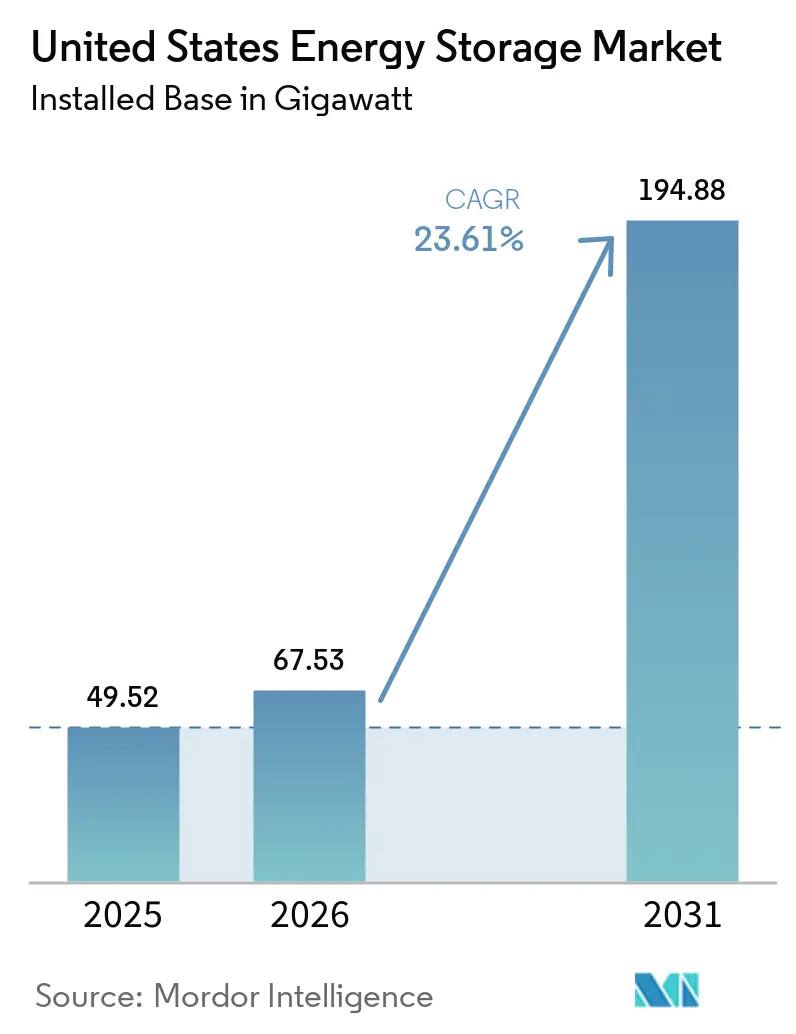
| Base Year Market Size (2025) | 49.52 gigawatt |
| Market Volume (2026) | 67.53 gigawatt |
| Market Volume (2031) | 194.88 gigawatt |
| Growth Rate (2026 - 2031) | 23.61% CAGR |
| Market Concentration | Medium |
Major Players *Disclaimer: Major Players sorted in no particular order Image © Mordor Intelligence. Reuse requires attribution under CC BY 4.0. | |
United States Energy Storage Market Analysis by Mordor Intelligence
The United States Energy Storage Market size in terms of installed base is expected to grow from 49.52 gigawatt in 2025 to 67.53 gigawatt in 2026 and is forecast to reach 194.88 gigawatt by 2031 at 23.61% CAGR over 2026-2031.
Declining battery costs, federal tax credits, and ISO/RTO market reforms are aligning to shorten payback periods and accelerate project pipelines. Section 45X production incentives are cutting the landed cost of domestic lithium-ion packs by 15%, while FERC rules that let aggregated batteries earn capacity, energy-arbitrage, and ancillary-service revenues have created entirely new income streams. Utilities are turning to storage to replace retiring coal units and to support solar and wind additions, and commercial customers view batteries as insurance against outages and peak charges. Supply-chain localization, long-duration technology breakthroughs, and virtual power plant enrollment programs together are expected to keep the growth trajectory intact even as wholesale prices soften.
Key Report Takeaways
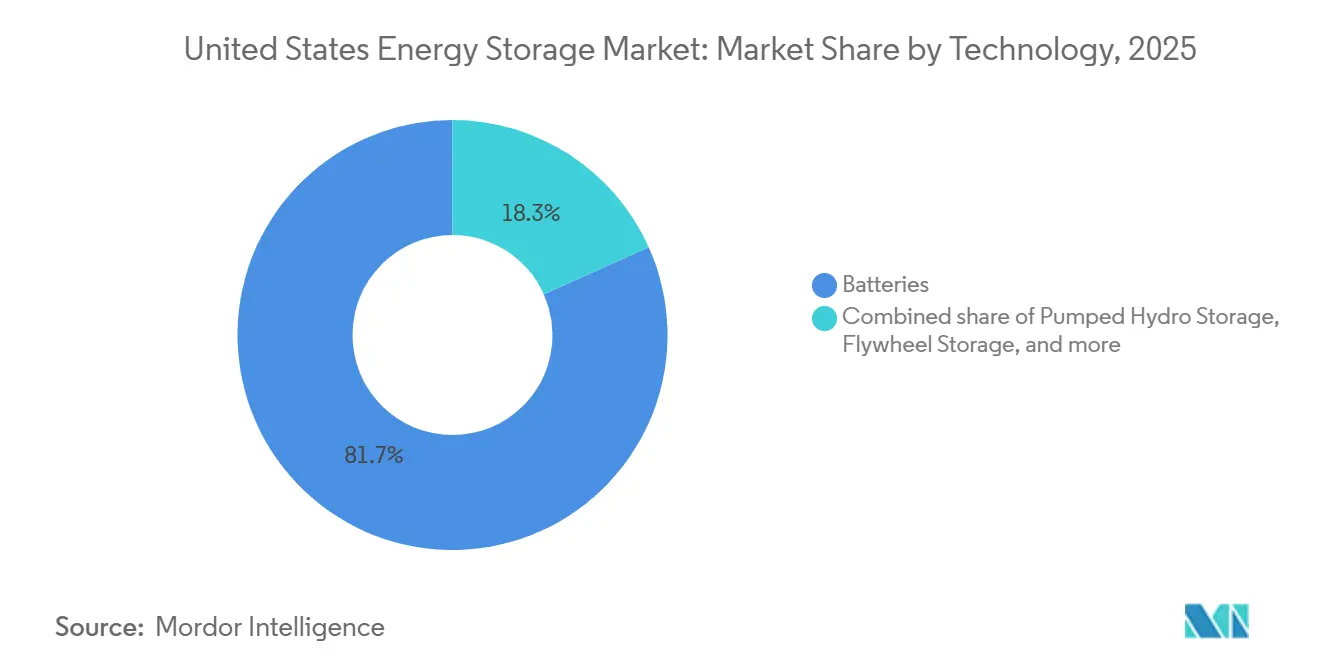
- By technology, batteries led with 81.7% of installed capacity in 2025, while hydrogen storage is on track for a 30.5% CAGR through 2031.
- By capacity rating, the 10–100 MWh band captured 38.6% of installed capacity in 2025; systems above 100 MWh are projected to grow at a 36.1% CAGR through 2031.
- By installation, front-of-the-meter assets held 73% of the Energy storage systems in the United States market share in 2025, whereas behind-the-meter assets are forecast to rise at a 27.3% CAGR to 2031.
- By application, renewable-integration projects commanded 48.9% of demand in 2025, yet backup-power solutions are advancing at a 31% CAGR through 2031.
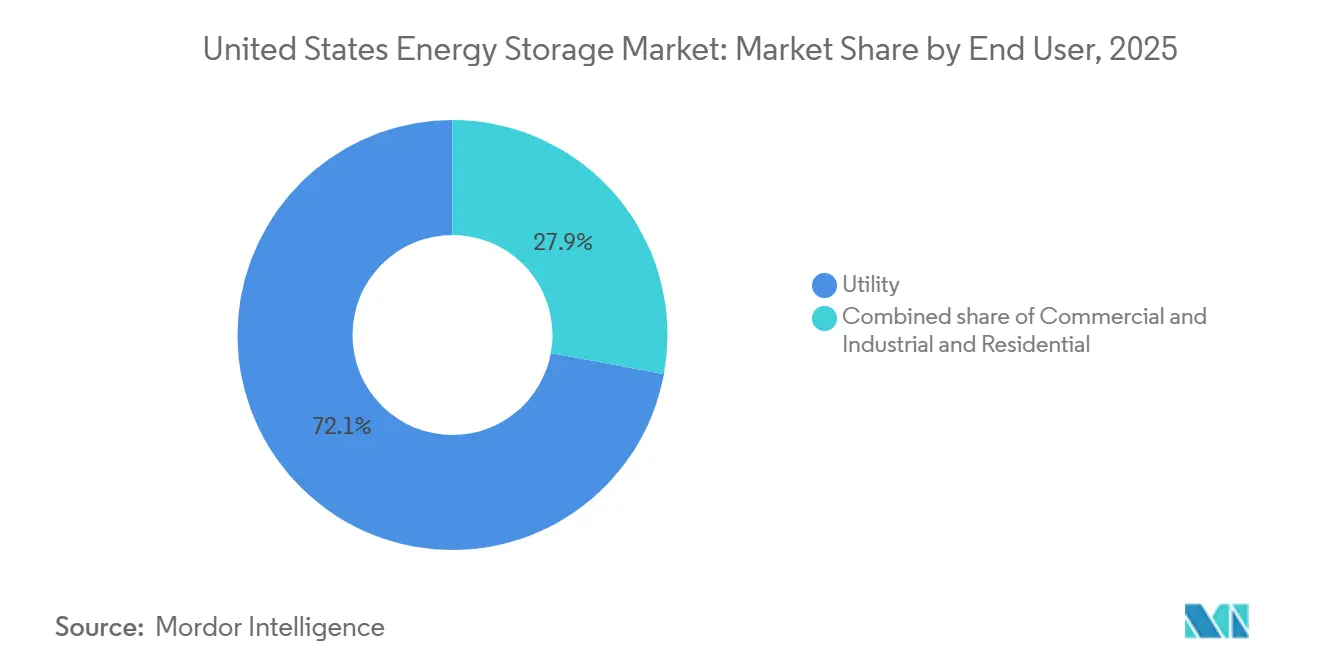
- By end user, utilities accounted for 72.1% of deployments in 2025; residential uptake is the fastest growing at 28.6% CAGR through 2031.
Note: Market size and forecast figures in this report are generated using Mordor Intelligence’s proprietary estimation framework, updated with the latest available data and insights as of January 2026.
United States Energy Storage Market Trends and Insights
Drivers Impact Analysis*
| Driver | (~) % Impact on CAGR Forecast | Geographic Relevance | Impact Timeline |
|---|---|---|---|
| Federal Investment Tax Credit Extension Boosting Residential Storage Demand | 4.2% | National, strongest in California, Texas, Arizona | Medium term (2-4 years) |
| FERC Order 841/2222 Accelerating Wholesale-Market Participation of Storage | 3.8% | ISO/RTO regions: CAISO, ERCOT, PJM, NYISO | Short term (≤ 2 years) |
| California Rule 21 & NEM 3.0 Driving Behind-the-Meter Deployments | 3.1% | California, spill-over to Hawaii, Massachusetts | Short term (≤ 2 years) |
| Solar-plus-Storage Pipeline Growth Across ERCOT and WECC | 5.5% | Texas, California, Nevada, Arizona | Medium term (2-4 years) |
| IRA-Linked Domestic Battery-Manufacturing Tax Credits Lowering BESS Cost | 4.0% | National, manufacturing hubs in Southeast, Midwest | Long term (≥ 4 years) |
| Aggressive Utility IRPs Retiring Coal and Adding Long-Duration Storage | 3.5% | National, concentrated in coal-dependent states | Long term (≥ 4 years) |
| Source: Mordor Intelligence | |||
Federal Investment Tax Credit Extension Boosting Residential Storage Demand
The 30% standalone storage credit now available until 2032 unlocked a surge of retrofit sales as households add batteries to existing rooftop solar arrays. Residential installations rose 42% year over year in 2025, with California, Texas, and Arizona responsible for 68% of those additions. Tesla’s Powerwall 3, featuring 13.5 kWh usable capacity and an integrated hybrid inverter, captured roughly 35% of the residential segment by mid-2025. Enphase Energy shipped 29% more IQ Battery units during Q1 2025 as installers bundled storage with new solar projects to maximize customer tax savings. Time-of-use rates that peak during evening hours let homeowners trim monthly bills by USD 80–150, and virtual power plant programs add USD 300–700 in annual grid-service revenue per participant. The decade-long policy certainty is therefore accelerating adoption and smoothing demand cycles.
FERC Order 841 & 2222 Accelerating Wholesale-Market Participation of Storage
Regional transmission organizations have opened roughly 15 GW of incremental market access since 2024. CAISO registered 6.2 GW of active battery participation by Q3 2025, with storage supplying up to 18% of evening peak demand on high-load days.[1]California ISO, “Battery Participation Statistics Q3 2025,” caiso.com ERCOT activated its aggregated-resource protocol in early 2025, enrolling more than 800 MW of behind-the-meter batteries within six months.[2]Electric Reliability Council of Texas, “Aggregated DER Protocol Implementation Report,” ercot.com PJM cleared 2.1 GW of storage in its 2025 capacity auction after revising rules that now pay batteries meeting four-hour duration thresholds. NYISO participation tripled between 2024 and 2025 to 1.8 GW as developers capitalized on locational premiums in densely populated zones. These reforms reposition storage from a niche ancillary-service asset into a dependable dispatchable resource that directly displaces gas peakers.
Solar-plus-Storage Pipeline Growth Across ERCOT and WECC
ERCOT’s queue listed 52 GW of solar-plus-storage capacity by mid-2025, equal to 38% of all pending projects. Developers pair batteries with solar to share interconnection rights, capture tax credits, and arbitrage high-priced evening hours when wholesale prices can top USD 200 per MWh. NextEra Energy Resources will add 3.5 GW of batteries to its Texas solar fleet by 2027, cutting capital costs by 12% through shared infrastructure. In the West, CAISO’s resource-adequacy rules now value effective load-carrying capability, pushing developers toward 4- to 6-hour systems and catalyzing pilots of 8- to 12-hour flow batteries. Arizona Public Service likewise plans 2.8 GW of solar-plus-storage by 2030 to cover capacity left by coal retirements.
IRA-Linked Domestic Battery-Manufacturing Credits Lowering BESS Cost
Section 45X production credits of USD 35 per kWh for cells and USD 10 per kWh for modules allow domestic packs to land 18% below imported equivalents. Fourteen U.S. gigafactories with more than 200 GWh of combined output were under construction or advanced planning by mid-2025. Panasonic’s Kansas facility, operational since late 2024 at 30 GWh annual capacity, supplies Tesla’s Megapack line, letting the product reach turnkey pricing under USD 250 per kWh. LG Energy Solution’s Arizona plant, ramping to 27 GWh in 2025, has locked in long-term contracts with Fluence and Powin for IRA-compliant systems. Samsung SDI and SK On are co-developing a 35 GWh plant in Indiana scheduled for 2026 start-up. These credits also spur upstream expansion; Albemarle and Livent are enlarging lithium-hydroxide refining in North Carolina and Texas, aiming to supply 30% of domestic cathode needs by 2028.
Restraints Impact Analysis*
| Restraint | (~) % Impact on CAGR Forecast | Geographic Relevance | Impact Timeline |
|---|---|---|---|
| Interconnection Queue Congestion Delaying Large-Scale Projects | -2.8% | PJM, MISO, SPP regions | Short term (≤ 2 years) |
| PFAS Li-ion Electrolyte Safety Concerns Triggering Stricter Fire Codes | -1.9% | California, New York, urban jurisdictions | Medium term (2-4 years) |
| Uneven State-Level Incentives Undermining National Roll-out | -2.2% | Southeast, Mountain West states | Medium term (2-4 years) |
| Supply-Chain Critical-Minerals Exposure (Li, Ni, Co) to Geopolitical Risk | -3.0% | National, dependent on global supply chains | Long term (≥ 4 years) |
| Source: Mordor Intelligence | |||
Interconnection Queue Congestion Delaying Large-Scale Projects
Backlogs in PJM, MISO, and SPP exceeded 120 GW of storage and hybrid capacity by mid-2025, with average wait times surpassing 42 months.[3]Federal Energy Regulatory Commission, “Interconnection Queue Backlog Data 2025,” ferc.gov FERC’s cluster-study directive will help, but regional implementation lags, and developers face upgrade fees above USD 50 per kW that erode project economics. MISO recorded a 38% withdrawal rate in 2024 as sponsors abandoned delayed projects. SPP’s 18 GW storage queue delivered only 1.2 GW of commercial operations between 2024 and 2025. These constraints push new capacity toward ERCOT and CAISO, which process interconnections within two years and offer clearer cost allocations.
PFAS Li-ion Electrolyte Safety Concerns Triggering Stricter Fire Codes
Incidents in California and Arizona during 2024 drove revisions to NFPA 855 and city ordinances, imposing wider setback distances, enhanced gas-detection systems, and mandatory UL 9540A testing. California’s updated code, effective March 2025, increased average site footprints 15%–25% and raised preparation costs accordingly.[4]California Office of the State Fire Marshal, “Revised BESS Safety Guidelines 2025,” osfm.fire.ca.gov New York City introduced similar measures in late 2024, effectively barring installations in multi-tenant buildings unless outfitted with water-mist suppression that adds USD 30,000–50,000 per site. Compliance extends certification cycles by up to nine months, favoring manufacturers with established safety protocols. Alternative chemistries benefit; Eos Energy secured 1.2 GW of zinc-battery contracts in 2025 on the strength of simplified permitting and lower insurance premiums.
*Our forecasts treat driver/restraint impacts as directional, not additive. The impact forecasts reflect baseline growth, mix effects, and variable interactions.
Segment Analysis
By Technology: Batteries Dominate, Hydrogen Storage Emerges as Long-Duration Solution
The energy storage systems in the United States market saw batteries secure 81.7% of installed capacity in 2025, leveraging lithium-ion packs that cost USD 271 per kWh for utility-scale projects in 2024. Lithium-iron-phosphate and high-nickel NMC chemistries together account for about 95% of shipments, supported by domestic gigafactories that enjoy 45X credits. Lead-acid retains a 3% niche, while vanadium-flow and zinc-bromine pilots address applications needing 6- to 10-hour discharge. The energy storage systems in the United States market share for pumped hydro remains minimal for new builds because siting options are limited, though existing facilities continue to provide inertia.
Hydrogen storage is poised for a 30.5% CAGR through 2031, spurred by utility solicitations for 100-hour discharge capability. Mitsubishi Power is converting a Utah coal plant into a 300 MW hydrogen-fueled generator that will store electrolytic hydrogen in salt caverns. Compressed-air projects, such as Hydrostor’s 500 MW California development, offer 8-hour durations at lower capital cost than hydrogen. Flywheel and thermal systems continue to serve frequency and industrial heat niches, respectively, each well under 1% of capacity.


By Capacity Rating: Modular 10–100 MWh Systems Lead, Gigawatt-Scale Projects Accelerate
The 10–100 MWh class held 38.6% of 2025 capacity, reflecting utility preference for modular 20–50 MW blocks that match solar projects and avoid complex transmission upgrades. Fluence Gridstack and Powin Centipede dominate this tier with factory-assembled containers that compress construction schedules. Energy storage systems in the United States market size for this band is set to rise steadily as distribution utilities deploy feeder-scale assets to defer substation upgrades.
Projects above 100 MWh are expanding at a 36.1% CAGR. Vistra’s Moss Landing site in California reached 750 MW / 3,000 MWh in 2024, demonstrating the economic case for gigawatt-hour-scale batteries. AES and LS Power have multiple 300 MWh-plus projects underway in Texas and Nevada to exploit scarcity pricing and capacity payments. Sub-1 MWh systems serve the residential sector, where attachment rates in California exceeded 85% for new rooftop solar in 2025.
By Installation: Front-of-the-Meter Dominates, Behind-the-Meter Surges on NEM Reforms
Front-of-the-meter deployments claimed 73% capacity in 2025. ERCOT’s energy-only design lets storage earn USD 180 per kW-year in 2024 by capturing price spikes. CAISO values effective load-carrying capability, rewarding 4- to 6-hour batteries that narrow the net-load peak. PJM’s revised capacity rules cleared 2.1 GW of storage in its 2025 auction, expanding energy storage systems in the United States market for utility-owned assets.
Behind-the-meter installations are climbing 27.3% annually. California’s NEM 3.0 tariff, effective 2024, cut midday export credits by roughly 75%, pushing homeowners toward self-consumption via batteries. Enphase, Tesla, and LG dominate residential offers in the 10–15 kWh range, while commercial clients deploy 1–5 MW systems to shave peaks and secure backup power. Walmart pledged in 2025 to roll out batteries at 500 stores by 2027, signaling mainstream corporate adoption.

By Application: Renewable Integration Leads, Backup Power Surges on Resilience Needs
Renewable integration represented 48.9% of 2025 demand. ERCOT solar curtailment sets daytime prices near zero, so co-located storage shifts energy into evening peaks above USD 100 per MWh. CAISO’s resource-adequacy test now requires solar projects to demonstrate evening deliverability, effectively mandating 4-hour batteries.
Backup power and resilience are growing 31% per year. California utilities executed 4,200 Public Safety Power Shutoffs in the 2024 wildfire season, prompting a surge of residential and commercial microgrids. The energy storage systems in the United States market size for backup applications is projected to triple by 2031 as hurricanes and heatwaves strain grids nationwide. Demand-charge management rounds out 22% of use cases, and frequency regulation now holds 18% as fast-response batteries capture ancillary revenue.
By End User: Utilities Dominate Procurement, Residential Segment Accelerates on VPP Programs
Utilities bought 72.1% of capacity in 2025, led by multi-gigawatt solicitations from Xcel Energy, Duke Energy, and Southern Company. Xcel contracted Form Energy for a 500 MW iron-air system due online in 2028. The Los Angeles Department of Water and Power issued a 3 GW storage RFP in 2025 to meet its 100% renewables goal.
Residential adoption, expanding at 28.6% CAGR, is driven by tax credits, time-of-use pricing, and virtual power plant revenue. Sunrun enrolled 15,000 customer batteries into VPPs during 2025, earning each household up to USD 700. Commercial and industrial users make up 18% of demand, focusing on peak shaving and resilience; Duke Energy’s 2025 contract with Eos Energy for zinc batteries in North Carolina underscores C&I interest in chemistries that simplify permitting.
Geography Analysis
California and Texas together provided 58% of new capacity in 2025, yet follow distinct fundamentals. California’s 6.2 GW installed base stems from its 60% clean-electricity target by 2030, resource-adequacy rules, and NEM 3.0’s export-rate cuts. The Self-Generation Incentive Program disbursed USD 180 million in 2024 rebates but now has a 400 MW waitlist. Texas counts on ERCOT scarcity pricing, with average storage revenue of USD 180 per kW-year in 2024, and its streamlined interconnection keeps lead times under two years.
In the Northeast and Mid-Atlantic, New York reached 1.8 GW installed by 2025, concentrated where transmission bottlenecks inflate capacity prices. Massachusetts added 680 MW between 2024 and 2025 under its Clean Peak Standard, encouraging solar-plus-storage to serve evening demand. PJM cleared 2.1 GW in its 2025 auction, but interconnection delays persist.
Southeastern states lag because incentives are sparse and vertically integrated utilities favor gas peakers. Storage penetration in Florida, Georgia, and the Carolinas remains 60% below the national average. Arizona and Nevada, by contrast, have IRPs that collectively call for 5 GW of batteries by 2030 to backfill coal retirements.
The Pacific Northwest relies on hydropower, yet long-duration projects are emerging. Hydrostor’s 500 MW compressed-air plant and Mitsubishi Power’s hydrogen conversion illustrate a focus on seasonal firming. The Midwest suffers the nation’s worst queue congestion; MISO’s 2024 withdrawal rate of 38% underscores the challenge. Federal GRIP grants aim to ease constraints but remain oversubscribed.
Competitive Landscape
Market concentration is moderate. The top five suppliers, Tesla, Fluence, LG Energy Solution, NextEra Energy Resources, and AES, held about a 55% share in 2025. Tesla’s vertically integrated chain drives turnkey prices under USD 250 per kWh while sustaining 15%–18% gross margins. Fluence’s software-centric Gridstack platform secured 4.2 GW of orders in 2024–2025, including a 700 MW contract with Southern California Edison. LG’s Arizona gigafactory guarantees domestic content for Powin and other integrators.
Chinese producers CATL, BYD, and Sungrow underbid U.S. rivals by up to 15% due to lower cell costs, though tariff risk and domestic-content rules temper their growth. Form Energy and Eos Energy are disrupting incumbents with iron-air and zinc chemistries that promise 100-hour or fire-safe performance at competitive costs. Strategic moves include gigafactory build-outs (LG, Panasonic), partnerships on grid-forming inverters (Fluence and CATL), and long-term utility offtake agreements targeting IRA incentives.
United States Energy Storage Industry Leaders
Tesla Inc.
Fluence Energy LLC
LG Energy Solution Ltd.
NextEra Energy Resources
Enphase Energy Inc.
- *Disclaimer: Major Players sorted in no particular order

Recent Industry Developments
- May 2026: Ford Energy signed a five-year agreement with EDF Renewables to supply up to 20 GWh of battery energy storage systems (BESS). This partnership is intended to strengthen the U.S. electricity grid amid increasing demand, with initial deliveries scheduled for 2028.
- July 2025: Peak Energy, a startup specializing in sodium-ion battery energy storage systems (BESS), has successfully launched and dispatched its inaugural sodium-ion BESS. This system is set to be tested in a collaborative pilot program involving nine utilities and independent power producers (IPPs).
- March 2025: ENGIE and CBRE partnered to develop a 2.4 GW battery portfolio focused on real-estate-adjacent sites.
- March 2025: Diversified Energy, FuelCell Energy, and TESIAC formed an acquisition vehicle targeting 360 MW of net-zero power, including storage, for data centers in Appalachia.


Research Methodology Framework and Report Scope
Market Definitions and Key Coverage
Our study defines the United States energy storage market as the installed base and yearly additions of grid-connected and behind-the-meter systems that absorb electricity and discharge it on demand, including battery chemistries (Li-ion, lead-acid, flow, Na-S), pumped-hydro, compressed-air, flywheels, thermal storage, and power-to-hydrogen assets. Capacity is expressed in gigawatts of rated power; value calculations apply technology-specific average system costs.
Scope Exclusions: Mobile traction batteries, fuel-cell stacks used solely for mobility, and pure software dispatch services are kept outside the market boundary.
Segmentation Overview
- By Technology
- Batteries (Lithium-ion, Lead-acid, Flow Batteries, Sodium-sulfur and Others)
- Pumped Hydro Storage
- Compressed Air Energy Storage
- Flywheel Storage
- Thermal Energy Storage
- Hydrogen Energy Storage
- By Capacity Rating
- Below 1 MWh
- 1 to 10 MWh
- 10 to 100 MWh
- Above 100 MWh
- By Installation
- Front-of-the-Meter
- Behind-the-Meter
- By Application
- Renewable Integration
- Peak Shaving and Demand Charge Management
- Frequency Regulation
- Backup Power/Resilience
- By End User
- Residential
- Commercial and Industrial
- Utility
Detailed Research Methodology and Data Validation
Primary Research
Mordor analysts interviewed utility planners in California, Texas, and New York, EPC contractors building front-of-the-meter projects, residential solar-plus-storage installers, and component vendors across the Midwest. These conversations validated queue-conversion assumptions, real-world balance-of-system costs, and policy uptake rates, filling gaps that desk research alone could not bridge.
Desk Research
We began with publicly available, high-reliability datasets such as EIA Form 860/861, FERC Electric Quarterly Reports, DOE's Storage Futures Study, NREL price trackers, and American Clean Power's Storage Monitor. Trade association briefs, state PUC filings, patent trends from Questel, and federal incentive updates rounded out policy and cost inputs. Company 10-Ks, investor decks, and project press releases were scraped, while D&B Hoovers supplied revenue breakouts for key integrators and cell makers.
News aggregation from Dow Jones Factiva and peer-reviewed work in journals like Joule provided price-learning rates, safety recall statistics, and cycle-life benchmarks. The sources cited above illustrate the breadth of secondary material; many additional references were consulted for data corroboration and clarification.
Market-Sizing & Forecasting
A top-down model starts with historical installed capacity from EIA, applies forecast additions drawn from interconnection queues, and layers average $/kW costs to derive value. Results are cross-checked through selective bottom-up roll-ups of vendor shipments and sampled ASP × volume estimates. Key variables include average four-hour system cost declines, ITC step-down timelines, state storage mandates, residential solar attachment rates, and capacity-weighted utilization factors. Multivariate regression, supported by expert consensus, projects each driver to 2030; scenario analysis captures policy or materials-price shocks. Gap handling uses normalized cost curves where bottom-up data are thin.
Data Validation & Update Cycle
Outputs pass variance checks against ACP quarterly tallies and DOE price indices, followed by peer review and senior analyst sign-off. Our models refresh every 12 months, with interim revisions triggered by policy rulings or >10% cost swings.
Why Mordor's United States Energy Storage Baseline Commands Confidence
Published estimates differ because firms mix revenue and capacity units, select unequal technology baskets, and apply divergent system-price learning curves. By anchoring figures to verified EIA capacity data and current ITC rules, Mordor captures the market reality decision-makers budget against.
The largest gaps arise when others fold EV batteries into the total, assume blanket eight-hour durations, freeze price trajectories, or extend forecasts without refreshing project pipelines. Our annual refresh and dual-unit reporting avoid these pitfalls.
Benchmark comparison
| Market Size | Anonymized source | Primary gap driver |
|---|---|---|
| 49.52 GW installed base (2025) | Mordor Intelligence | - |
| USD 106.7 bn (2024) | Global Consultancy A | Combines revenue and capacity, includes EV traction packs, no price-learning adjustment |
| USD 138.6 bn (2025) | Industry Data Firm B | Assumes universal eight-hour duration and utility-only scope |
| USD 3.62 bn (2025) | Research Group C | Tracks standalone BESS revenue only, excludes pumped-hydro and hydrogen storage |
In sum, Mordor's disciplined scope selection, dual top-down/bottom-up cross-checks, and timed refresh cadence yield a balanced, transparent baseline that clients can retrace and replicate with confidence.


Key Questions Answered in the Report
How large is the Energy storage systems in United States market in 2026?
How large is the Energy storage systems in the United States market in 2026?
What is the expected CAGR for U.S. energy storage through 2031?
The market is forecast to grow at 23.61% between 2026 and 2031.
Which technology currently dominates deployments?
Lithium-ion batteries held 81.7% of installed capacity in 2025, far ahead of other chemistries.
Why are behind-the-meter installations accelerating?
California’s NEM 3.0 export-rate cuts and nationwide virtual power plant programs improve economics for residential and commercial batteries.
How are federal policies influencing battery costs?
Section 45X production tax credits reduce domestic cell costs by about 18%, lowering turnkey system prices below USD 250 per kWh.
Page last updated on:


