United States Embedded Finance Market Size and Share
Market Overview
| Study Period | 2019 - 2030 |
|---|---|
| Forecast Data Period | 2025 - 2030 |
| Historical Data Period | 2019 - 2023 |
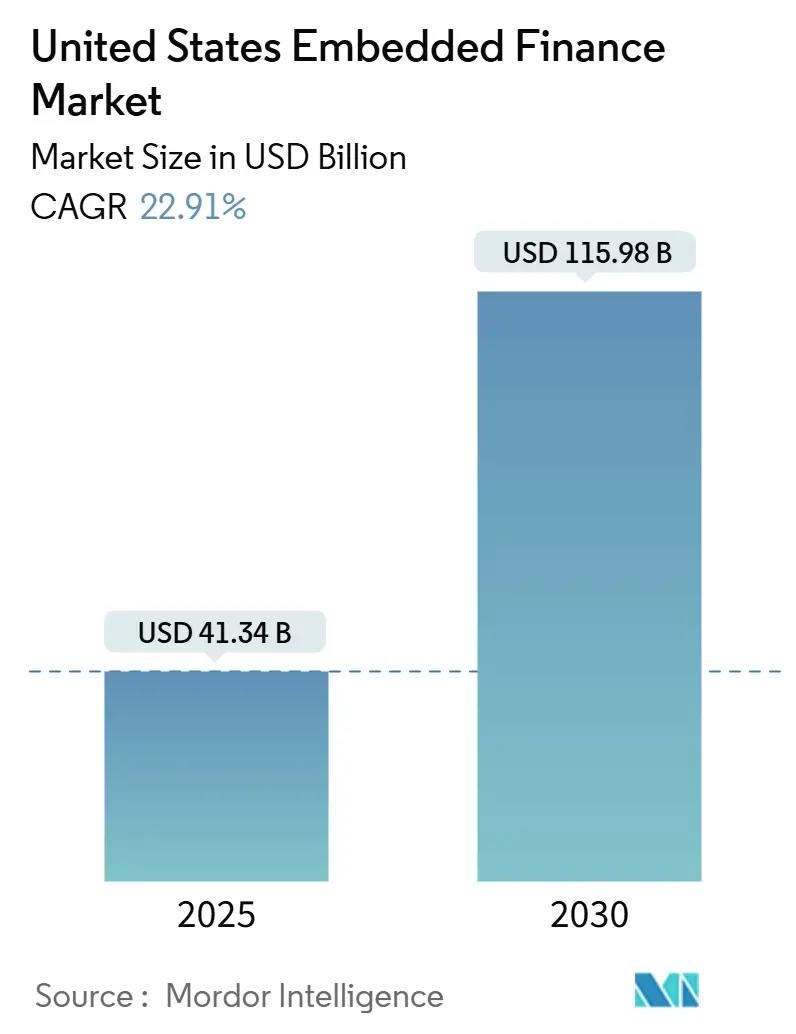
| Market Size (2025) | USD 41.34 Billion |
| Market Size (2030) | USD 115.98 Billion |
| Growth Rate (2025 - 2030) | 22.91% CAGR |
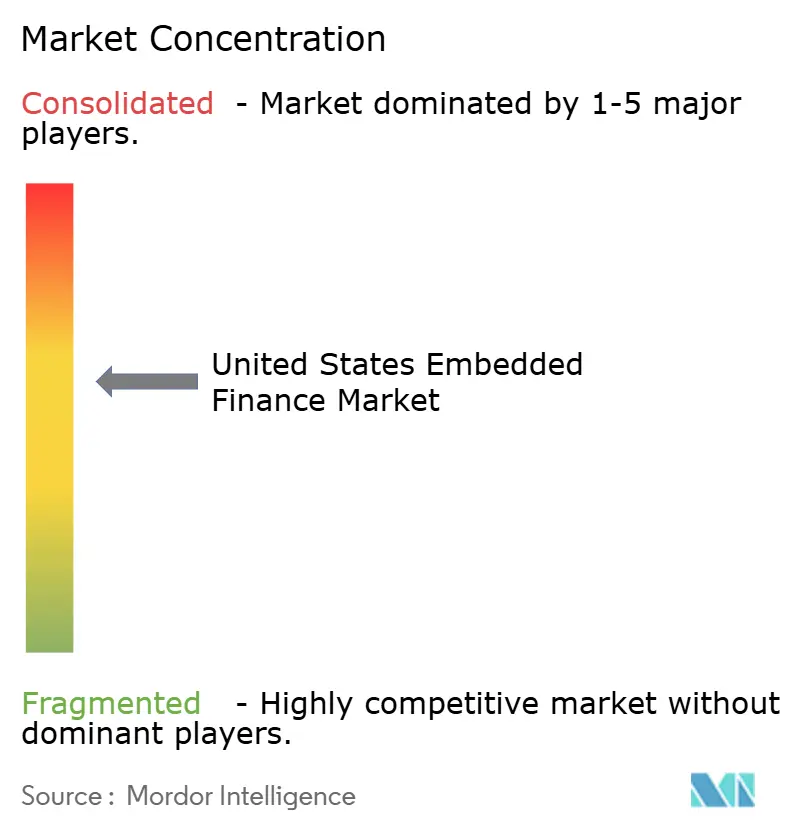
| Market Concentration | Medium |
Major Players *Disclaimer: Major Players sorted in no particular order Image © Mordor Intelligence. Reuse requires attribution under CC BY 4.0. | |
United States Embedded Finance Market Analysis by Mordor Intelligence
The United States embedded finance market size stood at USD 41.34 billion in 2025 and is projected to expand to USD 115.98 billion by 2030, registering a 22.91% CAGR over the forecast period. Robust demand for integrated digital payment rails, rapid adoption of open-banking APIs, and rising vertical SaaS penetration underpin this high-velocity growth. Real-time payments, earned wage access, and sector-specific working-capital tools continue to replace analog processes and unlock fresh revenue streams for non-financial platforms. Large banks are modernizing legacy cores to serve as data pipes, while fintech specialists tighten platform ties through deep industry collaborations. At the same time, the Consumer Financial Protection Bureau’s Section 1033 rule standardizes data sharing, giving consumers and the software firms that serve them secure access to account information. These converging forces are compressing deployment timelines, shifting margin pools, and accelerating platform consolidation.
Key Report Takeaways
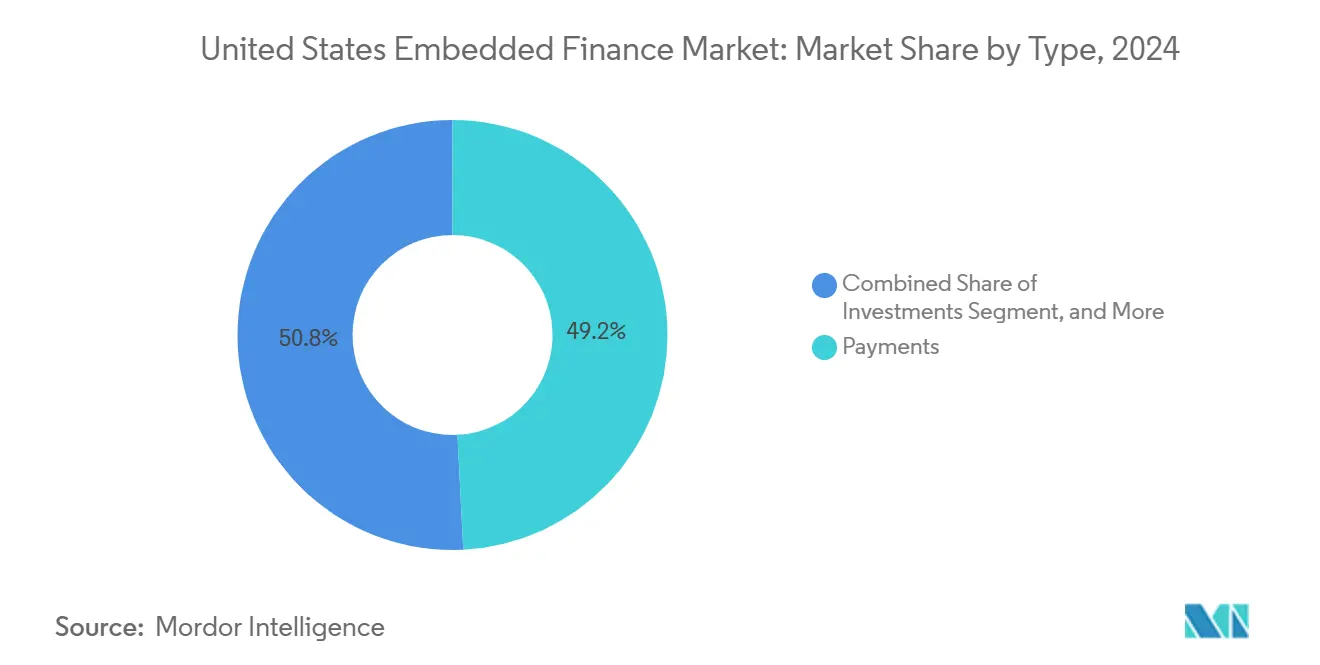
- By type, payments led with a 49.20% share of the United States embedded finance market in 2024, whereas investments is forecast to post the fastest 24.51% CAGR through 2030.
- By end-use industry, retail and e-commerce commanded 30.50% revenue in 2024, while healthcare and pharmaceuticals is on track for a 23.12% CAGR to 2030.
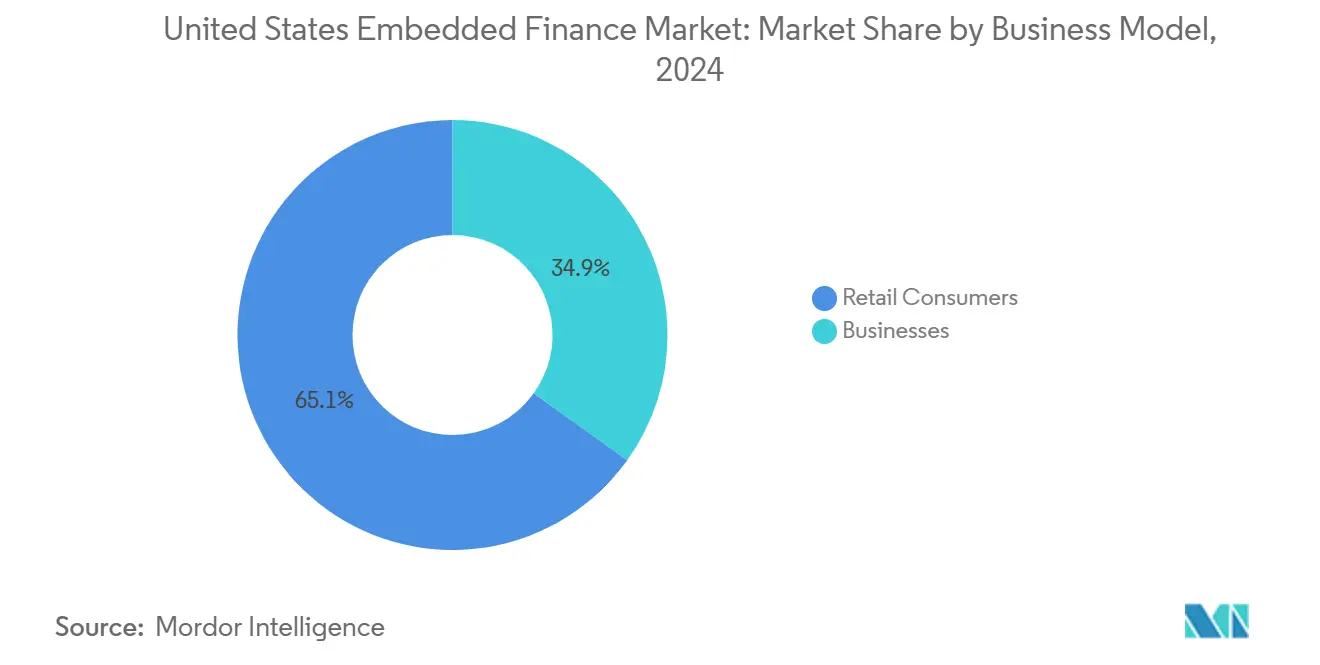
- By business model, the retail consumer segment held 65.10% of the market in 2024; business adoption is projected to rise at a 25.71% CAGR over the same 2030.
Worldwide, activity is shaped by contributions from multiple countries and regions, with United states representing one among them. The global report on embedded finance market by Mordor Intelligence reflects how these countries and regional layers combine into a single system.
United States Embedded Finance Market Trends and Insights
Drivers Impact Analysis*
| Driver | (~) % Impact on CAGR Forecast | Geographic Relevance | Impact Timeline |
|---|---|---|---|
| Surge in digital payments post-COVID | +4.2% | Global, with strongest adoption in urban centers | Medium term (2-4 years) |
| API-first banking enabling rapid integration | +5.8% | National, concentrated in tech hubs | Long term (≥ 4 years) |
| Consumer demand for frictionless checkout experiences | +3.9% | National, led by e-commerce centers | Short term (≤ 2 years) |
| Growth of gig economy and earned wage access | +2.7% | National, highest in metropolitan areas | Medium term (2-4 years) |
| CFPB Section 1033 open-banking mandate | +4.1% | National regulatory requirement | Long term (≥ 4 years) |
| Vertical SaaS platforms embedding financial services | +3.5% | National, sector-specific concentrations | Long term (≥ 4 years) |
| Source: Mordor Intelligence | |||
API-First Banking Infrastructure Accelerates Platform Integration
API-centric modernization lets software firms embed multi-rail payments, lending, and compliance modules without rebuilding core systems. JPMorgan Chase has opened standardized endpoints that push real-time transaction data directly into partner SaaS dashboards, lowering integration costs and speeding feature releases. The Federal Reserve’s FedNow service, live since 2023, further reduces settlement latency for platform payments, with 83% of small healthcare providers now using instant rails. Together, big-bank APIs and government rails give non-financial apps the plumbing to launch bank-grade services inside their native workflows.
Post-COVID Digital-Payment Surge Creates Sticky Habits
Federal Reserve diaries show mobile wallet usage for in-person purchases climbed from 8% in 2019 to 15% in 2024. Contactless taps already represent 51% of card transactions, cementing consumer comfort with device-first transactions. Oracle capitalized on the behavioral shift by rolling out an embedded-payment module for hospital systems in 2024 that moves billing, collections, and reconciliation into one pane of glass.[1]Oracle Corporation, “Oracle Helps Healthcare Facilities Simplify Patient Payments While Reducing Transaction Fees,” oracle.com These permanent habits lift transaction volumes on platform rails and unlock cross-sell opportunities for credit, insurance, and investments.
Consumer Demand for Frictionless Checkout Experiences Spurs Adoption
Surveys show 79% of healthcare users want to pay every bill through a single digital interface, and 72% will switch providers to get it. Embedded-payment modules satisfy that demand by marrying context and cash flow letting a patient schedule telehealth, receive an estimate, finance a balance, and settle the charge without leaving the portal. The same dynamic holds for e-commerce, where one-click checkouts now boost conversion rates by double-digit percentages, reinforcing the value proposition of integrated finance for merchants.
Gig-Economy Earned Wage Access Unlocks New Pay Cycles
More than 57 million Americans perform freelance or contract work, and many prefer on-demand pay over fortnightly cycles. Five states adopted earned-wage-access statutes in 2024, legitimizing early-pay providers that plug straight into employer HR software. Fleet platforms show the model’s impact: ITS Logistics launched a same-day QuickPay tool that approved 1,000 carriers in three months and pushed average fuel savings of USD 0.45 per gallon. Rapid payroll settlement not only builds worker loyalty but also lets platforms monetize float and ancillary credit products.
Restraints Impact Analysis*
| Restraint | (~) % Impact on CAGR Forecast | Geographic Relevance | Impact Timeline |
|---|---|---|---|
| Fragmented federal and state compliance requirements | -2.8% | National, varying by state jurisdiction | Long term (≥ 4 years) |
| Data privacy and cyber-security concerns | -3.2% | National, heightened in regulated sectors | Medium term (2-4 years) |
| Bank-partner concentration risk | -1.9% | National, concentrated in BaaS relationships | Medium term (2-4 years) |
| Interchange-fee compression squeezing margins | -2.1% | National payment processing | Short term (≤ 2 years) |
| Source: Mordor Intelligence | |||
Fragmented Regulatory Compliance Raises Barriers
Money-transmission licenses, usury caps, and consumer-protection rules differ across states, forcing embedded-finance providers to patchwork compliance strategies. The Office of the Comptroller of the Currency reminded banks in 2024 that they remain liable for fintech partners’ conduct, prompting stricter third-party audits and delayed product rollouts.[2]Office of the Comptroller of the Currency, “OCC Issues Guidance on Third-Party Risk Management,” occ.govComplexity particularly burdens small SaaS players, tilting early-mover advantage toward firms with robust legal infrastructure.
Cybersecurity Pressures Threaten Platform Trust
Healthcare breach costs averaged USD 11 million per incident in 2023, and regulators levy steep penalties for data-handling lapses. Embedding payment and credit features multiplies attack surfaces: account tokens, underwriting models, and cloud wallets become targets. Ninety-two percent of providers now rank security upgrades as a top investment priority, pushing up compliance budgets and potentially squeezing margins for platform operators.[3]J.P. Morgan, “15th Annual Trends in Healthcare Payments Report,” jpmorgan.com
*Our forecasts treat driver/restraint impacts as directional, not additive. The impact forecasts reflect baseline growth, mix effects, and variable interactions.
Segment Analysis
By Type: Payments Retain Primacy While Investments Accelerate
Payments represented 49.20% of the United States embedded finance market share in 2024, reflecting their role as the entry point for most platform monetization models. Card-routing optimization, payout-on-demand, and FedNow access keep payments sticky, while interchange compression compels providers to layer credit and insurance for incremental yield. Lending solutions such as buy-now-pay-later ride atop payment tokens, especially in healthcare where out-of-pocket expenses rise faster than wages.
Investments, by contrast, will clock a 24.51% CAGR to 2030, the fastest among service types. Fractional-share brokerage APIs and robo-advisory widgets embed inside neobanks, gig-work apps, and even ride-hail dashboards, turning idle balances into wealth-building channels. As APIs mature, platforms can toggle between micro-savings, tax-advantaged accounts, and thematic funds, converting engagement into fee income and deepening lifetime value.


By End-Use Industry: Retail Leads, Healthcare Surges
Retail and e-commerce held 30.50% of 2024 revenue owing to decades of online-checkout optimization. Merchants deploy white-label wallets, one-click buy buttons, and instant-refund rails to reduce cart abandonment. Loyalty programs now marry purchase data with point-of-sale lending and insurance offers, tightening retention loops.
Healthcare is set for a 23.12% CAGR as hospitals digitize billing and financing. Patient portals embed card-on-file and credit assessment, letting providers quote costs upfront, offer tailored installments, and automate collections. The shift compresses days-sales-outstanding and improves patient satisfaction, making healthcare a beacon for other regulated sectors that seek similar revenue-cycle overhauls.
By Business Model: Consumer Share Dominates, Business Momentum Builds
The consumer slice captured 65.10% of 2024 value, propelled by retail checkouts, P2P wallets, and neobank super-apps. User expectations for invisible finance are now firmly set, creating high switching costs.
Business uptake, however, will outrun consumer growth at a 25.71% CAGR. Enterprises digitize accounts payable, freight settlements, and supplier credit lines through embedded modules that sit inside ERP, fleet, or procurement systems. Higher ticket sizes and stickier contracts give B2B providers richer unit economics than consumer peers, suggesting a gradual rebalancing of market mix by 2030.
Geography Analysis
California, New York, and Texas anchor the United States embedded finance market owing to dense fintech clusters, abundant venture capital, and concentration of early-adopting retailers, health systems, and logistics firms. Silicon Valley platforms such as Stripe and PayPal export API standards nationwide, while Wall Street incumbents retrofit banking cores for data-sharing mandates, creating a bi-coastal innovation corridor.
Regulatory climate varies markedly at state level. Some jurisdictions fast-track money-transmission approvals and sandbox programs, whereas others retain conservative charters that prolong launch cycles. This unevenness influences go-to-market sequencing: providers often target fintech-friendly states, validate unit economics, then scale into stricter zones once compliance muscle firms up.
Rural regions show latent demand in agriculture, energy, and construction. Platforms that embed crop-insurance quotes or invoice-financing into farm-management apps can bridge service gaps left by branch closures. As mobile broadband expands, embedded finance unlocks under-served pockets, contributing incremental volume without the fixed costs of physical distribution.
Competitive Landscape
Market concentration sits in the middle range as digital-native specialists, incumbent processors, and megabanks converge. Stripe, PayPal, and Block continue to grow multi-rail ecosystems, bundling KYC, wallets, credit, and fraud tools. Visa and Mastercard power many back-end rails, yet face margin pressure from real-time alternatives. Meanwhile, banks such as JPMorgan Chase commercialize APIs and white-label compliance, positioning themselves as infrastructure partners rather than consumer brands.
Strategic moves focus on vertical depth. Oracle introduced a healthcare-specific payment suite in 2024 to capture hospital process flows, while fleet-card providers collaborate with telematics vendors to tokenize multi-brand fuel spend. Partnerships trump outright acquisitions as firms seek regulatory clarity before large-scale M and A.
Artificial intelligence loops across fraud detection, underwriting, and personalization now act as table stakes. Players investing in proprietary models gain edge in approval speed and loss mitigation, reinforcing platform lock-in and widening the moat against low-code imitators.
United States Embedded Finance Industry Leaders
Stripe, Inc.
PayPal Holdings, Inc.
Shopify Inc.
Affirm Holdings, Inc.
SoFi Technologies, Inc.
- *Disclaimer: Major Players sorted in no particular order

Recent Industry Developments
- January 2025: Carat from Fiserv released a survey of 282 executives indicating 83% of PayFacs plan digital-wallet innovation for logistics and wholesale trade, with half ranking operational enhancements as the top priority.
- January 2025: Transcard, Mastercard, and KNNX unveiled FreightX, a payments and fraud-management suite targeting the USD 75 billion over-the-road fleet-card market.
- December 2024: Visa launched Fleet 2.0 with 15 partners, unifying digital fleet payments through single-token credentials and real-time analytics.
- October 2024: Oracle introduced an embedded-payment module for hospital systems that integrates billing, collections, and reconciliation inside existing healthcare software.


United States Embedded Finance Market Report Scope
| Payments |
| Insurance |
| Lending |
| Investments |
| Other Service Types |
| IT and Telecommunication |
| Manufacturing |
| Retail and E-Commerce |
| Healthcare and Pharmaceuticals |
| Travel and Hospitality |
| Transportation and Logistics |
| Other Industry Verticals |
| Retail Consumers |
| Businesses |
| By Type | Payments |
| Insurance | |
| Lending | |
| Investments | |
| Other Service Types | |
| By End-Use Industry | IT and Telecommunication |
| Manufacturing | |
| Retail and E-Commerce | |
| Healthcare and Pharmaceuticals | |
| Travel and Hospitality | |
| Transportation and Logistics | |
| Other Industry Verticals | |
| By Business Model | Retail Consumers |
| Businesses |


Key Questions Answered in the Report
What is the projected size of the United States embedded finance market by 2030?
The market is forecast to reach USD 115.98 billion by 2030, expanding at a 22.91% CAGR from its 2025 base of USD 41.34 billion.
Which segment generates the largest share of embedded-finance revenue today?
Payments leads with 49.20% of 2024 revenue, reflecting its foundational role in platform monetization.
Which industry vertical is expected to grow the fastest?
Healthcare and pharmaceuticals shows the highest trajectory, projected at a 23.12% CAGR through 2030.
How does Section 1033 influence embedded finance?
The rule mandates standardized APIs for consumer data access by 2026, lowering integration barriers and enabling richer embedded-finance use cases.
Why is B2B adoption accelerating?
Enterprises integrate embedded tools to streamline payables, unlock working capital, and automate freight or supplier settlements, driving a 25.71% CAGR in the business segment.
What are the main risks facing providers?
Fragmented state compliance and escalating cybersecurity threats can raise operating costs and delay product launches.
Page last updated on:


