Market Overview
| Study Period | 2019 - 2031 |
|---|---|
| Forecast Data Period | 2026 - 2031 |
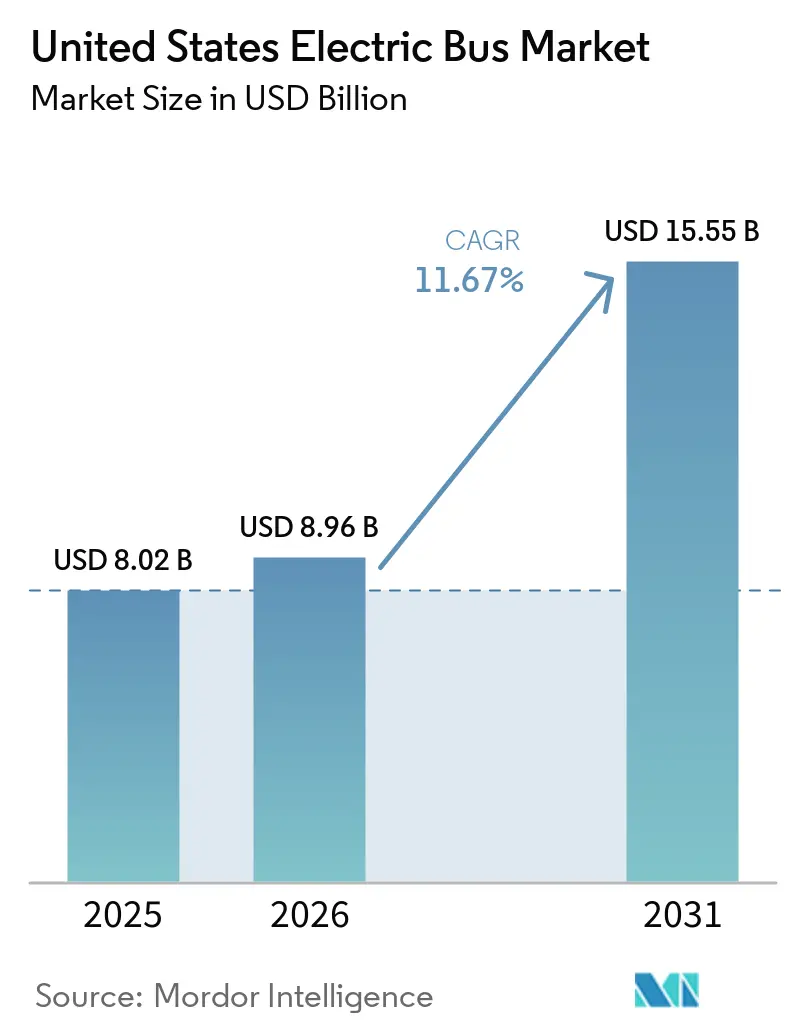
| Base Year Market Size (2025) | USD 8.02 Billion |
| Market Size (2026) | USD 8.96 Billion |
| Market Size (2031) | USD 15.55 Billion |
| Growth Rate (2026 - 2031) | 11.67% CAGR |
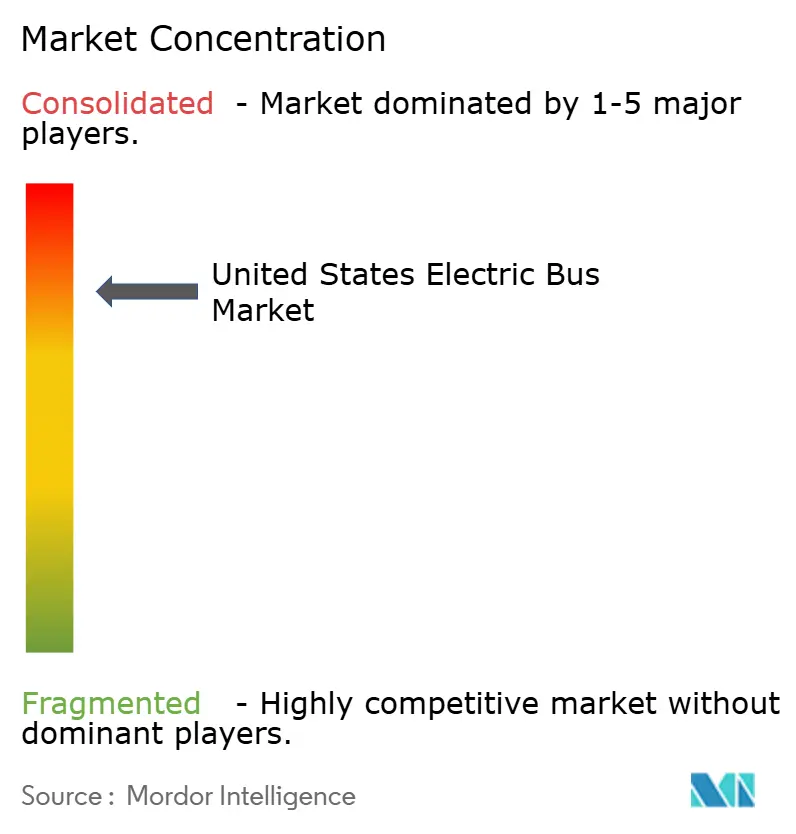
| Market Concentration | High |
Major Players
*Disclaimer: Major Players sorted in no particular order Image © Mordor Intelligence. Reuse requires attribution under CC BY 4.0. |
|
United States Electric Bus Market Analysis by Mordor Intelligence
The United States electric bus market size was valued at USD 8.02 billion in 2025 and is projected to grow from USD 8.96 billion in 2026 to USD 15.55 billion by 2031, registering a CAGR of 11.67% over the same period. Battery-electric platforms dominate current procurements because federal and state zero-emission mandates shorten the traditional 12-year diesel replacement cycle. Agencies accelerate timeline planning to capture Environmental Protection Agency (EPA) Clean School Bus and Federal Transit Administration (FTA) Low-No grants, while OEMs localize component production to satisfy Buy America rules and reduce tariff exposure. California’s Innovative Clean Transit (ICT) regulation, along with parallel policies in New York and Washington, preserves demand visibility, which encourages charging infrastructure investment. At the same time, falling lithium-iron-phosphate (LFP) battery costs, total-cost-of-ownership (TCO) parity on high-utilization routes, and emerging hydrogen refueling corridors widen the addressable base for the United States electric bus market.
Key Report Takeaways
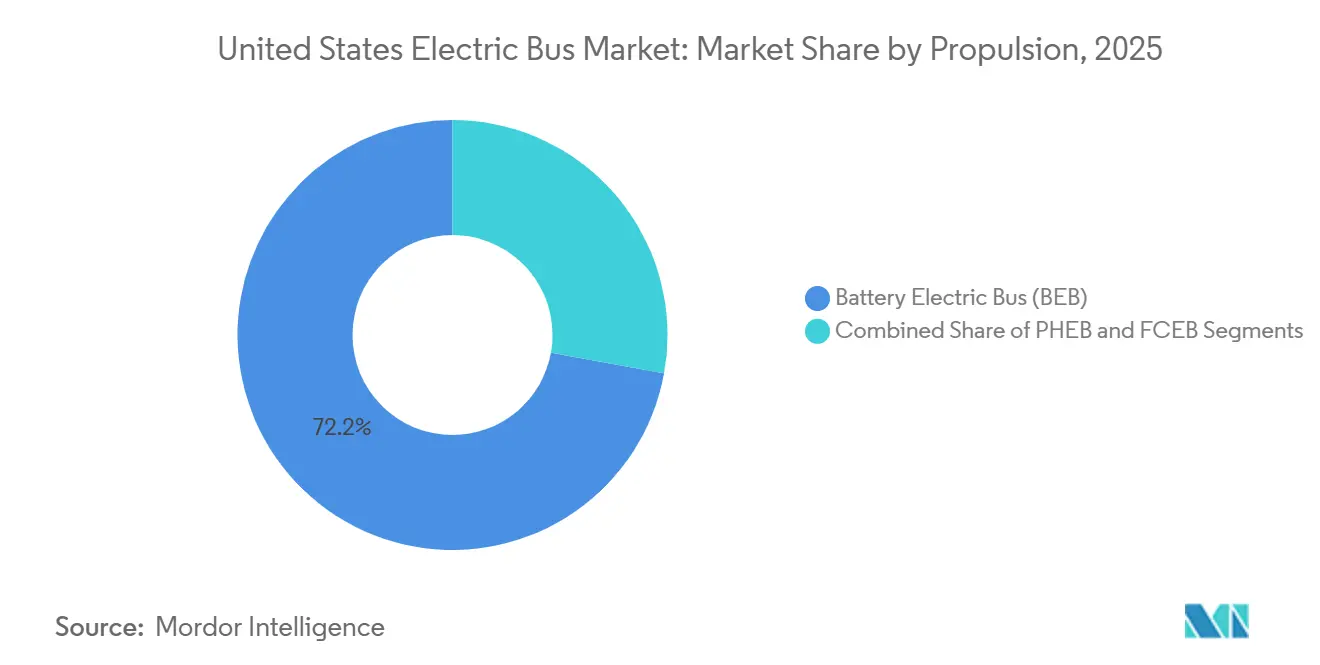
- By propulsion, battery-electric buses led the United States electric bus market with 72.16% market share in 2025; fuel-cell platforms are expected to post the fastest 24.24% CAGR through 2031.
- By application, city and transit fleets held 62.75% of the United States electric bus market size in 2025, while intercity and regional routes advance at a 16.02% CAGR to 2031.
- By battery chemistry, LFP captured the largest 59.21% share in 2025; lithium titanate grew at an 18.78% CAGR.
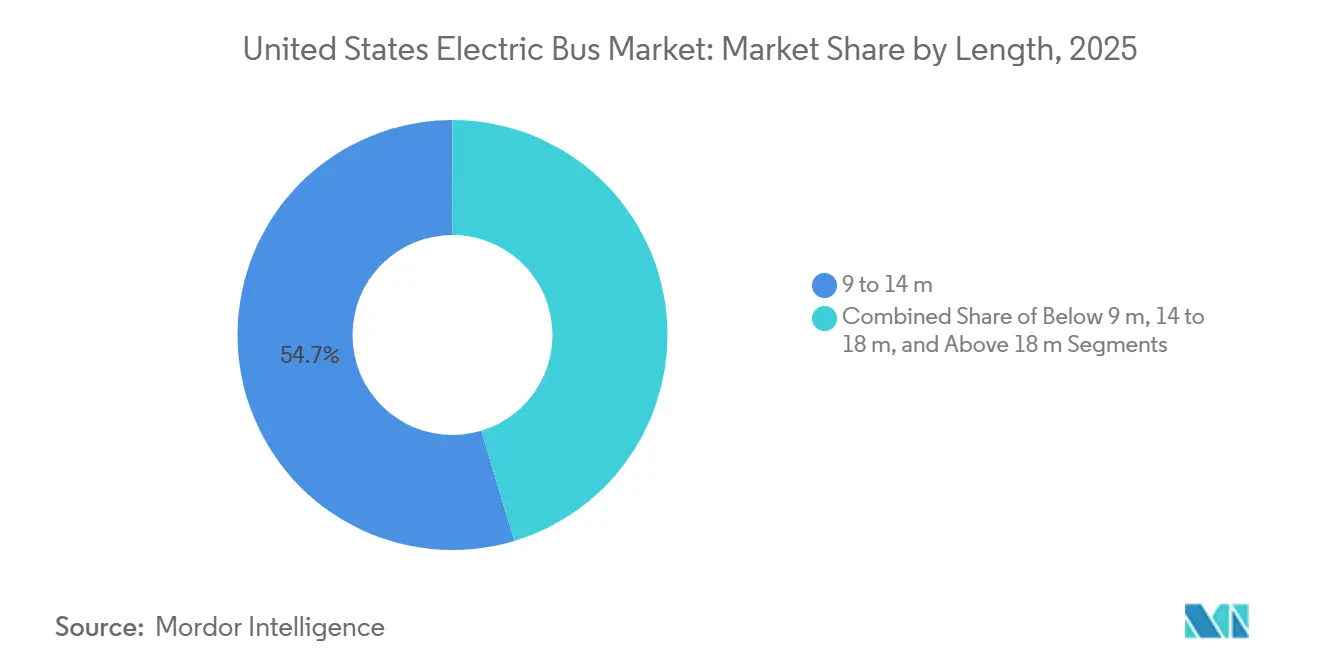
- By length, the 9-14 m segment accounted for 54.65% of the market in 2025; articulated platforms above 18 m grew at a 14.36% CAGR.
- By motor architecture, permanent-magnet synchronous units dominated with a 60.73% share in 2025 and are set to record the highest CAGR of 15.84%.
- By motor power, the 151-200 kW band held a 38.46% share in 2025; the 251-320 kW class is accelerating at a 15.61% CAGR.
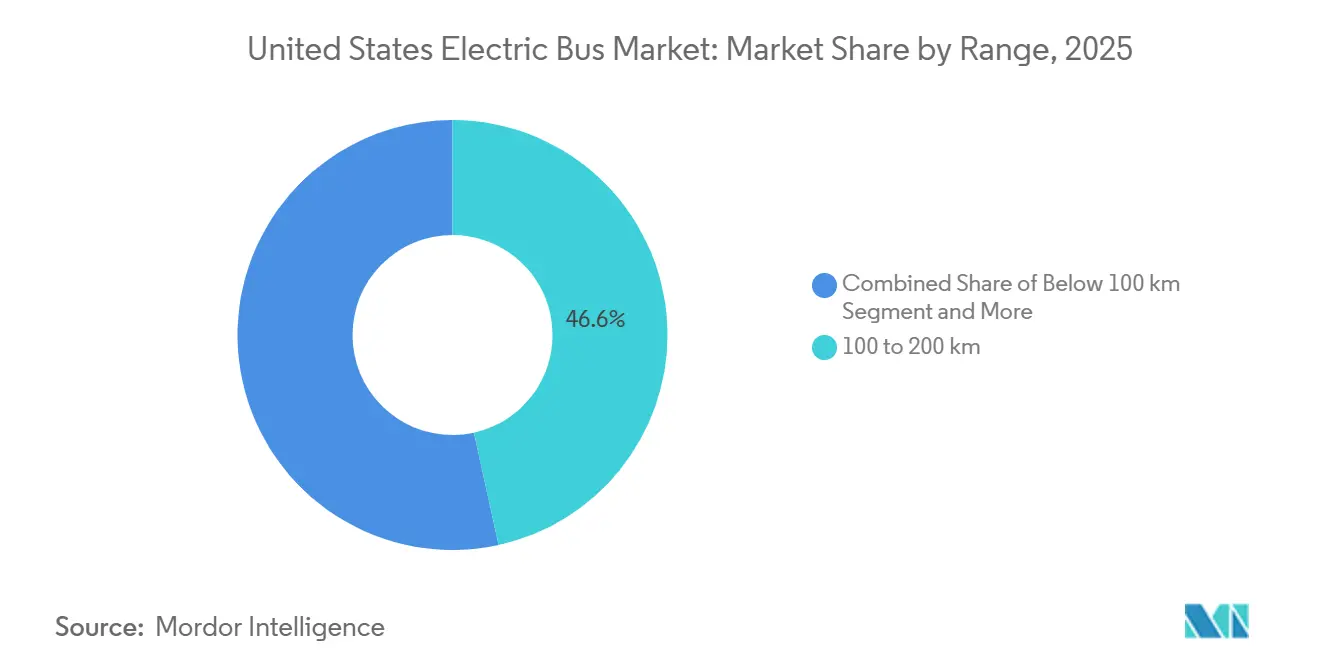
- By range, the 100-200 km band commanded 46.56% share in 2025; the 300-450 km class is set to expand at 17.46% CAGR.
- By end use, public fleets accounted for 82.99% share in 2025; private operators will register a 14.86% CAGR.
- By state, California led with 19.74% demand in 2025; its 13.38% CAGR still trails faster-growing peers such as Texas.
Note: Market size and forecast figures in this report are generated using Mordor Intelligence’s proprietary estimation framework, updated with the latest available data and insights as of 2026.
United States Electric Bus Market Trends and Insights
Drivers Impact Analysis*
| Driver | (~)% Impact on CAGR Forecast | Geographic Relevance | Impact Timeline |
|---|---|---|---|
| Federal and State Zero-Emission Mandates | +3.2% | California, New York, Washington, Massachusetts, Oregon | Medium term (2-4 years) |
| Federal Transit Electrification Funding | +2.8% | Nationwide, concentrated in metropolitan transit districts | Short term (≤ 2 years) |
| Declining Battery-Pack Prices | +2.1% | Nationwide | Medium term (2-4 years) |
| TCO Parity for City Routes by 2026 | +1.9% | Urban transit agencies in California, Texas, Illinois, New York | Short term (≤ 2 years) |
| School-Fleet Health-Driven Adoption | +1.4% | Nationwide, early concentration in California, New York, Maryland | Medium term (2-4 years) |
| Carbon-Credit Revenue Streams | +0.9% | California (LCFS), Oregon, Washington | Long term (≥ 4 years) |
| Source: Mordor Intelligence | |||


Federal and State Zero-Emission Mandates
California’s Innovative Clean Transit rule obliges large agencies to procure only zero-emission buses from the beginning of 2029, compressing traditional replacement cycles and raising demand visibility for suppliers[1]"Zero-Emission Transit Bus Requirement", U.S. Department of Energy, afdc.energy.gov. Fleet managers respond by accelerating infrastructure design so that utility upgrades, charger selection, and workforce training all proceed in parallel with vehicle tenders. New York, Washington, and Massachusetts mirror the regulatory template, giving manufacturers confidence to plan multiyear production slots instead of one-off batches. Because most rules favor domestic content, builders who localize battery packs, motors, and wiring harnesses enjoy clearer paths through Buy America certification. The cumulative effect of those mandates is a nationwide procurement wave that locks in the United States electric bus market’s growth trajectory.
Federal Transit Electrification Funding
EPA Clean School Bus rebates and FTA Low-No grants convert policy intent into signed purchase orders, particularly for agencies that lack bonding capacity[2]"All About the Clean School Bus Program", Electric School Bus Initiative, electricschoolbusinitiative.org. Grant scoring tends to reward shovel-ready infrastructure, so bidders often align bus deliveries with charger commissioning to avoid stranded assets. Suppliers increasingly bundle vehicles, depot design, and long-term maintenance in a single contract, simplifying agency oversight while guaranteeing parts availability. The promise of continued federal appropriations also reassures lenders, enabling competitive interest rates on any remaining capital outlay. Together, those financial levers reduce the risk premium that once discouraged early movers.
Declining Battery-Pack Prices
Rapid scale-up of domestic cell plants, combined with chemistry shifts toward lithium-iron-phosphate, trims the largest cost line item in an electric bus. Lower battery expense narrows the upfront gap with diesel models, freeing agency budgets for complementary items such as workforce reskilling and emergency-response training. With less capital tied up in each vehicle, fleet planners feel comfortable adopting shorter procurement cycles, which accelerates technology refresh. In parallel, local sourcing meets content rules, improving grant eligibility and insulating buyers from import tariffs. These drivers reinforce one another, deepening the economic case for wide-scale adoption.
TCO Parity for City Routes by 2026
Even before new incentives arrive, many urban agencies report operating costs that undercut legacy diesel fleets on their highest-utilization routes. Savings stem from cheaper energy, simpler drivetrains, and reduced brake wear due to regenerative systems. As workshops gather more service data, confidence grows that lifecycle expense will stay below historical norms, even when battery replacement is required mid-life. Utilities complement the trend by offering time-of-use tariffs that reward overnight charging, adding a margin of financial safety. The result is a tipping point where electrification becomes the default rather than the pilot.
Restraints Impact Analysis*
| Restraint | (~)% Impact on CAGR Forecast | Geographic Relevance | Impact Timeline |
|---|---|---|---|
| Depot Grid-Connection Delays | -1.8% | Metropolitan areas with aging utility infrastructure: New York, Los Angeles, Chicago | Short term (≤ 2 years) |
| Sparse High-Power Charging Network | -1.3% | Intercity corridors, rural transit districts | Medium term (2-4 years) |
| High Upfront FCEB Cost | -0.9% | California, select pilot programs in Texas, Ohio | Long term (≥ 4 years) |
| Limited Hydrogen Corridors | -0.7% | Outside California, Oregon, Washington | Long term (≥ 4 years) |
| Source: Mordor Intelligence | |||
Depot Grid-Connection Delays
Interconnection queues at urban utilities often exceed the construction timeline for the depot itself, forcing agencies to stage bus deliveries or lease temporary charging assets. Project managers must coordinate city permitting, utility engineering, and contractor schedules with near-surgical precision to avoid idle equipment. Staffing constraints at public-works departments add further uncertainty, especially when multiple depots in the same region pursue upgrades simultaneously. Some agencies mitigate delay risk by installing on-site battery storage that buffers peak demand, yet doing so raises capital intensity. Until utility processes speed up, grid access remains a gating item for many rollouts.
Sparse High-Power Charging Network
Long-distance routes need roadside chargers that can replenish energy during mandatory driver breaks, but national coverage remains patchy away from coastal corridors. Private truck-stop chains weigh investment carefully because bus utilization differs from freight traffic, creating uncertainty over payback. Transit agencies sometimes partner with neighboring districts to co-fund shared facilities, yet cross-jurisdiction governance can slow decision-making. Without predictable in-route charging, planners must oversize onboard batteries or restrict electric units to shorter legs, limiting flexibility. A broader network would unlock range-capable platforms far more quickly.
*Our forecasts treat driver/restraint impacts as directional, not additive. The impact forecasts reflect baseline growth, mix effects, and variable interactions.
Segment Analysis
By Propulsion: Hydrogen Platforms Edge into Long-Haul Niches
Battery-electric buses retained a 72.16% United States electric bus market share in 2025, yet fuel-cell variants are forecast to grow at a 24.24% CAGR as hydrogen stations extend beyond California. Early deployments in the South Coast Air Basin validate 300-mile duty cycles without lengthy charge dwell, appealing to mountainous or cold-weather operations. Agencies recognize that battery units cover most urban needs, but fuel-cell range and 10-minute refueling closely replicate diesel patterns, easing driver scheduling. Manufacturers localize stack assembly to meet Buy America rules, although green-hydrogen supply costs must still fall to unlock broad adoption.
Transit authorities experimenting with blended fleets see operational value in assigning battery buses to predictable urban loops and reserving fuel-cell units for express or terrain-intensive routes. As the national hydrogen-hub program channels USD 8 billion into production and logistics, the technology’s path to parity improves, but infrastructure timelines push material volume to the latter half of the forecast period. Integration of common storage and safety codes reduces permitting friction, making hydrogen a realistic lever for segment expansion in the United States electric bus market.


By Application: Intercity Demand Accelerates with Fast-Charge Corridors
City and transit fleets accounted for 62.75% of 2025 revenue, benefiting from continuous grant flows and clear legislative targets. Yet intercity and regional routes post a 16.02% CAGR because battery densities now support 300-450 km operations, and utilities co-fund roadside megawatt charging. Initial corridor build-outs between Sacramento-Reno and Dallas-Houston demonstrate timetable resilience when 30-minute top-ups align with driver breaks. School districts rapidly absorb EPA rebates, but fragmented ownership slows national scaling despite strong public health narratives.
Airports and corporate campuses deploy zero-emission shuttles to meet Scope 1 reduction pledges, serving as visible showcases that reinforce municipal policy ambitions. Coach operators remain cautious until winter-range performance and resale values stabilize, yet pilot programs with extended-pack buses suggest achievable economics on premium tourist routes. The diverse use-case mosaic sustains order backlogs, helping OEMs amortize platform investments across the United States electric bus market size spectrum.
By Battery Chemistry: LFP Holds Lead while LTO Excels in Cold Climates
Lithium-iron-phosphate batteries maintained a 59.21% United States electric bus market share in 2025, owing to thermal stability and cost advantages over nickel chemistries. Lithium-titanate’s 18.78% CAGR comes from agencies in Minnesota, Illinois, and upstate New York that prize 10-minute charge capability and robust sub-zero performance for overnight outdoor parking. Nickel-manganese-cobalt remains constrained to long-range coaches where energy density outweighs cost.
Sodium-ion and solid-state pilots continue under DOE grants, but will not affect volume before 2028. Supply-chain localization efforts bring new LFP cell plants online in the Midwest, mitigating tariff exposure and strengthening grant eligibility. Meanwhile, battery-end-of-life policies under development by the EPA encourage second-life stationary storage, lowering residual-value risk that once stymied procurements in budget-sensitive municipalities.
By Length: Articulated Models Electrify High-Capacity Corridors
Standard 40-foot buses (9-14 m) captured 54.65% 2025 share due to depot infrastructure compatibility. Articulated platforms above 18 m, growing at a 14.36% CAGR, support bus-rapid-transit lanes in Los Angeles, Seattle, and Miami, where headway reductions hinge on larger passenger counts per driver hour. Sub-9 m cutaways are being used for paratransit and rural shuttle services. However, their limited procurement volumes are slowing the development of dedicated high-voltage platforms.
Fleet managers are increasingly seeing the electrification of articulated buses as a cost-effective alternative to expanding light-rail systems. Overnight depot charging is a major advantage, as it avoids the high costs of installing catenary systems. However, the use of larger battery packs and dual-axle motors comes with its own challenges. These require stricter maintenance routines and extensive fleet-wide training. To address these issues, agencies are spreading out deliveries over several budget cycles to ensure a smoother transition.
By Motor Architecture: PMSM Efficiency Prevails
Permanent-magnet synchronous motors commanded the largest share at 60.73% in 2025, reflecting operator preference for torque-rich drivetrains that suit stop-and-go duty cycles. Their efficiency gains translate into smaller battery packs or extended range, which in turn reduces total vehicle weight and floor loading. Induction alternatives retain a niche among agencies that prioritize rare-earth independence over peak efficiency, often pairing the design with chemistry choices that already lean toward lower cost. Switched-reluctance concepts remain experimental due to acoustic noise challenges that compromise passenger comfort. Looking ahead, permanent-magnet systems are forecast to log the fastest 15.84% CAGR as supply-chain localization eases material-sourcing worries.
Adoption patterns also hinge on service ecosystems. OEMs with established parts depots and technician-training programs gain an edge, as fleets prefer seamless warranty coverage across multiple motor variants. Transit authorities weigh long-term maintenance agreements more heavily than marginal upfront savings, further locking in the dominant design. Policy makers watching rare-earth geopolitics encourage diversification but stop short of prescribing motor types, leaving technology choice largely market-driven. That flexibility keeps competition active without derailing the premium placed on reliability.
By Motor Power: Higher Ratings Target Challenging Routes
The 151-200 kW band held the top market share at 38.46% in 2025, providing a balanced power envelope for standard 40-foot buses on mixed-terrain urban loops. Agencies upgrading articulated or hill-climb services gravitate toward the 251-320 kW class, which records the segment’s fastest 15.61% CAGR. Those higher-output drivetrains give schedulers confidence that zero-emission units will match diesel timetables in demanding conditions. Lower-power configurations survive mainly in shuttle or paratransit niches where passenger loads stay light, and depot space is limited.
Training requirements grow alongside motor output, as drivers must adapt to quicker acceleration curves and regenerative braking profiles. Maintenance teams similarly fine-tune cooling strategies to preserve motor life under sustained load. Financing bodies view power ratings as a proxy for duty-cycle risk and occasionally adjust lease terms if operators exceed design limits. Combined, those considerations push agencies toward thorough route modeling before specifying motor class. Selecting the right rating thus becomes an exercise in long-range cost control as much as an engineering choice.
By Range: Corridor-Ready Platforms Gain Momentum
Buses offering real-world range within the 100-200 km band constituted the largest 46.56% share in 2025, easily covering typical urban blocks with overnight depot charging. Yet models in the 300-450 km category record the fastest 17.46% CAGR, as they unlock intercity opportunities that previously defaulted to diesel. Transit boards appreciate the operational latitude to combine suburban feeder lines and longer express runs under one technology umbrella. OEMs respond by refining energy-management software that maximizes recuperation without eroding battery health. Simultaneously, utilities pilot corridor charging to make mid-day top-ups feasible, further boosting confidence in extended-range offerings.
Cold-weather performance remains a planning variable, with some agencies allocating auxiliary heaters or surplus capacity as insurance. Differences in local topography also influence preferred range brackets, demonstrating that one size does not fit all. Because public funding rarely covers excess specification, fleets must forecast route stability over the bus’s service life. Suppliers that combine data-analytics support with vehicles gain influence in these debates, nudging purchasers toward optimal, not merely maximal, range selections.
By End Use: Public Fleets Anchor Volume Growth
Public operators captured the majority share at 82.99% in 2025, buoyed by regulatory deadlines and direct access to federal grants. Their long budget cycles align well with OEM order books, letting factories level-load production and negotiate favorable raw-material contracts. Private buyers, airport shuttles, tech campuses, and event venues adopt faster decision processes but account for smaller volumes, so they often turn to leasing to minimize balance-sheet impact. Despite that size gap, private fleets chart the fastest 14.86% CAGR to 2031 as corporate sustainability targets harden. Success here encourages manufacturers to tailor service packages that compensate for limited in-house engineering.
Public-sector dominance shapes specification norms, as municipal procurement templates set baseline requirements that ripple outward to smaller buyers. Training curricula, safety standards, and warranty expectations all trace back to experiences gathered in large city systems. Yet private actors act as proving grounds for emerging features such as wireless opportunity charging and advanced driver-assistance modules. Insights from those deployments then circle back into the next wave of public tenders, sustaining a virtuous feedback loop across customer types.
Geography Analysis
California continues to lead national demand, capturing 19.74% share in 2025 on the strength of codified zero-emission purchase mandates and a mature incentive stack that lowers total ownership costs. The state is also projected to post the fastest CAGR of 13.38% to 2031. Agencies within the state have already navigated the steepest parts of the learning curve, creating a reservoir of best practices that neighboring regions eagerly adopt. Although grid-connection delays still loom, collaborative programs between transit districts and utilities gradually compress interconnection timelines. The sustained order cadence offers OEMs predictable revenue, enabling forward investments in local supply chains and technician training.
In the Northeast, New York, Massachusetts, and Washington, D.C., align fleet roadmaps with climate legislation, generating a high concentration of depot retrofits clustered around dense urban cores. Policymakers there leverage carbon-credit frameworks to ease operational budgets, elevating political support for further rollouts. Utilities introduce off-peak tariffs to tame demand spikes, making overnight charging financially attractive even in premium electricity markets. That establishment gives city councils latitude to accelerate electrification without fare hikes. Success in these corridors then serves as a proof point for suburban and rural districts still on the fence.
Sunbelt states such as Texas and Florida emerge as fast followers, relying on lower average electricity prices and abundant renewable generation to hit TCO parity sooner than cold-weather peers. Absent state-level mandates, municipal agencies pivot toward federal grants and public-private partnerships to seed initial depots. Supplier interest rises in parallel, because localized production mitigates logistics costs tied to long-haul transport of heavy battery packs. Climatic advantages further reduce range anxiety, allowing smaller batteries that preserve passenger capacity. Together, these factors position the region as the next growth frontier once policy clarity improves.
Competitive Landscape
The United States Electric Bus market is highly concentrated, with five veteran manufacturers accounting for the lion’s share. Established brands lean on expansive dealer networks and field-service teams that reassure procurement boards wary of downtime. Vertical integration, especially battery-module assembly and drivetrain manufacturing, offers cost control and smoother compliance with domestic-content rules. Recent corporate restructurings, including the transfer of Proterra assets, underscore the segment's capital intensity and remind newcomers that scale matters. Nevertheless, niche players that specialize in school or shuttle formats carve out defensible market positions by staying agile and customer-centric.
Strategic alliances shape competitive dynamics. Builders increasingly partner with utilities for turnkey depot solutions, bundling vehicle supply with charging hardware and energy-management software. Such comprehensive offerings lower friction for transit agencies, effectively shifting project-management burden onto vendors and deepening customer relationships. At the same time, component suppliers invest in U.S. production to shield OEMs from geopolitical risk tied to imported batteries and rare-earth magnets. Those moves resonate with grant evaluators, who favor high domestic-content ratios when allocating funds.
Innovation cycles remain brisk. Wireless charging pilots, modular battery swapping, and advanced driver-assistance packages quickly progress from demonstration to limited commercial release. Smaller firms often pioneer these features, using speed as a differentiator before incumbents scale them. Meanwhile, public tenders increasingly weight lifecycle support over headline technology, pushing all competitors to bolster aftermarket capabilities. The combined effect fosters a market where technological novelty and operational reliability must advance in tandem, rewarding players that balance both.
United States Electric Bus Industry Leaders
-
BYD Auto Co. Ltd.
-
GILLIG LLC
-
Blue Bird Corp.
-
New Flyer of America
-
Phoenix Motorcars
- *Disclaimer: Major Players sorted in no particular order

Recent Industry Developments
- June 2026: Highland Electric Fleets secured USD 75 million from Galvanize, raising total commitments to USD 150 million to expand electric school buses and municipal fleet operations.
- February 2026: Washington Metropolitan Area Transit Authority exercised options for 100 New Flyer heavy-duty buses, including 25 battery-electric Xcelsior CHARGE NG units.
- October 2025: Thomas Built Buses introduced the Saf-T-Liner eHDX2 Wattson, its first electric Type D school bus.


United States Electric Bus Market Report Scope
The United States Electric Bus market is analyzed across multiple segmentation dimensions to provide comprehensive market intelligence. By Propulsion, the market is segmented into Battery Electric, Plug-in Hybrid, and Fuel Cell Electric. By Application, the market is segmented into City/Transit, Intercity / Regional, Coach / Tourist, School Bus, Airport, and Others. By Battery Chemistry, the market is segmented into Lithium Iron Phosphate (LFP), NMC/NCA, Lithium Titanate (LTO), and Others (Solid State/Sodium-ion). By Length, the market is segmented into below 9 m, 9 to 14 m, 14 to 18 m, and above 18 m. By Motor Architecture, the market is segmented into Permanent Magnet Synchronous, Induction / Asynchronous, Switched Reluctance, and Others. By Motor Power (kW), the market is segmented into Below 100, 100 to 150, 151 to 200, 201 to 250, 251 to 320, and Above 320. By Range (km), the market is segmented into below 100, 100 to 200, 201 to 300, 300 to 450, and above 450. By End Use, the market is segmented into Public and Private. By State, the market is segmented into all 50 U.S. states, including California, New York, Florida, Texas, and Washington, among others.
Market forecasts are provided in terms of Value (USD) and Volume (Units).
By Propulsion
| Battery Electric Bus (BEB) |
| Plug-in Hybrid Electric Bus (PHEB) |
| Fuel Cell Electric Bus (FCEB) |
By Application
| City/Transit |
| Intercity/Regional |
| Coach/Tourist |
| School Bus |
| Airport |
| Others |
By Battery Chemistry
| Lithium Iron Phosphate (LFP) |
| NMC/NCA |
| Lithium Titanate (LTO) |
| Others (Sodium-ion, pilots) |
By Length
| Below 9 m |
| 9 to 14 m |
| 14 to 18 m |
| Above 18 m |
By Motor Architecture
| Permanent Magnet Synchronous Motor (PMSM) |
| Induction/Asynchronous AC |
| Switched Reluctance Motor (SRM) |
| Others |
By Motor Power
| Below 100 kW |
| 100 to 150 kW |
| 151 to 200 kW |
| 201 to 250 kW |
| 251 to 320 kW |
| Above 320 kW |
By Range
| Below 100 km |
| 100 to 200 km |
| 201 to 300 km |
| 300 to 450 km |
| Above 450 km |
By End Use
| Public |
| Private |
By State
| Alabama |
| Alaska |
| Arizona |
| Arkansas |
| California |
| Colorado |
| Connecticut |
| Delaware |
| Florida |
| Georgia |
| Hawaii |
| Idaho |
| Illinois |
| Indiana |
| Iowa |
| Kansas |
| Kentucky |
| Louisiana |
| Maine |
| Maryland |
| Massachusetts |
| Michigan |
| Minnesota |
| Mississippi |
| Missouri |
| Montana |
| Nebraska |
| Nevada |
| New Hampshire |
| New Jersey |
| New Mexico |
| New York |
| North Carolina |
| North Dakota |
| Ohio |
| Oklahoma |
| Oregon |
| Pennsylvania |
| Rhode Island |
| South Carolina |
| South Dakota |
| Tennessee |
| Texas |
| Utah |
| Vermont |
| Virginia |
| Washington |
| West Virginia |
| Wisconsin |
| Wyoming |
| By Propulsion | Battery Electric Bus (BEB) |
| Plug-in Hybrid Electric Bus (PHEB) | |
| Fuel Cell Electric Bus (FCEB) | |
| By Application | City/Transit |
| Intercity/Regional | |
| Coach/Tourist | |
| School Bus | |
| Airport | |
| Others | |
| By Battery Chemistry | Lithium Iron Phosphate (LFP) |
| NMC/NCA | |
| Lithium Titanate (LTO) | |
| Others (Sodium-ion, pilots) | |
| By Length | Below 9 m |
| 9 to 14 m | |
| 14 to 18 m | |
| Above 18 m | |
| By Motor Architecture | Permanent Magnet Synchronous Motor (PMSM) |
| Induction/Asynchronous AC | |
| Switched Reluctance Motor (SRM) | |
| Others | |
| By Motor Power | Below 100 kW |
| 100 to 150 kW | |
| 151 to 200 kW | |
| 201 to 250 kW | |
| 251 to 320 kW | |
| Above 320 kW | |
| By Range | Below 100 km |
| 100 to 200 km | |
| 201 to 300 km | |
| 300 to 450 km | |
| Above 450 km | |
| By End Use | Public |
| Private | |
| By State | Alabama |
| Alaska | |
| Arizona | |
| Arkansas | |
| California | |
| Colorado | |
| Connecticut | |
| Delaware | |
| Florida | |
| Georgia | |
| Hawaii | |
| Idaho | |
| Illinois | |
| Indiana | |
| Iowa | |
| Kansas | |
| Kentucky | |
| Louisiana | |
| Maine | |
| Maryland | |
| Massachusetts | |
| Michigan | |
| Minnesota | |
| Mississippi | |
| Missouri | |
| Montana | |
| Nebraska | |
| Nevada | |
| New Hampshire | |
| New Jersey | |
| New Mexico | |
| New York | |
| North Carolina | |
| North Dakota | |
| Ohio | |
| Oklahoma | |
| Oregon | |
| Pennsylvania | |
| Rhode Island | |
| South Carolina | |
| South Dakota | |
| Tennessee | |
| Texas | |
| Utah | |
| Vermont | |
| Virginia | |
| Washington | |
| West Virginia | |
| Wisconsin | |
| Wyoming |


Market Definition
- Vehicle Type - The category includes Medium and Heavy Duty Buses.
- Vehicle Body Type - This include Bus category.
- Fuel Category - The category exclusively covers electric propulsion systems, including various types such as HEV (Hybrid Electric Vehicles), PHEV (Plug-in Hybrid Electric Vehicles), BEV (Battery Electric Vehicles), and FCEV (Fuel Cell Electric Vehicles).
| Keyword | Definition |
|---|---|
| Electric Vehicle (EV) | A vehicle which uses one or more electric motors for propulsion. Includes cars, buses, and trucks. This term includes all-electric vehicles or battery electric vehicles and plug-in hybrid electric vehicles. |
| BEV | A BEV relies completely on a battery and a motor for propulsion. The battery in the vehicle must be charged by plugging it into an outlet or public charging station. BEVs do not have an ICE and hence are pollution-free. They have a low cost of operation and reduced engine noise as compared to conventional fuel engines. However, they have a shorter range and higher prices than their equivalent gasoline models. |
| PEV | A plug-in electric vehicle is an electric vehicle that can be externally charged and generally includes all-electric vehicles as well as plug-in hybrids. |
| Plug-in Hybrid EV | A vehicle that can be powered either by an ICE or an electric motor. In contrast to normal hybrid EVs, they can be charged externally. |
| Internal combustion engine | An engine in which the burning of fuels occurs in a confined space called a combustion chamber. Usually run with gasoline/petrol or diesel. |
| Hybrid EV | A vehicle powered by an ICE in combination with one or more electric motors that use energy stored in batteries. These are continually recharged with power from the ICE and regenerative braking. |
| Commercial Vehicles | Commercial vehicles are motorized road vehicles designed for transporting people or goods. The category includes light commercial vehicles (LCVs) and medium and heavy-duty vehicles (M&HCV). |
| Passenger Vehicles | Passenger cars are electric motor– or engine-driven vehicles with at least four wheels. These vehicles are used for the transport of passengers and comprise no more than eight seats in addition to the driver’s seat. |
| Light Commercial Vehicles | Commercial vehicles that weigh less than 6,000 lb (Class 1) and in the range of 6,001–10,000 lb (Class 2) are covered under this category. |
| M&HDT | Commercial vehicles that weigh in the range of 10,001–14,000 lb (Class 3), 14,001–16,000 lb (Class 4), 16,001–19,500 lb (Class 5), 19,501–26,000 lb (Class 6), 26,001–33,000 lb (Class 7) and above 33,001 lb (Class 8) are covered under this category. |
| Bus | A mode of transportation that typically refers to a large vehicle designed to carry passengers over long distances. This includes transit bus, school bus, shuttle bus, and trolleybuses. |
| Diesel | It includes vehicles that use diesel as their primary fuel. A diesel engine vehicle have a compression-ignited injection system rather than the spark-ignited system used by most gasoline vehicles. In such vehicles, fuel is injected into the combustion chamber and ignited by the high temperature achieved when gas is greatly compressed. |
| Gasoline | It includes vehicles that use gas/petrol as their primary fuel. A gasoline car typically uses a spark-ignited internal combustion engine. In such vehicles, fuel is injected into either the intake manifold or the combustion chamber, where it is combined with air, and the air/fuel mixture is ignited by the spark from a spark plug. |
| LPG | It includes vehicles that use LPG as their primary fuel. Both dedicated and bi-fuel LPG vehicles are considered under the scope of the study. |
| CNG | It includes vehicles that use CNG as their primary fuel. These are vehicles that operate like gasoline-powered vehicles with spark-ignited internal combustion engines. |
| HEV | All the electric vehicles that use batteries and an internal combustion engine (ICE) as their primary source for propulsion are considered under this category. HEVs generally use a diesel-electric powertrain and are also known as hybrid diesel-electric vehicles. An HEV converts the vehicle momentum (kinetic energy) into electricity that recharges the battery when the vehicle slows down or stops. The battery of HEV cannot be charged using plug-in devices. |
| PHEV | PHEVs are powered by a battery as well as an ICE. The battery can be charged through either regenerative breaking using the ICE or by plugging into some external charging source. PHEVs have a better range than BEVs but are comparatively less eco-friendly. |
| Hatchback | These are compact-sized cars with a hatch-type door provided at the rear end. |
| Sedan | These are usually two- or four-door passenger cars, with a separate area provided at the rear end for luggage. |
| SUV | Popularly known as SUVs, these cars come with four-wheel drive, and usually have high ground clearance. These cars can also be used as off-road vehicles. |
| MPV | These are multi-purpose vehicles (also called minivans) designed to carry a larger number of passengers. They carry between five and seven people and have room for luggage too. They are usually taller than the average family saloon car, to provide greater headroom and ease of access, and they are usually front-wheel drive. |


Research Methodology
Mordor Intelligence follows a four-step methodology in all its reports.
- Step-1: Identify Key Variables: To build a robust forecasting methodology, the variables and factors identified in Step-1 are tested against available historical market numbers. Through an iterative process, the variables required for market forecast are set and the model is built based on these variables.
- Step-2: Build a Market Model: Market-size estimations for the historical and forecast years have been provided in revenue and volume terms. Market revenue is calculated by multiplying the sales volume with their respective average selling price (ASP). While estimating ASP factors like average inflation, market demand shift, manufacturing cost, technological advancement, and varying consumer preference, among others have been taken into account.
- Step-3: Validate and Finalize: In this important step, all market numbers, variables, and analyst calls are validated through an extensive network of primary research experts from the market studied. The respondents are selected across levels and functions to generate a holistic picture of the market studied.
- Step-4: Research Outputs: Syndicated Reports, Custom Consulting Assignments, Databases & Subscription Platforms.


