Intercity Bus Travel Market Size and Share
Market Overview
| Study Period | 2020 - 2031 |
|---|---|
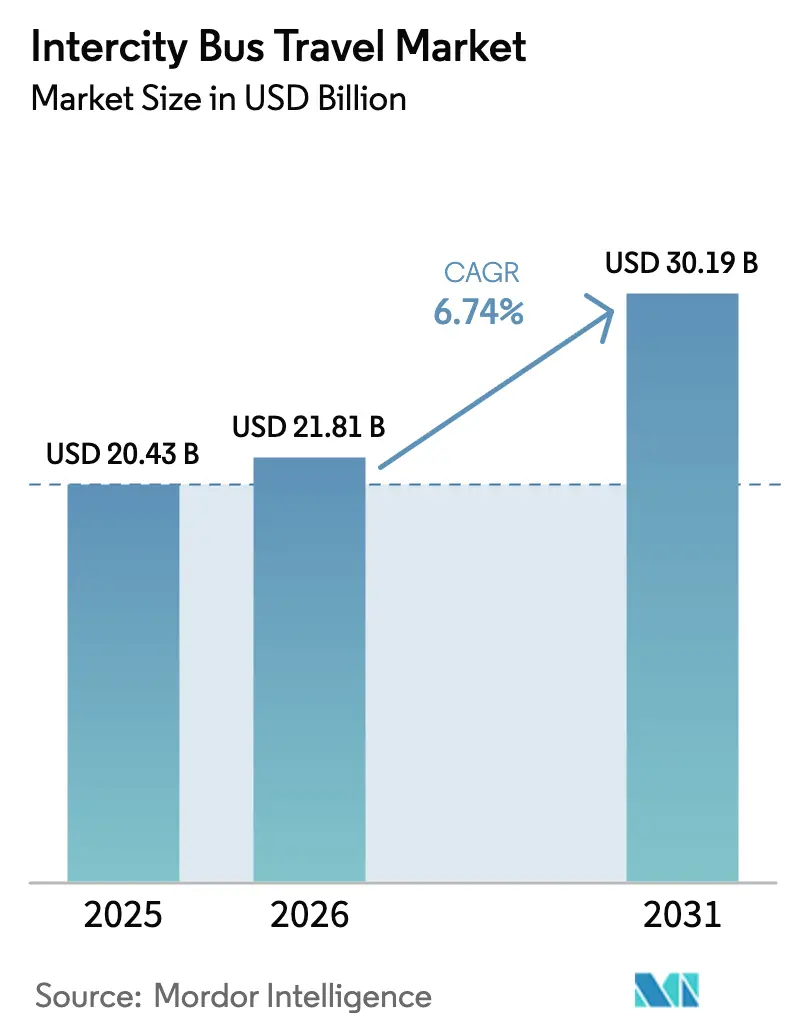
| Market Size (2026) | USD 21.81 Billion |
| Market Size (2031) | USD 30.19 Billion |
| Growth Rate (2026 - 2031) | 6.74% CAGR |
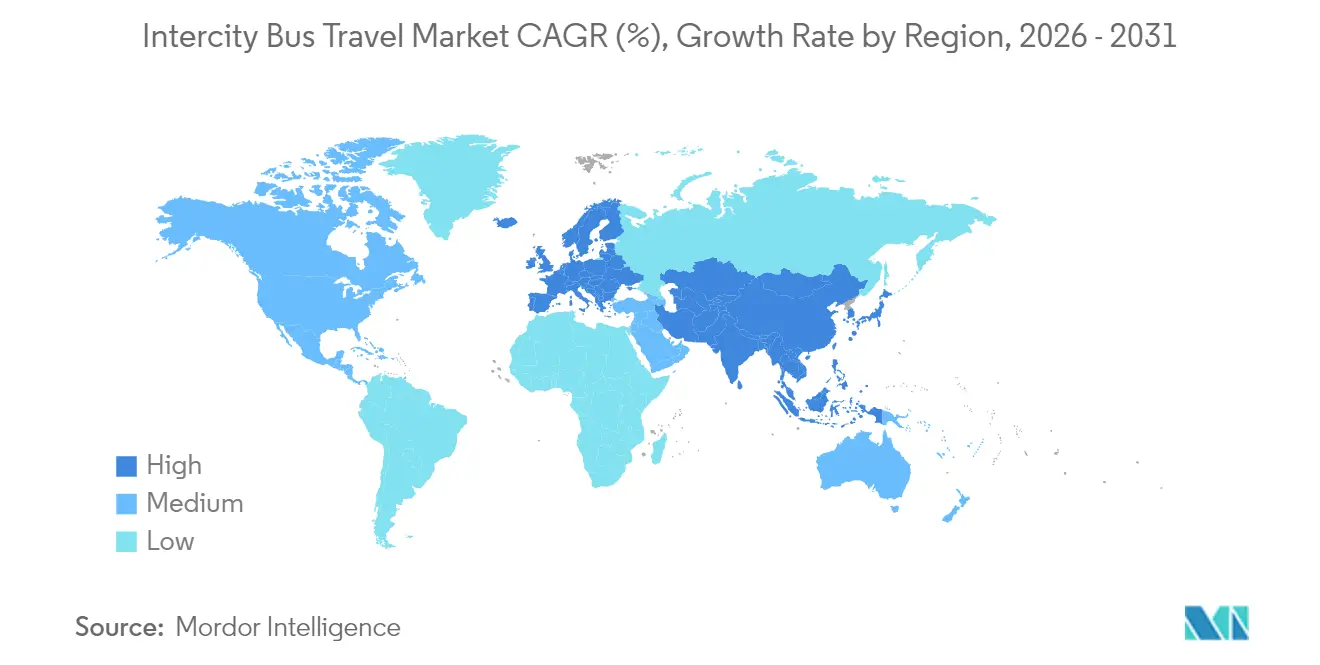
| Fastest Growing Market | Europe |
| Largest Market | Asia Pacific |
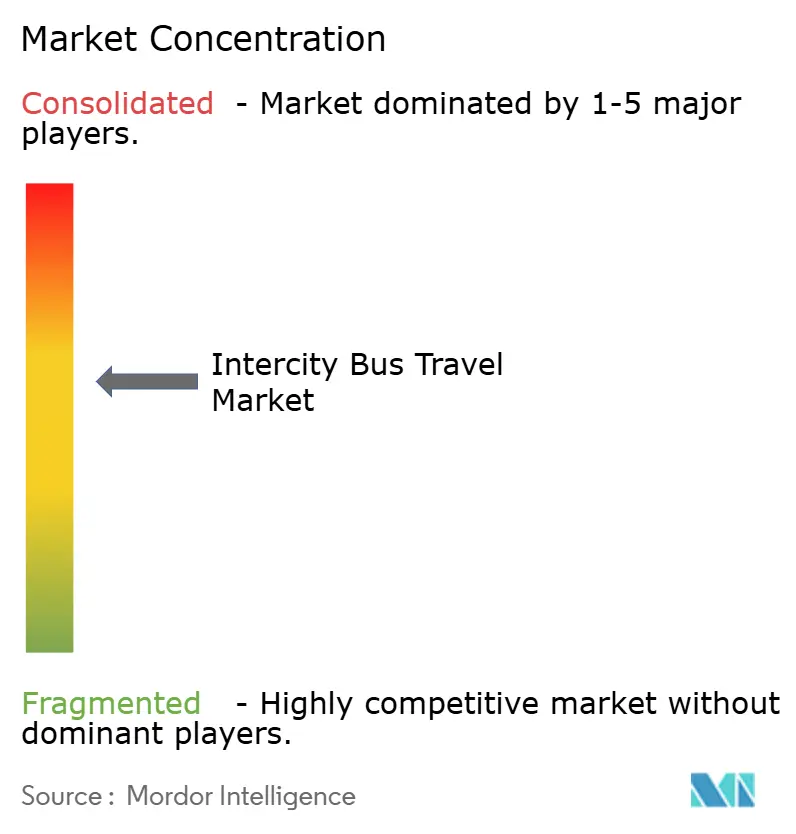
| Market Concentration | Medium |
Major Players
*Disclaimer: Major Players sorted in no particular order Image © Mordor Intelligence. Reuse requires attribution under CC BY 4.0. |
|
Intercity Bus Travel Market Analysis by Mordor Intelligence
The intercity bus travel market size in 2026 is estimated at USD 21.81 billion, growing from 2025 value of USD 20.43 billion with 2031 projections showing USD 30.19 billion, growing at 6.74% CAGR over 2026-2031. These figures underscore the sector’s endurance as shifting travel preferences, large-scale infrastructure funding, and supportive policies collectively strengthen long-distance coach services within wider sustainable mobility plans [1]U.S. Department of Transportation, “Budget Highlights Fiscal Year 2025,” dot.gov. Demographic change, notably the growth of price-sensitive millennials, continues to push ridership higher. At the same time, digital booking tools, dynamic pricing, and real-time fleet analytics are helping operators maintain load factors and margins. Governments are channeling record capital into rural connectivity and zero-emission fleets, while premium coach designs are widening revenue opportunities by appealing to business travelers who want onboard productivity features. Regional performance is varied: Asia-Pacific remains revenue leader, but Europe is expanding fastest due to stringent CO₂ limits that accelerate urban-to-intercity electrification [2]Alternative Fuels Observatory, “Heavy-Duty CO2 Regulation Dashboard,” ec.europa.eu.
Key Report Takeaways
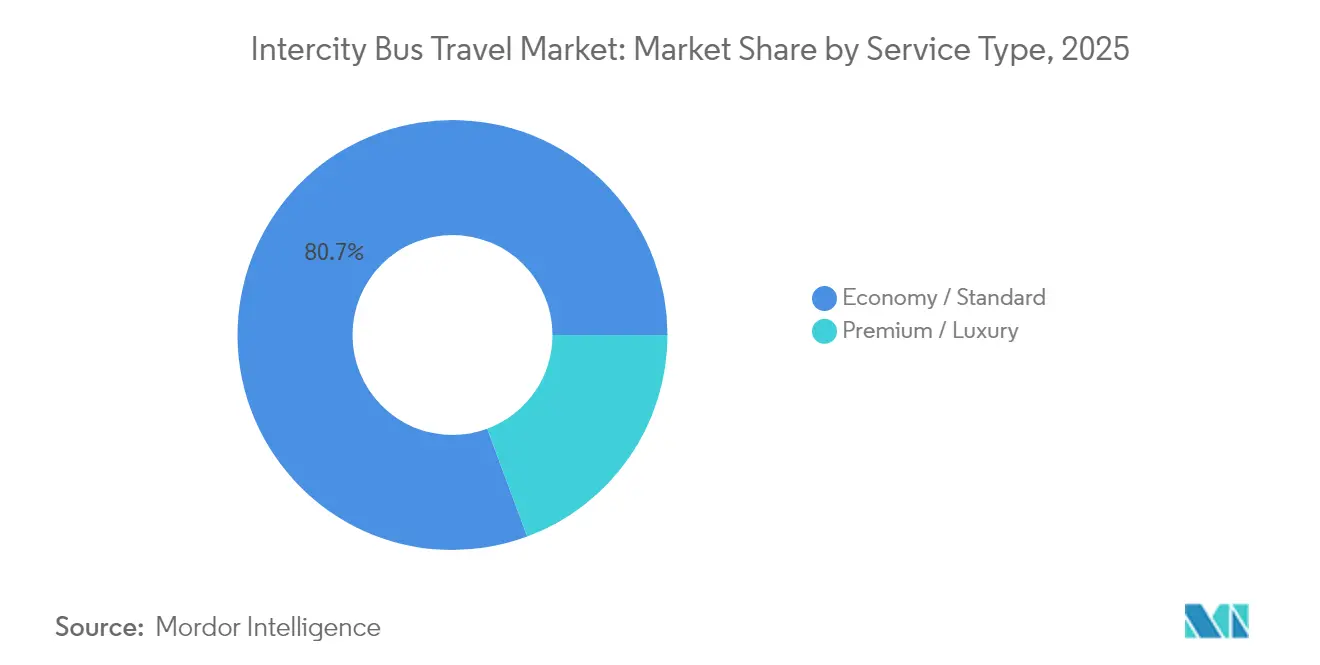
- By service type, economy/standard buses held 80.65% of intercity bus travel market share in 2025 while premium/luxury is projected to grow at 9.89% CAGR through 2031.
- By booking channel, offline counter and agency sales commanded 52.68% share of the intercity bus travel market size in 2025, yet online aggregators and OTAs are set to post the highest 10.38% CAGR to 2031.
- By propulsion type, diesel coaches accounted for 73.92% of the intercity bus travel market size in 2025; battery-electric buses are expected to expand at a leading 12.43% CAGR between 2026-2031.
- By bus type, single-deck models delivered 78.22% revenue share in 2025, whereas luxury configurations are pacing a 9.01% CAGR to 2031.
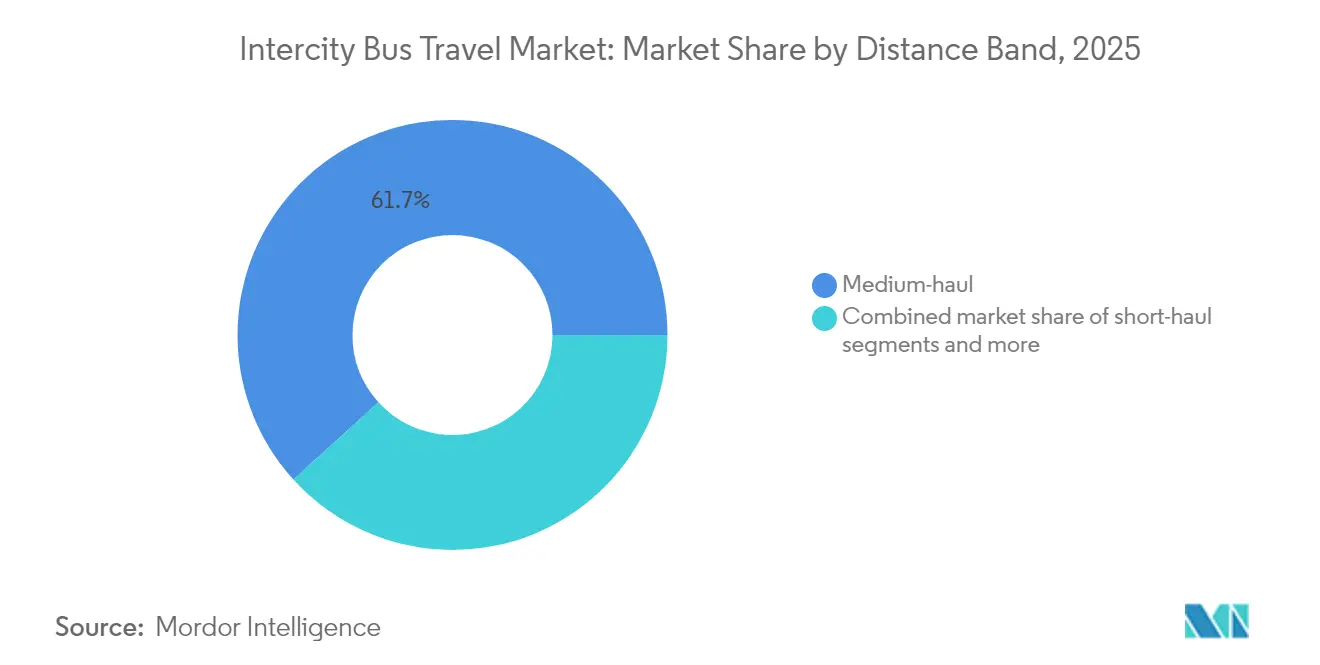
- By distance band, medium-haul services (200-400 km) retained 61.74% of the intercity bus travel market size in 2025; long-haul routes above 400 km are anticipated to advance at 8.41% CAGR by 2031.
- By end-user, leisure and VFR travelers represented 39.58% of total revenue in 2025, while the business traveler segment is on track for a robust 9.05% CAGR through 2031.
- By region, Asia-Pacific commanded 32.25% revenue share in 2025; Europe is projected to register the fastest 9.73% CAGR over the forecast horizon.
- The top five brands—Flix (including Greyhound), National Express, Stagecoach, ALSA, and BlaBlaCar Bus—hold the lion’s share, leveraging extensive fleets, robust digital ecosystems, and pan-regional licenses.
Note: Market size and forecast figures in this report are generated using Mordor Intelligence’s proprietary estimation framework, updated with the latest available data and insights as of 2026.
Global Intercity Bus Travel Market Trends and Insights
Drivers Impact Analysis*
| Driver | (~) % Impact on CAGR Forecast | Geographic Relevance | Impact Timeline |
|---|---|---|---|
| Rising intercity demand from price-sensitive millennials | +1.2% | Global, with concentration in North America & APAC | Medium term (2-4 years) |
| Government investment in rural & underserved corridor connectivity | +0.8% | North America & Europe, expanding to emerging markets | Long term (≥ 4 years) |
| Rapid shift to digital ticketing & dynamic pricing algorithms | +0.9% | Global, led by APAC and Europe | Short term (≤ 2 years) |
| Growing adoption of electric & CNG coaches for ESG mandates | +0.6% | Europe & China core, spillover to North America | Medium term (2-4 years) |
| Premium-class "business-express" services expanding yields | +0.7% | North America & Europe, selective APAC markets | Medium term (2-4 years) |
| Smart-city integration of bus + rail through Mobility-as-a-Service | +0.5% | Europe & select North American cities | Long term (≥ 4 years) |
| Source: Mordor Intelligence | |||
Rising Intercity Demand from Price-Sensitive Millennials
Millennials and young professionals are choosing coaches for budget-friendly domestic travel, illustrated by FlixBus reporting a 7.5% year-over-year ridership jump on popular U.S. city pairs [3]FlixBus, “Summer 2025 Ridership Update,” flixbus.com. A 2025 Deloitte study found 53% of U.S. holidaymakers planning cost-conscious trips, with buses preferred for journeys under 400 km where price advantages over air and rail are clearest. Wi-Fi and power outlets transform standard coaches into mobile workspaces, enhancing appeal. Solo-traveler growth strengthens mid-week seat occupancy, helping firms fine-tune dynamic pricing. Combined, these factors make millennials the pivotal demand cohort over the next four years.
Government Investment in Rural & Underserved Corridor Connectivity
The U.S. Federal Transit Administration requested USD 16.8 billion for FY 2025, part of which bolsters rural bus links. Washington State earned nearly USD 6 billion for 2025-2027 transit agency support centered on electric buses. Similar policies in Europe underpin inclusive access targets. These funds unlock new city-pair launches, yet operators face re-authorization risk post-2026, compelling them to blend public grants with commercial revenue to sustain thin routes.
Rapid Shift to Digital Ticketing & Dynamic Pricing Algorithms
RedBus’s Primo program in India now connects 4,500 private operators plus 26 state road transport corporations, using cloud-based platforms that lift occupancy by 5-7% Globally, online aggregators are the quickest-growing booking path at 10.57% CAGR, owing to instant fare comparison and loyalty wallets. Algorithmic pricing reacts to real-time searches and competitor moves, boosting yield while keeping load factors above 70%. Digital uptake is fastest in APAC and Europe, where smartphone penetration tops 85%.
Growing Adoption of Electric & CNG Coaches for ESG Mandates
Europe counted 200 intercity e-bus registrations in 2024, a modest base yet signaling rapid acceleration alongside municipal fleets. China already electrified 77% of its total bus inventory by 2022. India sets a target of 30% electric bus sales by 2030, envisaging INR 3 lakh crore (USD 37.8 billion) investment in charging and vehicles Fleet owners welcome lower fuel and maintenance costs, though dwell-time during charging remains a route-planning constraint.
Restraints Impact Analysis*
| Restraint | (~) % Impact on CAGR Forecast | Geographic Relevance | Impact Timeline |
|---|---|---|---|
| Airline & rideshare price wars on < 400 km corridors | -0.4% | Global, particularly North America & Europe | Short term (≤ 2 years) |
| Driver shortages and new overtime-wage legislation | -0.3% | North America & Europe, emerging in APAC | Medium term (2-4 years) |
| Station closures & curbside congestion in urban cores | -0.2% | North America & Europe urban centers | Medium term (2-4 years) |
| Long vehicle-charging dwell times on electrified fleets | -0.3% | Europe & China core, expanding to North America | Short term (≤ 2 years) |
| Source: Mordor Intelligence | |||
Airline & Rideshare Price Wars on < 400 km Corridors
Low-cost carriers are deploying small-gauge jets on regional sectors while rideshare firms offer intercity pooling, pressuring bus fares most intensely on dense North American and Western European routes. Chinese research shows bus firms counter high-speed rail by cutting prices and adding frequencies, illustrating the sector’s typical response cycle. Maintaining profitability amid discounting requires differentiation via frequency, onboard features, and integrated portals.
Driver Shortages and New Overtime-Wage Legislation
Transport for NSW recently announced 950 job cuts to manage wage pressures, highlighting a broader talent crunch. Stagecoach Southwest similarly recorded losses despite rising patronage as overtime rules boosted labor costs. Recruiting, upskilling, and retaining licensed drivers, especially for rural long-haul shifts, is becoming as critical as fleet modernization.
*Our forecasts treat driver/restraint impacts as directional, not additive. The impact forecasts reflect baseline growth, mix effects, and variable interactions.
Segment Analysis
By Service Type: Premium Services Drive Yield Enhancement
Economy and standard offerings retained 80.65% of the intercity bus travel market size in 2025, thanks to sharp pricing and network breadth. Premium/luxury formats, however, are accelerating at a 9.89% CAGR as operators monetize comfort and productivity amenities that resonate with executives and affluent tourists. The intercity bus travel market gains pricing headroom via wider seat pitches, curated entertainment, and inclusive Wi-Fi, elements that lift average ticket yields without pushing away cost-sensitive segments.
Premium cabins also insulate operators from airline fare wars on competitive corridors. Business-express departures tend to run during weekday peaks, using smaller, high-spec vehicles that maintain 65-70% capacity at fares up to 40% above standard. As a result, premium buses are forecast to raise their revenue share from under 20% today to a quarter of sector turnover by 2031, reinforcing the twin-track positioning of value and upscale services.


By Booking Channel: Digital Transformation Accelerates Market Access
Offline ticket counters and regional agencies still generated 52.68% of the intercity bus travel market size in 2025. Yet online aggregators and OTAs are registering the steepest 10.38% CAGR as smartphone-centric millennials dominate new patronage. The intercity bus travel market benefits from transparent comparison sites that shrink search friction and enable dynamic pricing.
Operator-owned apps serve as a strategic hedge, letting carriers harvest data for loyalty programs and targeted promotions while paying lower commissions than on third-party portals. In markets with limited digital literacy, cash-based kiosks will endure, but adoption trajectories imply that more than two-thirds of global coach tickets will transact online by 2031, giving digitally mature operators a decisive edge.
By Propulsion Type: Electrification Drives Sustainable Transformation
Diesel still accounts for 73.92% of the intercity bus travel market size because of established fueling networks and low CAPEX. Battery-electric buses, though nascent, are scaling quickly at a 12.43% CAGR, propelled by European and Chinese policy-driven mandates. The intercity bus travel market share of diesel is therefore set to erode steadily as total cost of ownership parity arrives.
Interim alternatives, such as CNG or LNG, provide lower-emission pathways for longer routes where charging infrastructure is sparse. Hybrid and hydrogen solutions hold niche promise. Success hinges on public-private partnerships that underwrite charging corridors, with firms like Stagecoach procuring 244 zero-emission units under the UK ZEBRA-2 scheme.
By Bus Type: Luxury Configurations Capture Premium Demand
Single-deck coaches remain the workhorse, delivering 78.22% of 2025 revenue. Nevertheless, luxury variants are charting a 9.01% CAGR, supplying reclining pod seats, privacy dividers, and premium hospitality, features that help lift net margin per kilometer even when load factors dip.
Double-deckers support volume on dense corridors where terminal slots are scarce, while traditional coach layouts bridge cost and comfort for mid-range demand. The intercity bus travel market exhibits rising segmentation by time-band and passenger mix, prompting fleet planners to diversify platforms. Manufacturers are responding with modular architectures that allow operators to swap interior fittings for weekday commuters versus weekend leisure runs.
By Distance Band: Long-Haul Routes Drive Premium Growth
Medium-haul journeys (200-400 km) still supply 61.74% of demand thanks to balanced travel time and cost positioning. Long-haul sectors above 400 km, however, post the fastest 8.41% CAGR as airlines retrench on marginal regional services and travelers accept longer transit in exchange for lower fares. The intercity bus travel market size gains from premium add-ons such as sleeper seats and onboard catering that make 6-hour-plus trips more palatable.
Infrastructure upgrades like India’s new expressways are reshaping elasticity: the Nagpur-Mumbai route saw a 215% jump in bookings alongside a 16% fare slide once faster tarmac opened. Short-haul (< 200 km) faces the stiffest competition from rideshare and private cars, compelling operators to focus on frequency and first-last-mile links.
By End-User: Business Travelers Embrace Bus Mobility
Leisure and VFR held 39.58% of 2025 turnover, yet business travelers headline growth at 9.05% CAGR. Corporations are rewriting travel policies to meet ESG goals and cut trip budgets, modestly tolerating longer transit if buses supply reliable Wi-Fi and quiet working environments. The intercity bus travel market is responding through weekday-centric premium schedules and corporate booking portals integrated into expense-management systems.
Students, young professionals, migrant labor, and tourist groups form vital secondary bases. Their seasonality assists operators in flattening demand curves, although sudden policy shifts on migration or tuition can dent volumes. Personalization, loyalty wallets, and multi-ride passes are therefore key retention tools across user tiers.
Geography Analysis
Asia-Pacific delivered 32.25% of global revenue in 2025, anchored by China’s 77% electrified fleet and India’s highway expansion that is set to double coach seat sales. Japan, South Korea, and fast-growing ASEAN economies add technological advances such as QR-based boarding and real-time trip assurance, creating a fertile backdrop for revenue diversification.
Europe is the fastest riser at 9.73% CAGR through 2031 as EU rules demand 45% CO₂ cuts from heavy-duty vehicles by 2030 and 90% by 2040. Market players are accelerating e-bus procurement, catalyzed by subsidies and cross-border liberalization that simplifies route licenses. Operators like FlixBus highlight hub-and-spoke optimization, while Nordic countries lead per-capita e-bus uptake.
North America is undergoing consolidation plus rural reinvestment. The USD 16.8 billion FTA request and state-funded EV corridors seek to reverse network shrinkage in underserved regions. FlixBus's acquiring Greyhound has cut overlap and introduced European service levels, including dynamic fares and carbon-neutral seat add-ons. Canada and Mexico further support cross-border holiday flows and seasonal worker mobility.

Competitive Landscape
Competition is moderate but intensifying. The top five brands—Flix (including Greyhound), National Express, Stagecoach, ALSA, and BlaBlaCar Bus—hold the lion’s share, leveraging extensive fleets, robust digital ecosystems, and pan-regional licenses. Flix alone posted EUR 2 billion in 2023 revenue by fusing network expansion and cost-scale synergies.
Digital mastery separates leaders from followers: AI-driven pricing, predictive maintenance, and CRM analytics drive both yield and loyalty. Sustainability credentials also weigh heavily; Stagecoach’s 244-unit e-bus order underscores a pivot that resonates with public funding criteria.
White-space opportunities continue in rural connectivity, MaaS orchestration, and premium express niches. Market entrants must either gain scale quickly via partnerships or specialize in high-service offerings to escape commodity fare wars.
Intercity Bus Travel Industry Leaders
-
FlixBus Inc.
-
National Express Ltd
-
Stagecoach
-
ALSA (Mobility ADO)
-
BlaBlaCar Bus
- *Disclaimer: Major Players sorted in no particular order

Recent Industry Developments
- March 2025: FlixBus added three U.S. routes linking key university and metro hubs, noting 7.5% annual ridership growth.
- November 2024: RedBus launched the Primo scheme to lift SME operator occupancy 5-7% via branding and digital support.
- June 2024: Keolis landed new U.S. bus contracts, expanding a 5,600-vehicle global fleet with a net-zero-by-2050 pledge.
- July 2024: Flix welcomed EQT Future and Kühne Holding as new shareholders, acquiring a 35% stake to support expansion into Chile and India and to reach carbon-neutrality targets by 2040 in Europe and 2050 worldwide.


Global Intercity Bus Travel Market Report Scope
| Economy / Standard |
| Premium / Luxury |
| Offline Counter / Agency |
| Operator-Owned Websites & Apps |
| Online Aggregators / OTAs |
| Diesel |
| CNG / LNG |
| Battery-Electric |
| Hybrid & Hydrogen Fuel-Cell |
| Single-Deck Buses |
| Double-Deck Buses |
| Coach Buses |
| Luxury Buses |
| Short-haul (less than 200 km) |
| Medium-haul (200-400 km) |
| Long-haul (above 400 km) |
| Students & Young Professionals |
| Leisure & VFR |
| Business Travelers |
| Migrant & Seasonal Workers |
| North America | Canada |
| United States | |
| Mexico | |
| South America | Brazil |
| Peru | |
| Chile | |
| Argentina | |
| Rest of South America | |
| Asia-Pacific | India |
| China | |
| Japan | |
| Australia | |
| South Korea | |
| South-East Asia (SG, MY, TH, ID, VN, PH) | |
| Rest of Asia-Pacific | |
| Europe | United Kingdom |
| Germany | |
| France | |
| Spain | |
| Italy | |
| BENELUX (BE, NL, LU) | |
| NORDICS (DK, FI, IS, NO, SE) | |
| Rest of Europe | |
| Middle East & Africa | United Arab Emirates |
| Saudi Arabia | |
| South Africa | |
| Nigeria | |
| Rest of Middle East & Africa |
| By Service Type | Economy / Standard | |
| Premium / Luxury | ||
| By Booking Channel | Offline Counter / Agency | |
| Operator-Owned Websites & Apps | ||
| Online Aggregators / OTAs | ||
| By Propulsion Type | Diesel | |
| CNG / LNG | ||
| Battery-Electric | ||
| Hybrid & Hydrogen Fuel-Cell | ||
| By Bus Type | Single-Deck Buses | |
| Double-Deck Buses | ||
| Coach Buses | ||
| Luxury Buses | ||
| By Distance Band | Short-haul (less than 200 km) | |
| Medium-haul (200-400 km) | ||
| Long-haul (above 400 km) | ||
| By End-User | Students & Young Professionals | |
| Leisure & VFR | ||
| Business Travelers | ||
| Migrant & Seasonal Workers | ||
| By Geography | North America | Canada |
| United States | ||
| Mexico | ||
| South America | Brazil | |
| Peru | ||
| Chile | ||
| Argentina | ||
| Rest of South America | ||
| Asia-Pacific | India | |
| China | ||
| Japan | ||
| Australia | ||
| South Korea | ||
| South-East Asia (SG, MY, TH, ID, VN, PH) | ||
| Rest of Asia-Pacific | ||
| Europe | United Kingdom | |
| Germany | ||
| France | ||
| Spain | ||
| Italy | ||
| BENELUX (BE, NL, LU) | ||
| NORDICS (DK, FI, IS, NO, SE) | ||
| Rest of Europe | ||
| Middle East & Africa | United Arab Emirates | |
| Saudi Arabia | ||
| South Africa | ||
| Nigeria | ||
| Rest of Middle East & Africa | ||


Key Questions Answered in the Report
What is the current size of the intercity bus travel market?
The intercity bus travel market size was USD 21.81 billion in 2026 and is projected to hit USD 30.19 billion by 2031.
Which region leads intercity bus revenue today?
Asia-Pacific holds the largest regional share at 32.25% owing to vast populations, electrification policies, and rapid highway expansion.
How quickly are electric coaches gaining ground?
Battery-electric buses represent the fastest-growing propulsion type, advancing at a 12.43% CAGR during 2026-2031 as EU and Chinese mandates tighten.
Why are premium bus services expanding faster than standard?
Premium cabins capture higher yields by offering business-class seating, onboard Wi-Fi, and greater comfort, supporting a 9.89% CAGR through 2031.
What booking channel is growing the fastest?
Online aggregators and OTAs lead at 10.38% CAGR because they simplify price comparisons and support dynamic fares appealing to tech-savvy travelers.
How are government investments influencing rural routes?
Programs like the USD 16.8 billion U.S. FTA budget request and state-level funds inject capital into underserved corridors, opening new destinations while supporting zero-emission fleet transitions.
Page last updated on:


