Market Overview
| Study Period | 2019 - 2031 |
|---|---|
| Forecast Data Period | 2026 - 2031 |
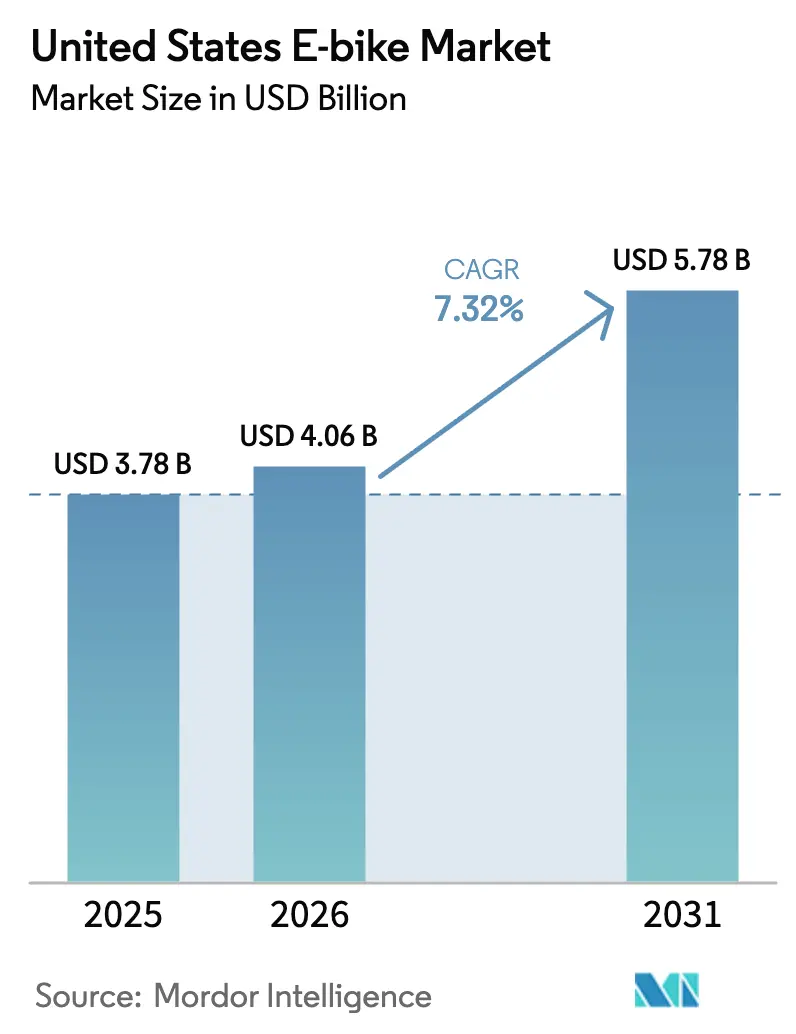
| Base Year Market Size (2025) | USD 3.78 Billion |
| Market Size (2026) | USD 4.06 Billion |
| Market Size (2031) | USD 5.78 Billion |
| Growth Rate (2026 - 2031) | 7.32% CAGR |
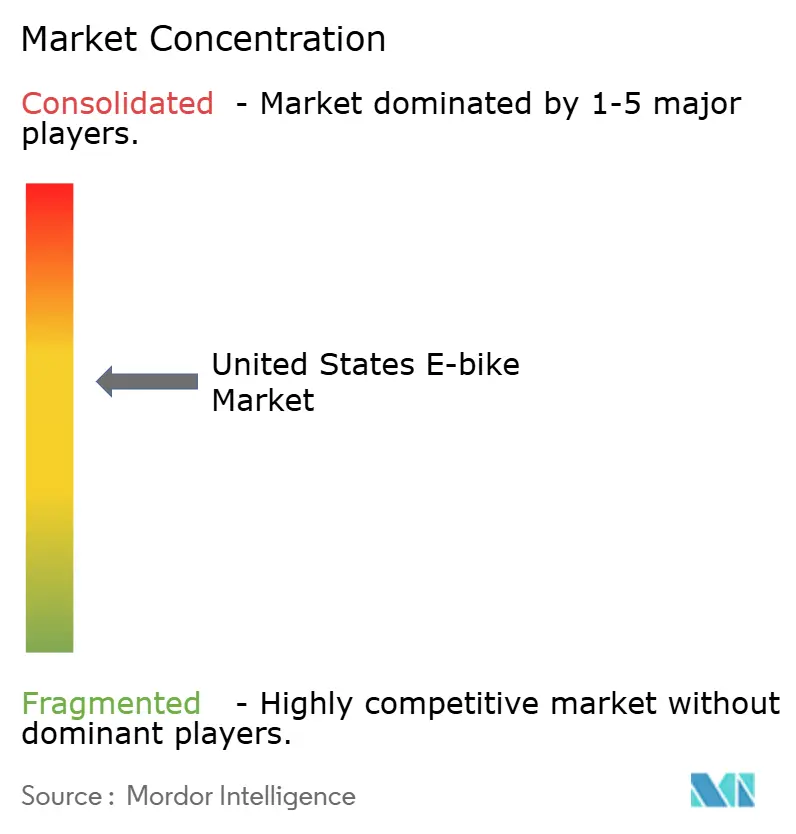
| Market Concentration | Medium |
Major Players
*Disclaimer: Major Players sorted in no particular order Image © Mordor Intelligence. Reuse requires attribution under CC BY 4.0. |
|
United States E-bike Market Analysis by Mordor Intelligence
The United States E-bike market size is expected to grow from USD 3.78 billion in 2025 to USD 4.06 billion in 2026 and is forecasted to reach USD 5.78 billion by 2031 at a 7.32% CAGR over 2026-2031. Federal and state purchase incentives, expanding protected lane networks, and commercial fleet adoption continue to keep demand on an upward trajectory. Pedal-assisted models still dominate shelves, but speed pedelecs are gaining momentum as more states harmonize Class 3 regulations. Cargo bikes are flourishing as quick-commerce operators seek to trim last-mile costs, while rising lithium-ion energy density enables longer ranges on a single charge. Online direct-to-consumer strategies compress retail margins and accelerate price transparency, pressuring legacy bicycle outlets to refocus on service quality and test-ride experiences[1]“Electric Bicycle Tax Credit Information,” Internal Revenue Service, IRS.GOV.
Key Report Takeaways
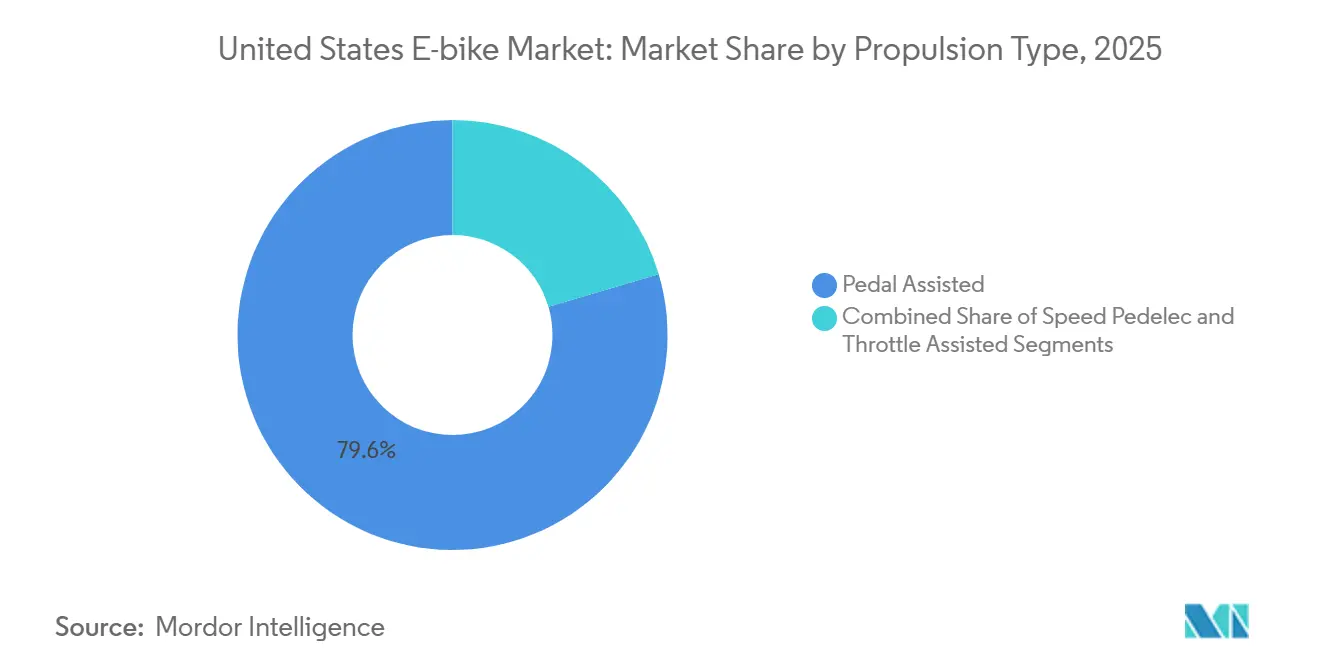
- By propulsion type, pedal-assisted models led the United States E-bike market share with 79.55% in 2025; speed pedelecs are expected to register the fastest growth rate of 8.74% through 2031.
- By application, city/urban bikes captured 81.99% of the United States E-bike market size in 2025, while cargo/utility bikes are expected to expand at a 7.42% CAGR to 2031.
- By battery type, lithium-ion packs commanded 92.60% share of the United States E-bike market size in 2025 and are projected to climb at a 7.99% CAGR by 2031.
- By motor placement, hub motors held 64.34% share of the United States E-bike market size in 2025; mid-drive units are forecasted to grow at a 9.91% CAGR through 2031.
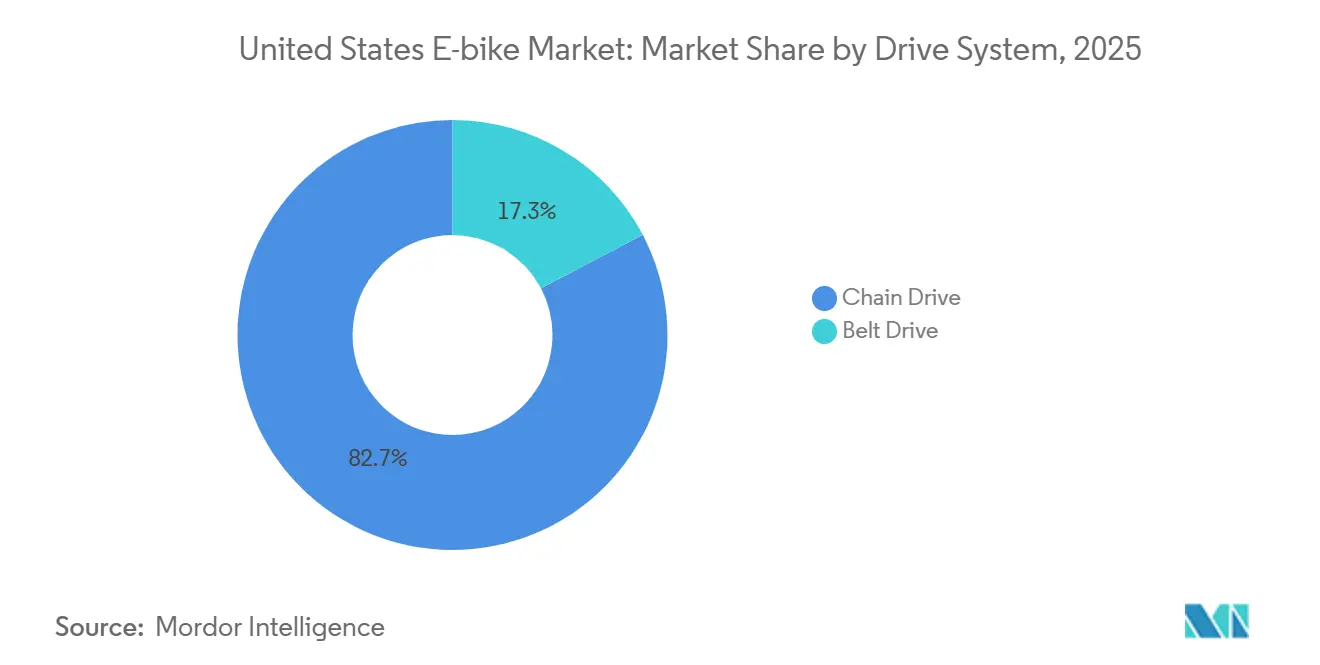
- By drive system, chain drives accounted for 82.73% of the United States E-bike market size in 2025, whereas belt drives are projected to advance at a 10.16% CAGR to 2031.
- By motor power, the 251-350 W band secured a 38.81% revenue share of the United States E-bike market size in 2025 and remains the largest cohort; 501-600 W bikes are anticipated to post the fastest growth at a 10.84% CAGR.
- By price band, USD 1,500-2,499 models led with a 29.62% share of the United States E-bike market size in 2025; USD 2,500-3,499 units are anticipated to post the fastest growth, with a 7.91% CAGR to 2031.
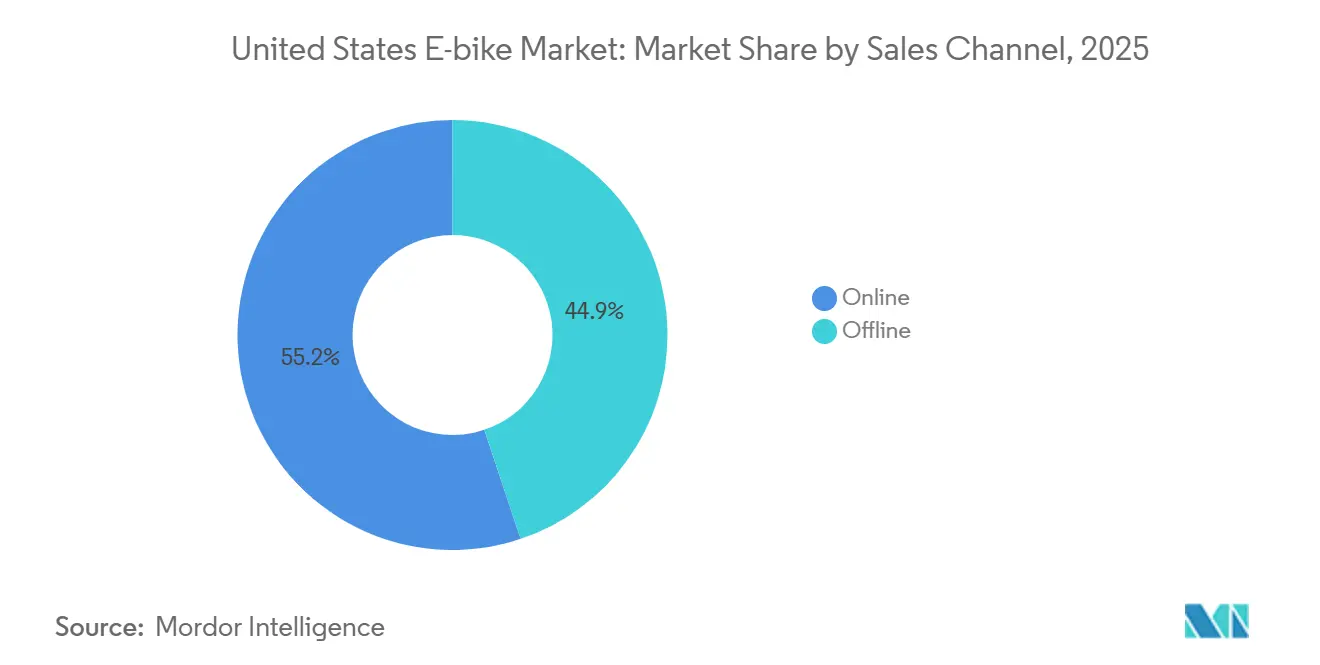
- By sales channel, online platforms are already delivering 55.15% of the United States E-bike market size in 2025 and are anticipated to expand at a 12.15% CAGR through 2031.
- By end use, personal and family riders generated 62.31% of the United States E-bike market size in 2025; commercial delivery fleets are anticipated to scale fastest at a 12.96% CAGR.
Note: Market size and forecast figures in this report are generated using Mordor Intelligence’s proprietary estimation framework, updated with the latest available data and insights as of January 2026.
United States E-bike Market Trends and Insights
Drivers Impact Analysis*
| Driver | (~) % Impact on CAGR Forecast | Geographic Relevance | Impact Timeline |
|---|---|---|---|
| Purchase Incentives | +1.8% | California, New York, Colorado, Vermont | Short term (≤ 2 years) |
| Adoption by Quick-Commerce | +1.6% | Urban centers nationwide, concentrated in California, New York, Texas | Medium term (2-4 years) |
| Urban Congestion | +1.5% | Metropolitan areas, West Coast, Northeast corridor | Medium term (2-4 years) |
| Declining Battery Cost | +1.3% | Manufacturing hubs in California, Oregon, nationwide distribution | Long term (≥ 4 years) |
| Eco-Conscious Consumers | +1.1% | Pacific Northwest, California, Northeast states | Long term (≥ 4 years) |
| Corporate Micro-Mobility Programs | +0.9% | Tech corridors in California, Washington, New York metro | Short term (≤ 2 years) |
| Source: Mordor Intelligence | |||


Federal and State Purchase Incentives
Federal tax incentives have made qualifying electric bikes more affordable than used cars for many urban commuters. State-level rebates further bridge the cost gap, particularly aiding lower-income communities that previously had limited access to adoption. Delivery fleet businesses are leveraging these federal and state benefits to reap quick returns on their cargo bike investments. During promotional periods, retailers have experienced a surge in sales, which can sometimes lead to temporary shortages in high-demand states. Financing options have adapted, now offering interest-free plans, making it easier for cash-strapped households to join the trend.
Rapid E-Cargo Adoption by Quick-Commerce
On-demand delivery platforms, such as DoorDash, are accelerating their e-bike rollout, resulting in faster delivery times, even in heavy traffic. Grocery and pharmacy chains adopting similar E-bike initiatives have reported operating costs per mile that are significantly lower than those of traditional gasoline-powered vans. Due to recent federal legislation, expanded bike lanes have been created, offering safer and more efficient routes for cargo bike riders. Fleet managers are reaping financial benefits, citing reduced parking expenses and fewer traffic violations as key contributors to their overall cost savings. Consequently, there is growing interest in more powerful mid-drive E-bike models in the United States market, as they excel at carrying heavy loads without compromising performance.
Urban Congestion Driving Micro-Mobility
In downtown Los Angeles, E-bike riders consistently outpace cars during peak traffic hours. In response, employers, especially those in the tech and finance sectors, are installing secure bike storage and shower facilities, encouraging more workers to adopt E-bikes for their commutes. Public agencies are carving out road space for micromobility; cities like New York are expanding protected bike lanes, resulting in a marked uptick in weekday E-bike usage. Real estate developers are touting proximity to cycling infrastructure as a prime amenity in mixed-use projects, signaling a deeper integration of biking into urban life. Meanwhile, health-conscious individuals are adopting E-bike riding as a moderate form of exercise, broadening its appeal across age groups.
Declining Li-Ion Battery Cost and Range Gain
In 2025, lithium-ion battery packs experienced a notable price drop, accompanied by a consistent increase in energy storage capacity per unit weight. Manufacturers swiftly upgraded their 2025 models, incorporating larger battery capacities that significantly extended assisted travel distances, all without raising retail prices. Corporate fleet operators are showing keen interest in a specific battery chemistry, renowned for its durability, as it withstands years of rigorous use in challenging delivery scenarios. Additionally, battery management systems have advanced, now featuring temperature-sensitive charging capabilities. This innovation aims to reduce wear and tear for users in both sweltering heat and frigid cold. Domestic cell-plant construction enabled by Inflation Reduction Act tax credits is expected to localize 1,000 GWh per year by 2028, moderating import risks tied to Asian supply chains[2]"Wave of Decline Sweeps Lithium-Ion Battery Pack Pricing, in 2024 Displays a Notable 20% Dip Amidst Intensifying Market Competition" ACE Battery, www.acebattery.com.
Restraints Impact Analysis*
| Restraint | (~) % Impact on CAGR Forecast | Geographic Relevance | Impact Timeline |
|---|---|---|---|
| High Price Vs Conventional Bikes | -0.6% | Rural areas, lower-income regions nationwide | Medium term (2-4 years) |
| Sparse Public Charging Spots | -0.4% | Suburban and rural areas, secondary cities | Long term (≥ 4 years) |
| Patchwork of Speed-Class Regulations | -0.4% | State borders, multi-state metropolitan areas | Short term (≤ 2 years) |
| Insurance and Liability Premiums | -0.3% | Urban areas with high theft rates, commercial fleet operators | Medium term (2-4 years) |
| Source: Mordor Intelligence | |||
High Upfront Price vs Conventional Bikes
High-quality electric bikes continue to be priced above traditional bicycles, which can deter budget-conscious households, even though E-bikes offer better long-term value. In rural areas, where incomes tend to be lower than in urban areas, residents often face barriers to accessing interest-free financing due to stringent credit requirements. The limited availability of used E-bikes drives up secondhand prices, and the lack of nearby service centers adds to concerns about maintenance. Insurance costs further widen the affordability gap when compared to non-electric bikes. Without broader incentive programs that reach beyond major urban centers, E-bike adoption in rural communities may struggle to gain traction.
Sparse Public E-bike Charging Spots
Across the United States, dedicated E-bike charging stations are scarce, except in regions such as New York, Oregon, Pittsburgh, Boston, and select parts of Massachusetts. Without a reliable public charging infrastructure, commuters often conserve battery power, which in turn deters them from embarking on longer, multi-stop journeys. Retail property owners hesitate to invest in charging stations due to the absence of a standardized connector system, which contrasts with the more cohesive approach in the electric car sector, making it challenging to realize cost efficiencies on a larger scale. Local governments face the financial burden of high grid upgrade costs and lengthy permitting processes. Consequently, riders in smaller cities remain apprehensive about battery range, hindering the widespread adoption and growth of E-bikes in the United States.
*Our forecasts treat driver/restraint impacts as directional, not additive. The impact forecasts reflect baseline growth, mix effects, and variable interactions.
Segment Analysis
By Propulsion Type: Pedal-Assist Strength Meets Speed-Pedelec Momentum
Pedal-assisted bikes accounted for 79.55% of the United States E-bike market share in 2025, driven by favorable regulations and a ride experience that mirrors traditional cycling. Class 1 status grants lane and trail access, broadening use cases from daily commuting to weekend recreation. Meanwhile, speed pedelecs are forecasted to post an 8.74% CAGR as commuters value 28 mph assistance that beats traffic signals. Throttle-only models fill a small yet persistent niche among mobility-impaired riders who need propulsion without pedaling.
OEMs, therefore, carefully segment their lineups, ensuring clear compliance labeling to avoid consumer confusion and dealer liabilities. The growth of speed-pedelecs benefits from stricter emissions rules in urban cores that cap automobile access. Employers incentivize faster bikes for distances of 8-15 miles that once required ride-share services. Municipalities, however, require additional safety equipment, such as mirrors and lights, which significantly adds to the bill-of-materials costs. Fleet managers accept the premium because delivery modelers demonstrate robust improvements in route completion.


By Application Type: City Dominance vs Cargo Surge
City and urban formats accounted for 81.99% of the United States E-bike market in 2025 as commuters abandoned crowded trains and expensive parking lots. Integrated fenders, lights, and racks now come standard, flattening accessory demand but boosting factory ASPs. Embedded GPS theft-tracking appeals to apartment dwellers who lack secure garages. In contrast, cargo models are charging ahead at a 7.42% CAGR, fueled by grocery, pharmacy, and parcel firms hungry for cost-effective last-mile delivery.
Modular rear racks that can carry child seats or 200 lb of freight allow family shoppers to consolidate errands without a car. Bosch’s Performance Line CX motor delivers up to 85 Nm torque for hill-laden routes and is quickly becoming a default spec. The combined effect places cargo bikes at the center of policy debates on delivery zone management and curb-space pricing. Should incentive schemes start earmarking higher rebates for utility configurations, the United States E-bike market size linked to cargo platforms may double within five years.
By Battery Type: Lithium-Ion Supremacy with LFP Upside
Lithium-ion packs commanded 92.60% of the United States E-bike market size in 2025 and are projected to register a 7.99% CAGR to 2031 because they balance weight, cost, and energy density superior to all rivals. 21700 and 4680 cylindrical formats are spreading fast as the car sector's scale pushes down per-cell prices. Lead-acid retains small holdouts in budget fleets where short urban loops forgive heavy weight. Solid-state R&D garners headlines but remains several design cycles away from price feasibility.
Within lithium-ion, LFP chemistry is gaining attention among couriers owing to its 3,000-cycle durability and improved thermal robustness, which lowers fire-risk insurance surcharges. Recent figures point to a 10-20% range improvement since 2023, handing marketers a persuasive upgrade narrative. Smart BMS firmware now schedules top-up charging windows during off-peak utility rates, intertwining energy management with household IoT ecosystems. Recycling partnerships expand closed-loop potential, establishing lithium-ion’s dominance through 2031.
By Motor Placement: Hub Leads, Mid-Drive Accelerates
Hub motors still accounted for 64.34% of the United States E-bike market size in 2025, owing to low production costs and ready-to-use assembly that suits retrofits. Silence and minimal drivetrain wear also win over urban riders. Mid-drive units, however, are on a 9.91% CAGR tear, prized for balanced weight distribution and hill-climbing power essential for cargo and mountain segments. Firmware-enabled auto-shift cues debut in 2025 models, enhancing ride ergonomics and battery use efficiency.
Suppliers respond by pushing hub torque to 80 Nm, closing the gap while keeping prices in check. Independent bike shops report higher service revenue from mid-drive models that require software updates, a dynamic that supports traditional channel economics. Over time, dual-motor AWD concepts may blur categorical boundaries, yet cost premiums currently confine them to niche adventure builds.
By Drive System: Chains Hold Court, Belts Gain Prestige
Chain drives accounted for 82.73% of the United States E-bike market in 2025, owing to the availability of vast spare parts and broad gear-ratio compatibility. Owners comfortable with periodic lubrication and tension checks appreciate low replacement costs. Belt drives are anticipated to post a 10.16% CAGR to 2031, offering whisper-quiet operation and 50,000-mile lifespans that appeal to high-mileage commuters.
Carbon-fiber tensile cords and mud-shedding tooth profiles practically eliminate stretch, though frame-split design requirements add complexity at the production line. Dealers upsell belts as a lifestyle convenience: no grease marks on office slacks. Municipal fleet tenders increasingly specify belt systems to cut maintenance downtime, particularly for bike-share programs. As OEM tooling amortizes, belt price gaps are projected to narrow, foreshadowing higher penetration in the upper mid-market.
By Motor Power: Mid-Range Sweet Spot, Higher-Power Opportunity
Motors rated 251-350 W captured 38.81% of the United States E-bike market in 2025 because they satisfy the federal 750 W cap while delivering ample torque for city grades. Efficiency gains elevate effective performance, making modern 350 W units rival older 500 W motors. Cargo fleets nevertheless lean into 501-600 W models are anticipated to advance at a 10.84% CAGR to haul heavier payloads within eight-hour shift windows.
Bikes below 250 W remain mostly export-oriented or fitness-centric, while units above 600 W face insurance hurdles. Regulatory frameworks set a ceiling at 750 W, driving innovation toward lighter frames and better thermal management. Retailers educate buyers on the diminishing returns of high power when battery capacity stays constant. As such, the mid-range segment continues dictating component volumes and cost curves across the supply chain.
By Price Band: Mid-Market Bulk with Premium Up-Draft
The USD 1,500-2,499 bracket accounted for 29.62% of the United States E-bike market in 2025, striking the optimal balance between reputable component brands and attainable pricing. Direct-to-consumer pioneers compress margins, enabling spec sheets once reserved for USD 3,000 bikes to reach mainstream budgets. Meanwhile, corporate benefit schemes are nudging aspirational buyers into the USD 2,500-3,499 range, which is set to expand at a 7.91% CAGR through 2031.
Sub-USD 1,000 units battle warranty claims and short product lifespans that hinder repeat business. Premium USD 3,500-6,000 builds cater to enthusiasts and delivery outfits chasing higher payload thresholds. Advanced telemetry, ABS braking, and adaptive suspension justify the price tags for users counting on multi-year, high-mileage duty cycles. Access-oriented financing and residual-value guarantees sprout in response, moderating sticker shock and broadening uptake.
By Sales Channel: Online Ascendancy, Hybrid Service Models
Online platforms captured 55.15% of the United States E-bike market size in 2025 and are expected to post a 12.15% CAGR as shoppers appreciate doorstep delivery and transparent spec comparisons. Video test rides and 3D bike-fit apps fill experiential gaps once unique to physical stores. Brick-and-mortar dealers are pivoting to hybrid models, where customers order online, choose in-store assembly, and receive follow-up service. Warranty claims streamlined through app-based scheduling reduce downtime and strengthen brand loyalty.
Seasonal clearance sales on e-commerce sites intensify price competition, encouraging manufacturers to release staggered model-year updates rather than annual overhauls. Marketplace data analytics inform inventory planning, thereby curbing the risk of overproduction. Offline channels still anchor premium purchases where test rides influence willingness to spend more, proving that tactile experiences remain pivotal at the top end of the United States E-bike market.
By End Use: Personal Volume, Commercial Velocity
Personal and family riders captured 62.31% of the United States E-bike market size in 2025, crediting commuting convenience, recreation, and combined exercise benefits. Suburban homeowners increasingly store two E-bikes next to compact crossover vehicles, shifting 30-mile round-trip errands away from gasoline. Commercial delivery fleets, although smaller today, are expected to book the highest 12.96% CAGR on the back of booming quick-commerce.
Labor platform apps integrate route optimization and battery-swap logistics, boosting driver earnings per hour. Institutional sectors, such as universities and hospitals, as well as municipal maintenance crews, often tag onto sustainability mandates, specifying cargo frames adapted for tool kits and refuse collection. Lease-to-own programs lower capital barriers for smaller fleet start-ups. As infrastructure and regulations mature, commercial segments are poised to capture a sizable volume of the personal share by 2031.
Geography Analysis
California, New York, and Washington accounted for the majority of national sales in 2025, driven by favorable climates, dense urban grids, and robust incentive portfolios. Local utility programs such as Alameda Municipal Power and East Bay Community Energy still provide a USD 500 to USD 1,000 rebate. Los Angeles alone is projected to add 238 miles of protected lanes, which will catalyze weekday ridership. Technology employers in the Bay Area underpin premium demand, co-funding mid-drive commuter models for staff. The West Coast’s early-adopter culture often sets design cues that are subsequently mirrored nationwide.
The Northeast corridor, led by New York City and Boston, ranks second on volume despite harsher winters. Financial services firms sponsor purchase plans to mitigate perceptions of luxury tax among affluent commuters. Boston launched an ARPA-funded E-bike incentive program in 2024, offering USD 800 to USD 2,400 vouchers and planning 10 miles of new bike lanes annually, aiming for 50% of residents to be within a 3-minute walk of a protected lane by 2027. Higher theft rates in the region steer buyers toward integrated GPS and locking-motor features.
Mountain West and Pacific Northwest states post the fastest compound growth as outdoor recreation dovetails with eco-centric lifestyles. Colorado’s programs proved attractive in rural counties where cars are costly per-mile. Class 1 access to federal trails widened weekend ridership, supporting specialized trekking retailers in Denver and Boise. Seattle marshals public-private partnerships to roll out neighborhood-level charging lockers, pioneering a blueprint that secondary cities plan to replicate. Combined, these regions outline a frontier for United States E-bike market expansion beyond coastal megacities.
Competitive Landscape
The United States E-bike market exhibits moderate concentration, indicating significant opportunities for emerging brands and niche specialists. Rad Power Bikes leverages a direct-to-consumer model, capturing market share by undercutting dealer mark-ups and standardizing on modular battery platforms. Trek and Specialized rely on long-standing dealer networks to preserve premium positioning and turnkey service packages. Second-tier challengers focus on narrow niches, cargo, mountain, or lightweight commuter, and use social-media micro-targeting to gain a footing.
Vertical integration strategies differ widely: some brands outsource drivetrains to Bosch or Shimano, while others develop proprietary motors to lock in differentiation. Patent filings related to E-bike motor control algorithms and battery management systems increased significantly in 2025, reflecting growing innovation in powertrain integration and smart energy management. Component suppliers, such as battery-cell makers, negotiate long-term contracts directly with OEMs, underscoring the importance of supply-chain resilience as a strategic asset.
Mergers and equity stakes underscore competitive dynamism. A notable 2025 move saw a leading ride-share platform invest in a mid-drive specialist to secure supply for its growing delivery fleet. Marketing alliances with sports apparel giants promote lifestyle branding that elevates brand value beyond mechanical specs. The competitive duel thus unfolds on multiple fronts: cost leadership, performance innovation, service ecosystems and lifestyle identity.
United States E-bike Industry Leaders
-
Giant Manufacturing Co.
-
Specialized Bicycle Components Inc.
-
Trek Bicycle Corporation
-
Rad Power Bikes Inc.
-
Aventon Bikes Inc.
- *Disclaimer: Major Players sorted in no particular order

Recent Industry Developments
- July 2025: DJI introduced the Amflow PL Carbon and PL Carbon Pro e-bikes in the United States. The models retail at USD 7,499 and USD 10,199 respectively.
- May 2025: STACYC, backed by LiveWire, launched the 20hDRIVE pedal-assist e-bike for adults with a 20-mph top-assist speed.
- December 2024: Segway formed a dedicated U.S. e-bike division to support its initial two-model launch and future cycling products.


United States E-bike Market Report Scope
The United States E-bike market is analyzed across multiple segmentation dimensions to provide comprehensive market intelligence. By Propulsion Type, the market is segmented into Pedal-Assisted, Speed-Pedelec, and Throttle-Assisted. By Application Type, the market is segmented into Cargo/Utility, City/Urban, and Trekking/Mountain. By Battery Type, the market is segmented into Lead-Acid Battery, Lithium-ion Battery, and Others. By Motor Placement, the market is segmented into Hub (Front/Rear) and Mid-Drive. By Drive Systems, the market is segmented into Chain Drive and Belt Drive. By Motor Power, the market is segmented into less than 250W, 251-350W, 351-500W, 501-600W, and above 600W. By Price Band, the market is segmented into Up to USD 1,000, USD 1,000 to 1,499, USD 1,500 to 2,499, USD 2,500 to 3,499, USD 3,500 to 5,999, and Above USD 6,000. By Sales Channel, the market is segmented into Online and Offline Channels. By End-use, the market is segmented into Commercial Delivery (Retail and Goods Delivery and Food and Beverage Delivery), Service Providers, Personal and Family Use, Institutional, and Others. Market forecasts are provided in terms of Value (USD) and Volume (Units).
By Propulsion Type
| Pedal Assisted |
| Speed Pedelec |
| Throttle Assisted |
By Application Type
| Cargo/Utility |
| City/Urban |
| Trekking/Mountain |
By Battery Type
| Lead Acid Battery |
| Lithium-ion Battery |
| Others |
By Motor Placement
| Hub (front/rear) |
| Mid-drive |
By Drive System
| Chain Drive |
| Belt Drive |
By Motor Power
| Below 250 W |
| 251 to 350 W |
| 351 to 500 W |
| 501 to 600 W |
| Above 600 W |
By Price Band
| Up to USD 1,000 |
| USD 1,000 to 1,499 |
| USD 1,500 to 2,499 |
| USD 2,500 to 3,499 |
| USD 3,500 to 5,999 |
| Above USD 6,000 |
By Sales Channel
| Online |
| Offline |
By End Use
| Commercial Delivery | Retail and Goods Delivery |
| Food and Beverage Delivery | |
| Service Providers | |
| Personal and Family Use | |
| Institutional | |
| Others |
| By Propulsion Type | Pedal Assisted | |
| Speed Pedelec | ||
| Throttle Assisted | ||
| By Application Type | Cargo/Utility | |
| City/Urban | ||
| Trekking/Mountain | ||
| By Battery Type | Lead Acid Battery | |
| Lithium-ion Battery | ||
| Others | ||
| By Motor Placement | Hub (front/rear) | |
| Mid-drive | ||
| By Drive System | Chain Drive | |
| Belt Drive | ||
| By Motor Power | Below 250 W | |
| 251 to 350 W | ||
| 351 to 500 W | ||
| 501 to 600 W | ||
| Above 600 W | ||
| By Price Band | Up to USD 1,000 | |
| USD 1,000 to 1,499 | ||
| USD 1,500 to 2,499 | ||
| USD 2,500 to 3,499 | ||
| USD 3,500 to 5,999 | ||
| Above USD 6,000 | ||
| By Sales Channel | Online | |
| Offline | ||
| By End Use | Commercial Delivery | Retail and Goods Delivery |
| Food and Beverage Delivery | ||
| Service Providers | ||
| Personal and Family Use | ||
| Institutional | ||
| Others | ||


Market Definition
- By Application Type - E-bikes considered under this segment include city/urban, trekking, and cargo/utility e-bikes. The common types of e-bikes under these three categories include off-road/hybrid, kids, ladies/gents, cross, MTB, folding, fat tire, and sports e-bike.
- By Battery Type - This segment includes lithium-ion batteries, lead-acid batteries, and other battery types. The other battery type category includes nickel-metal hydroxide (NiMH), silicon, and lithium-polymer batteries.
- By Propulsion Type - E-bikes considered under this segment include pedal-assisted e-bikes, throttle-assisted e-bikes, and speed pedelec. While the speed limit of pedal and throttle-assisted e-bikes is usually 25 km/h, the speed limit of speed pedelec is generally 45 km/h (28 mph).
| Keyword | Definition |
|---|---|
| Pedal Assisted | Pedal-assist or pedelec category refers to the electric bikes that provide limited power assistance through torque-assist system and do not have throttle for varying the speed. The power from the motor gets activated upon pedaling in these bikes and reduces human efforts. |
| Throttle Assisted | Throttle-based e-bikes are equipped with the throttle assistance grip, installed on the handlebar, similarly to motorbikes. The speed can be controlled by twisting the throttle directly without the need to pedal. The throttle response directly provides power to the motor installed in the bicycles and speeds up the vehicle without paddling. |
| Speed Pedelec | Speed pedelec is e-bikes similar to pedal-assist e-bikes as they do not have throttle functionality. However, these e-bikes are integrated with an electric motor which delivers power of approximately 500 W and more. The speed limit of such e-bikes is generally 45 km/h (28 mph) in most of the countries. |
| City/Urban | The city or urban e-bikes are designed with daily commuting standards and functions to be operated within the city and urban areas. The bicycles include various features and specifications such as comfortable seats, sit upright riding posture, tires for easy grip and comfortable ride, etc. |
| Trekking | Trekking and mountain bikes are special types of e-bikes that are designed for special purposes considering the robust and rough usage of the vehicles. These bicycles include a strong frame, and wide tires for better and advanced grip and are also equipped with various gear mechanisms which can be used while riding in different terrains, rough grounded, and tough mountainous roads. |
| Cargo/Utility | The e-cargo or utility e-bikes are designed to carry various types of cargo and packages for shorter distances such as within urban areas. These bikes are usually owned by local businesses and delivery partners to deliver packages and parcels at very low operational costs. |
| Lithium-ion Battery | A Li-ion battery is a rechargeable battery, which uses lithium and carbon as its constituent materials. The Li-Ion batteries have a higher density and lesser weight than sealed lead acid batteries and provide the rider with more range per charge than other types of batteries. |
| Lead Acid Battery | A lead acid battery refers to sealed lead acid battery having a very low energy-to-weight and energy-to-volume ratio. The battery can produce high surge currents, owing to its relatively high power-to-weight ratio as compared to other rechargeable batteries. |
| Other Batteries | This includes electric bikes using nickel–metal hydroxide (NiMH), silicon, and lithium-polymer batteries. |
| Business-to-Business (B2B) | The sales of e-bikes to business customers such as urban fleet and logistics company, rental/sharing operators, last-mile fleet operators, and corporate fleet operators are considered under this category. |
| Business-to-Customers (B2C) | The sales of electric scooters and motorcycles to direct consumers is considered under this category. The consumers acquire these vehicles either directly from manufacturers or from other distributers and dealers through online and offline channel. |
| Unorganized Local OEMs | These players are small local manufacturers and assemblers of e-bikes. Most of these manufacturers import the components from China and Taiwan and assemble them locally. They offer the product at low cost in this price sensitive market which give them advantage over organized manufacturers. |
| Battery-as-a-Service | A business model in which the battery of an EV can be rented from a service provider or swapped with another battery when it runs out of charge |
| Dockless e-Bikes | Electric bikes that have self-locking mechanisms and a GPS tracking facility with an average top speed of around 15mph. These are mainly used by bike-sharing companies such as Bird, Lime, and Spin. |
| Electric Vehicle | A vehicle which uses one or more electric motors for propulsion. Includes cars, scooters, buses, trucks, motorcycles, and boats. This term includes all-electric vehicles and hybrid electric vehicles |
| Plug-in EV | An electric vehicle that can be externally charged and generally includes all-electric vehicles as well as plug-in hybrids. In this report we use the term for all-electric vehicles to differentiate them from plug-in hybrid electric vehicles. |
| Lithium-Sulphur Battery | A rechargeable battery that replaces the liquid or polymer electrolyte found in current lithium-ion batteries with sulfur. They have more capacity than Li-ion batteries. |
| Micromobility | Micromobility is one of the many modes of transport involving very-light-duty vehicles to travel short distances. These means of transportation include bikes, e-scooters, e-bikes, mopeds, and scooters. Such vehicles are used on a sharing basis for covering short distances, usually five miles or less. |
| Low Speed Electric Vehicls (LSEVs) | They are low speed (usually less than 25 kmph) light vehicles that do not have an internal combustion engine, and solely use electric energy for propulsion. |


Research Methodology
Mordor Intelligence follows a four-step methodology in all its reports.
- Step-1: Identify Key Variables: To build a robust forecasting methodology, the variables and factors identified in Step-1 are tested against available historical market numbers. Through an iterative process, the variables required for market forecast are set and the model is built based on these variables.
- Step-2: Build a Market Model: Market-size estimations for the historical and forecast years have been provided in revenue and volume terms. Market revenue is calculated by multiplying the volume demand with volume-weighted average battery pack price (per kWh). Battery pack price estimation and forecast takes into account various factors affecting ASP, such as inflation rates, market demand shifts, production costs, technological developments, and consumer preferences, providing estimations for both historical data and future trends.
- Step-3: Validate and Finalize: In this important step, all market numbers, variables, and analyst calls are validated through an extensive network of primary research experts from the market studied. The respondents are selected across levels and functions to generate a holistic picture of the market studied.
- Step-4: Research Outputs: Syndicated Reports, Custom Consulting Assignments, Databases & Subscription Platforms


