
Technology, Media and Telecom
5th MayPricing Strategy for Semiconductor Components
3 Min Read
The United States Discrete Semiconductors Market is Segmented by Product Type (Diode, Small Signal Transistor, Power Transistor, Rectifier, Thyristor, and More), Material (Silicon, Silicon Carbide, and More), Voltage Rating (Low Voltage, Medium Voltage, and More), Packaging Type (Through-Hole, Surface-Mount, and More), and End-User Industry (Consumer Electronics, Automotive and E-Mobility, Industrial and Automation, and More).
Market Overview
| Study Period | 2020 - 2031 |
|---|---|
| Base Year For Estimation | 2025 |
| Forecast Data Period | 2026 - 2031 |
| Market Size (2026) | USD 9.85 Billion |
| Market Size (2031) | USD 12.74 Billion |
| Growth Rate (2026 - 2031) | 5.27 % CAGR |
| Market Concentration | Medium |
Major Players *Disclaimer: Major Players sorted in no particular order. Image © Mordor Intelligence. Reuse requires attribution under CC BY 4.0. |
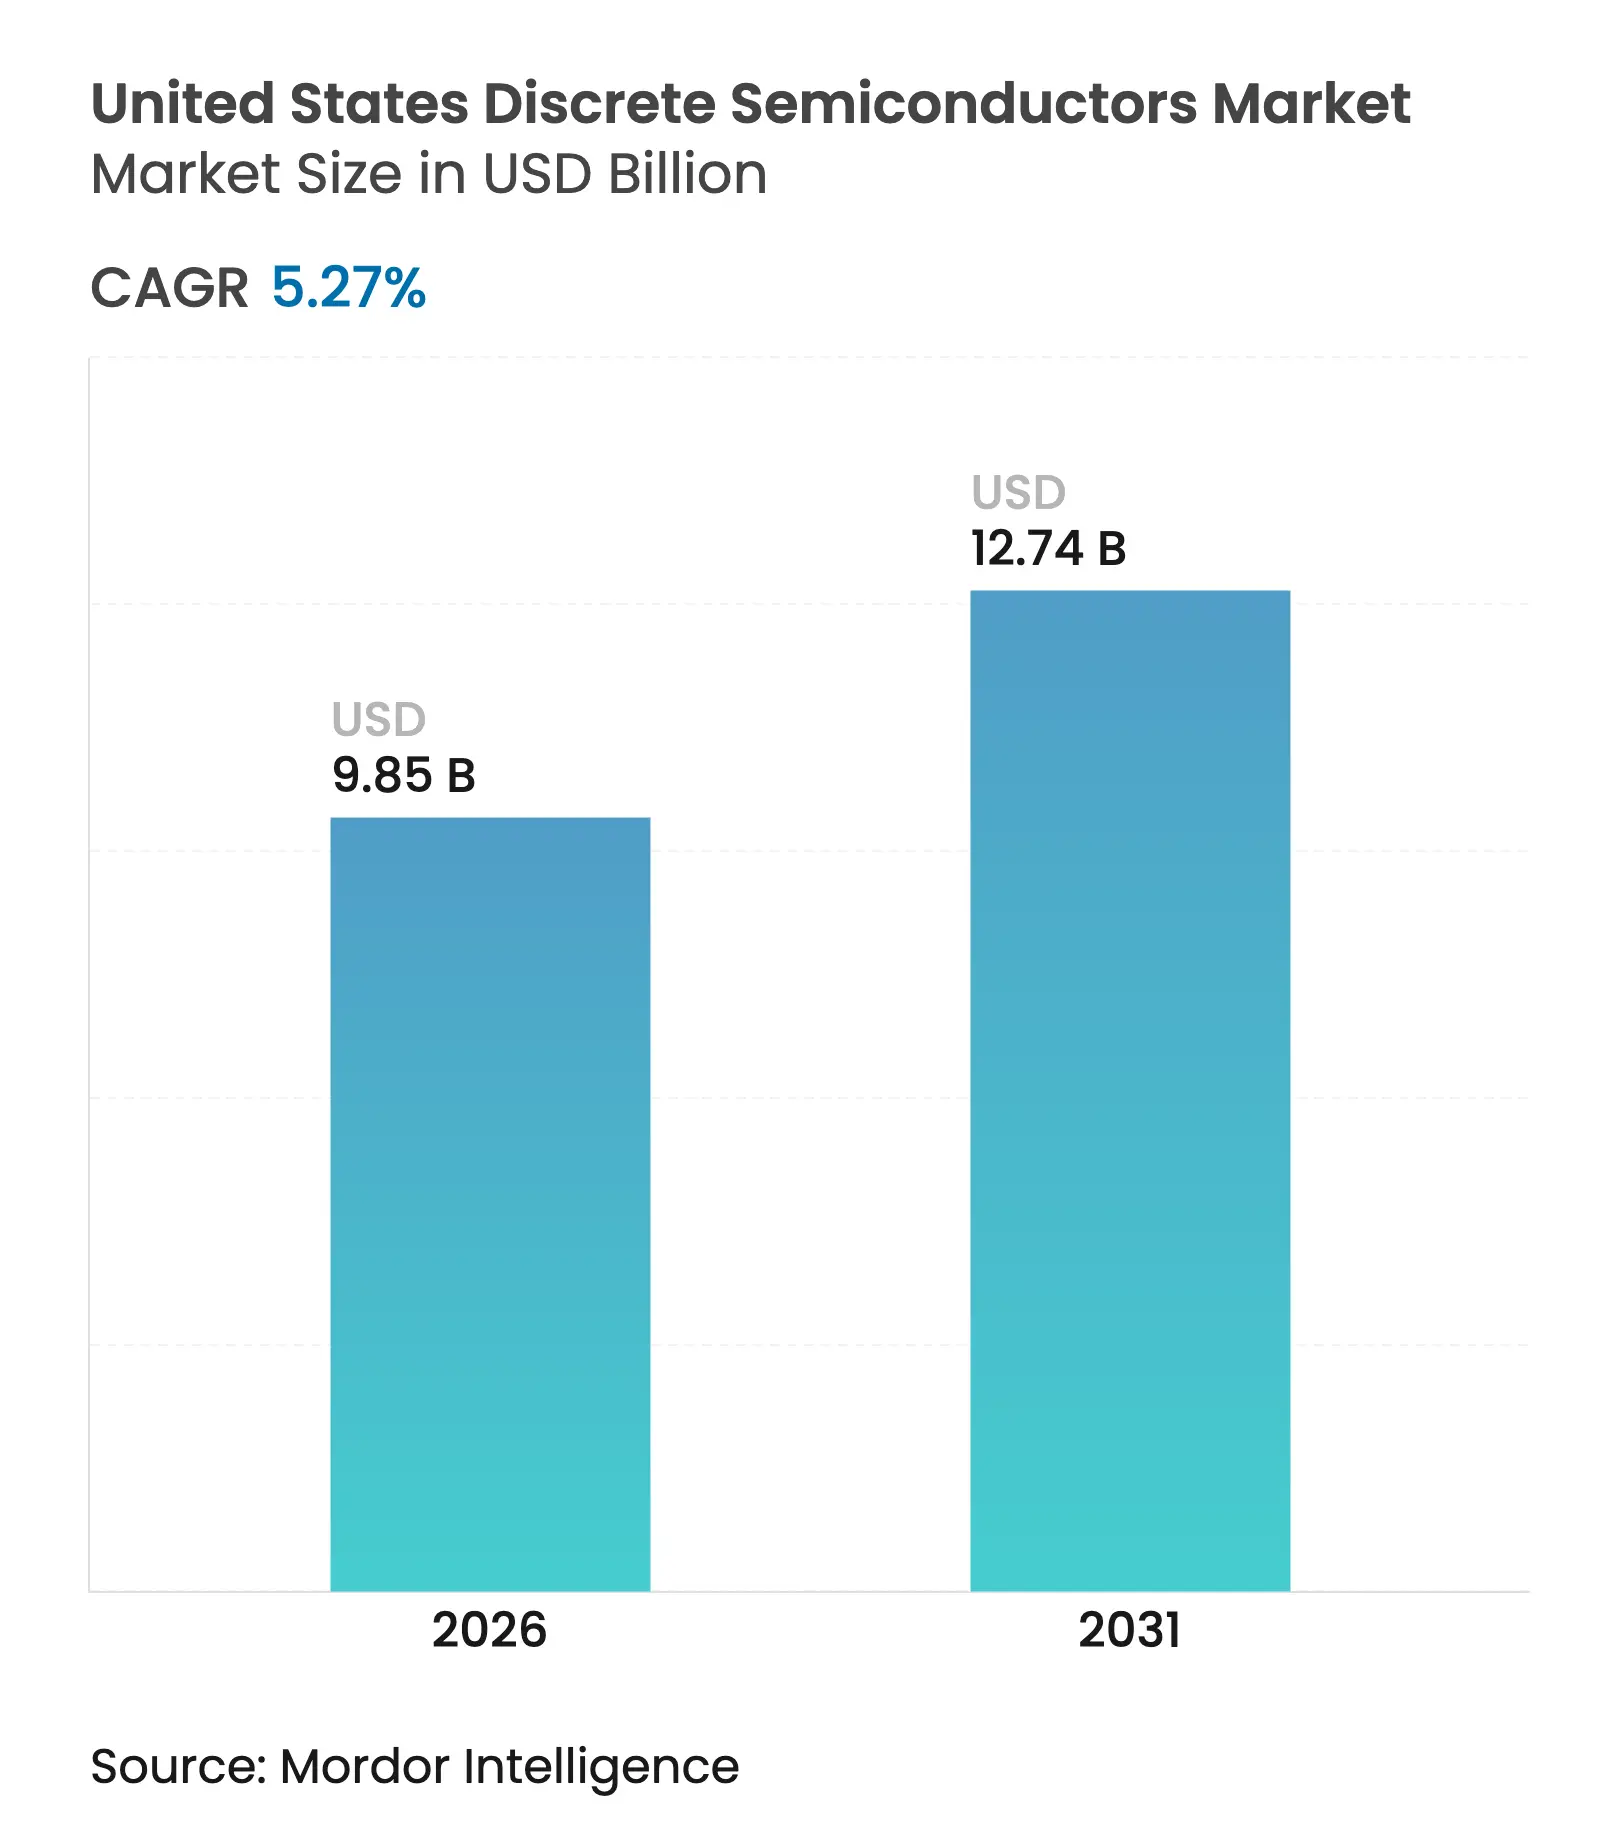
The United States discrete semiconductors market size in 2026 is estimated at USD 9.85 billion, growing from 2025 value of USD 9.36 billion with 2031 projections showing USD 12.74 billion, growing at 5.27% CAGR over 2026-2031. Steady policy support under the CHIPS and Science Act, rapid electrification of vehicles, and data-centre efficiency mandates shaped demand patterns, pushing suppliers toward wide-bandgap materials and domestic capacity additions. Federal incentives awarded to Intel, Micron, and TSMC signalled a long-term realignment of the supply base toward U.S. fabs.[1]U.S. Department of Commerce, “Biden-Harris Administration Announces Preliminary Terms with TSMC Arizona,” commerce.gov Consumer devices still anchored high-volume sales, yet automotive traction inverters, grid-scale storage, and 5G infrastructure supplied faster growth lanes. The wide adoption of silicon carbide (SiC) and gallium nitride (GaN) devices helped suppliers defend margins even as traditional silicon pricing softened. Supply-chain resiliency and vertical integration became core competitive themes as producers sought to control substrate access, process know-how, and customer relationships.
Key Report Takeaways
Note: Market size and forecast figures in this report are generated using Mordor Intelligence's proprietary estimation framework, updated with the latest available data and insights as of 2026.
Drivers Impact Analysis
| Driver | (~) % Impact on CAGR Forecast | Geographic Relevance | Impact Timeline | |||
|---|---|---|---|---|---|---|
Electrification push – adoption of SiC and GaN power
devices by U.S. automakers
Electrification push – adoption of SiC and GaN power
devices by U.S. automakers
| +1.2% | Michigan, California, Texas | Medium term (2-4 years) |
(~) % Impact on CAGR Forecast
:
+1.2%
|
Geographic Relevance
:
Michigan, California, Texas
|
Impact Timeline
:
Medium term (2-4 years)
|
Renewable-energy inverters and storage deployment
Renewable-energy inverters and storage deployment
| +0.8% | California, Texas, New York | Long term (≥4 years) | |||
CHIPS Act-backed expansion of domestic discrete fabs
CHIPS Act-backed expansion of domestic discrete fabs
| +0.9% | Arizona, New York, Ohio, Texas | Long term (≥4 years) | |||
5G and edge-compute infrastructure roll-out driving RF discrete
5G and edge-compute infrastructure roll-out driving RF discrete
| +0.6% | Urban centres, data-centre hubs | Medium term (2-4 years) | |||
Data-centre efficiency mandates boosting power MOSFET
demand
Data-centre efficiency mandates boosting power MOSFET
demand
| +0.7% | Virginia, Texas, California | Short term (≤2 years) | |||
Defense and aerospace need for rad-hard discrete
Defense and aerospace need for rad-hard discrete
| +0.4% | Defense-contractor regions | Long term (≥4 years) | |||
| Source: Mordor Intelligence | ||||||
Electrification push
Federal zero-emission targets nudged automakers toward wide-bandgap power electronics that outperformed legacy silicon. onsemi secured a multi-year order from Volkswagen Group for EliteSiC MOSFETs that improved inverter efficiency and vehicle range. Tesla’s early SiC traction-inverter design reduced switching losses, setting a performance benchmark that rivals followed. Premium electric platforms migrating from 400 V to 800 V architectures demanded devices capable of higher blocking voltages that conventional insulated-gate bipolar transistors could not meet. Infineon unveiled trench-based SiC super junction technology that lowered specific on-resistance by up to 40%, enabling more compact drive units. Growing model diversity, including pickups and commercial vans, widened the total addressable market for high-current discrete. The scale effect encouraged suppliers to ramp 200 mm SiC wafers, easing cost barriers for mass production.
Renewable-energy inverters and storage deployment
Battery energy-storage capacity in the United States reached more than 30 GW by 2024, nearly doubling year-on-year and stimulating demand for high-voltage discrete.[2]U.S. Energy Information Administration, “U.S. Battery Storage Capacity Expected to Nearly Double in 2024,” eia.gov California led with 7.3 GW installed, followed by Texas at 3.2 GW, creating regionally concentrated pull for SiC MOSFETs and Schottky diodes. ROHM introduced 2 kV SiC devices adopted in SMA’s Sunny Central FLEX inverter platform, delivering efficiency gains for utility-scale solar plants. The shift from centralized generation toward distributed resources required faster switching and embedded protection features to stabilize micro-grids. Federal tax credits for storage under the Inflation Reduction Act further strengthened forward order books for power discrete. Suppliers that paired module-level monitoring with discrete switches gained a differentiation edge in grid services markets.
CHIPS Act-backed expansion of domestic fabs
The CHIPS and Science Act awarded USD 8.5 billion to Intel, USD 6.6 billion to TSMC, and USD 6.1 billion to Micron, anchoring fresh wafer capacity on U.S. soil. Texas Instruments secured USD 1.61 billion for new 300 mm lines, while Wolfspeed received USD 750 million for its John Palmour Silicon Carbide Centre. GlobalFoundries committed USD 16 billion to expand New York and Vermont facilities for AI-oriented chips. These incentives trimmed geopolitical supply risk and encouraged integrated-device manufacturers to localize value chains. Regional clusters forming in Arizona, Texas, and New York accelerated ecosystem effects, attracting tool vendors, substrate suppliers, and academic talent. Long capital lead times hinted at capacity tailwinds extending well beyond the forecast horizon.
5G and edge-compute infrastructure roll-out
Nationwide 5G densification demanded high-frequency RF switches and low-loss power amplifiers that exceeded bulk-silicon limits. Finwave collaborated with GlobalFoundries to advance GaN-on-silicon MISHEMT technology for 5G, 6G, and Wi-Fi 7 front-end modules. Commercial electricity use in data-centre states such as Virginia rose by 14 billion kWh from 2019 to 2023, reflecting server-farm and edge-node buildouts. Qorvo’s latest RF discrete promised higher linearity and reduced heat generation, critical for rooftop radio units. Edge-computer nodes in autonomous-vehicle corridors required ultra-low latency links, further tightening performance specs for discrete components. These developments positioned GaN and GaAs discrete devices as enablers of bandwidth expansion in densely populated corridors.
Restraints Impact Analysis
| Restraint | (~) % Impact on CAGR Forecast | Geographic Relevance | Impact Timeline | |||
|---|---|---|---|---|---|---|
System-in-package and power-module integration
cannibalizing discrete
System-in-package and power-module integration
cannibalizing discrete
| -0.6% | Advanced manufacturing regions | Medium term (2-4 years) |
(~) % Impact on CAGR Forecast
:
-0.6%
|
Geographic Relevance
:
Advanced manufacturing regions
|
Impact Timeline
:
Medium term (2-4 years)
|
Scarcity and cost of 150 mm+ SiC substrates
Scarcity and cost of 150 mm+ SiC substrates
| -0.4% | Global supply chain | Short term (≤2 years) | |||
High U.S. fab capital expenditure despite incentives
High U.S. fab capital expenditure despite incentives
| -0.3% | National | Long term (≥4 years) | |||
Volatile consumer-electronics cycles
Volatile consumer-electronics cycles
| -0.5% | National | Short term (≤2 years) | |||
| Source: Mordor Intelligence | ||||||
System-in-package and power-module integration
OEMs looked to cut board area and thermal paths by collapsing multiple discrete paths into single modules. Infineon’s CoolSET system-in-package, rated for 60W, replaced clusters of supervisor ICs and MOSFETs within compact adapters. ROHM’s 4-in-1 SiC modules in HSDIP20 packages delivered triple the power density of discrete assemblies without raising case temperature. Automakers favoured integrated onboard chargers that eased assembly and boosted reliability under harsh vibration. In data centres, power-module suppliers delivered fully enclosed converters that reduced parts counts and service calls. Discrete vendors were compelled to demonstrate unique electrical figures of merit or co-develop module architectures to stay in design cycles.
Scarcity and cost of large SiC substrates
Global output of 150 mm SiC boules lagged demand, lifting wafer prices and complicating ramp schedules for capacity additions. Wolfspeed, Infineon, and onsemi invested in crystal-growth furnaces, yet yield learning curves remained steep. Substrate shortages lengthened automotive qualification timelines and forced some inverter makers to dual-source silicon and SiC options. High wafer costs inflated final device pricing, leaving cost-sensitive segments such as residential solar in the silicon camp. Suppliers that locked long-term substrate agreements or pursued vertical integration shielded themselves from near-term volatility.
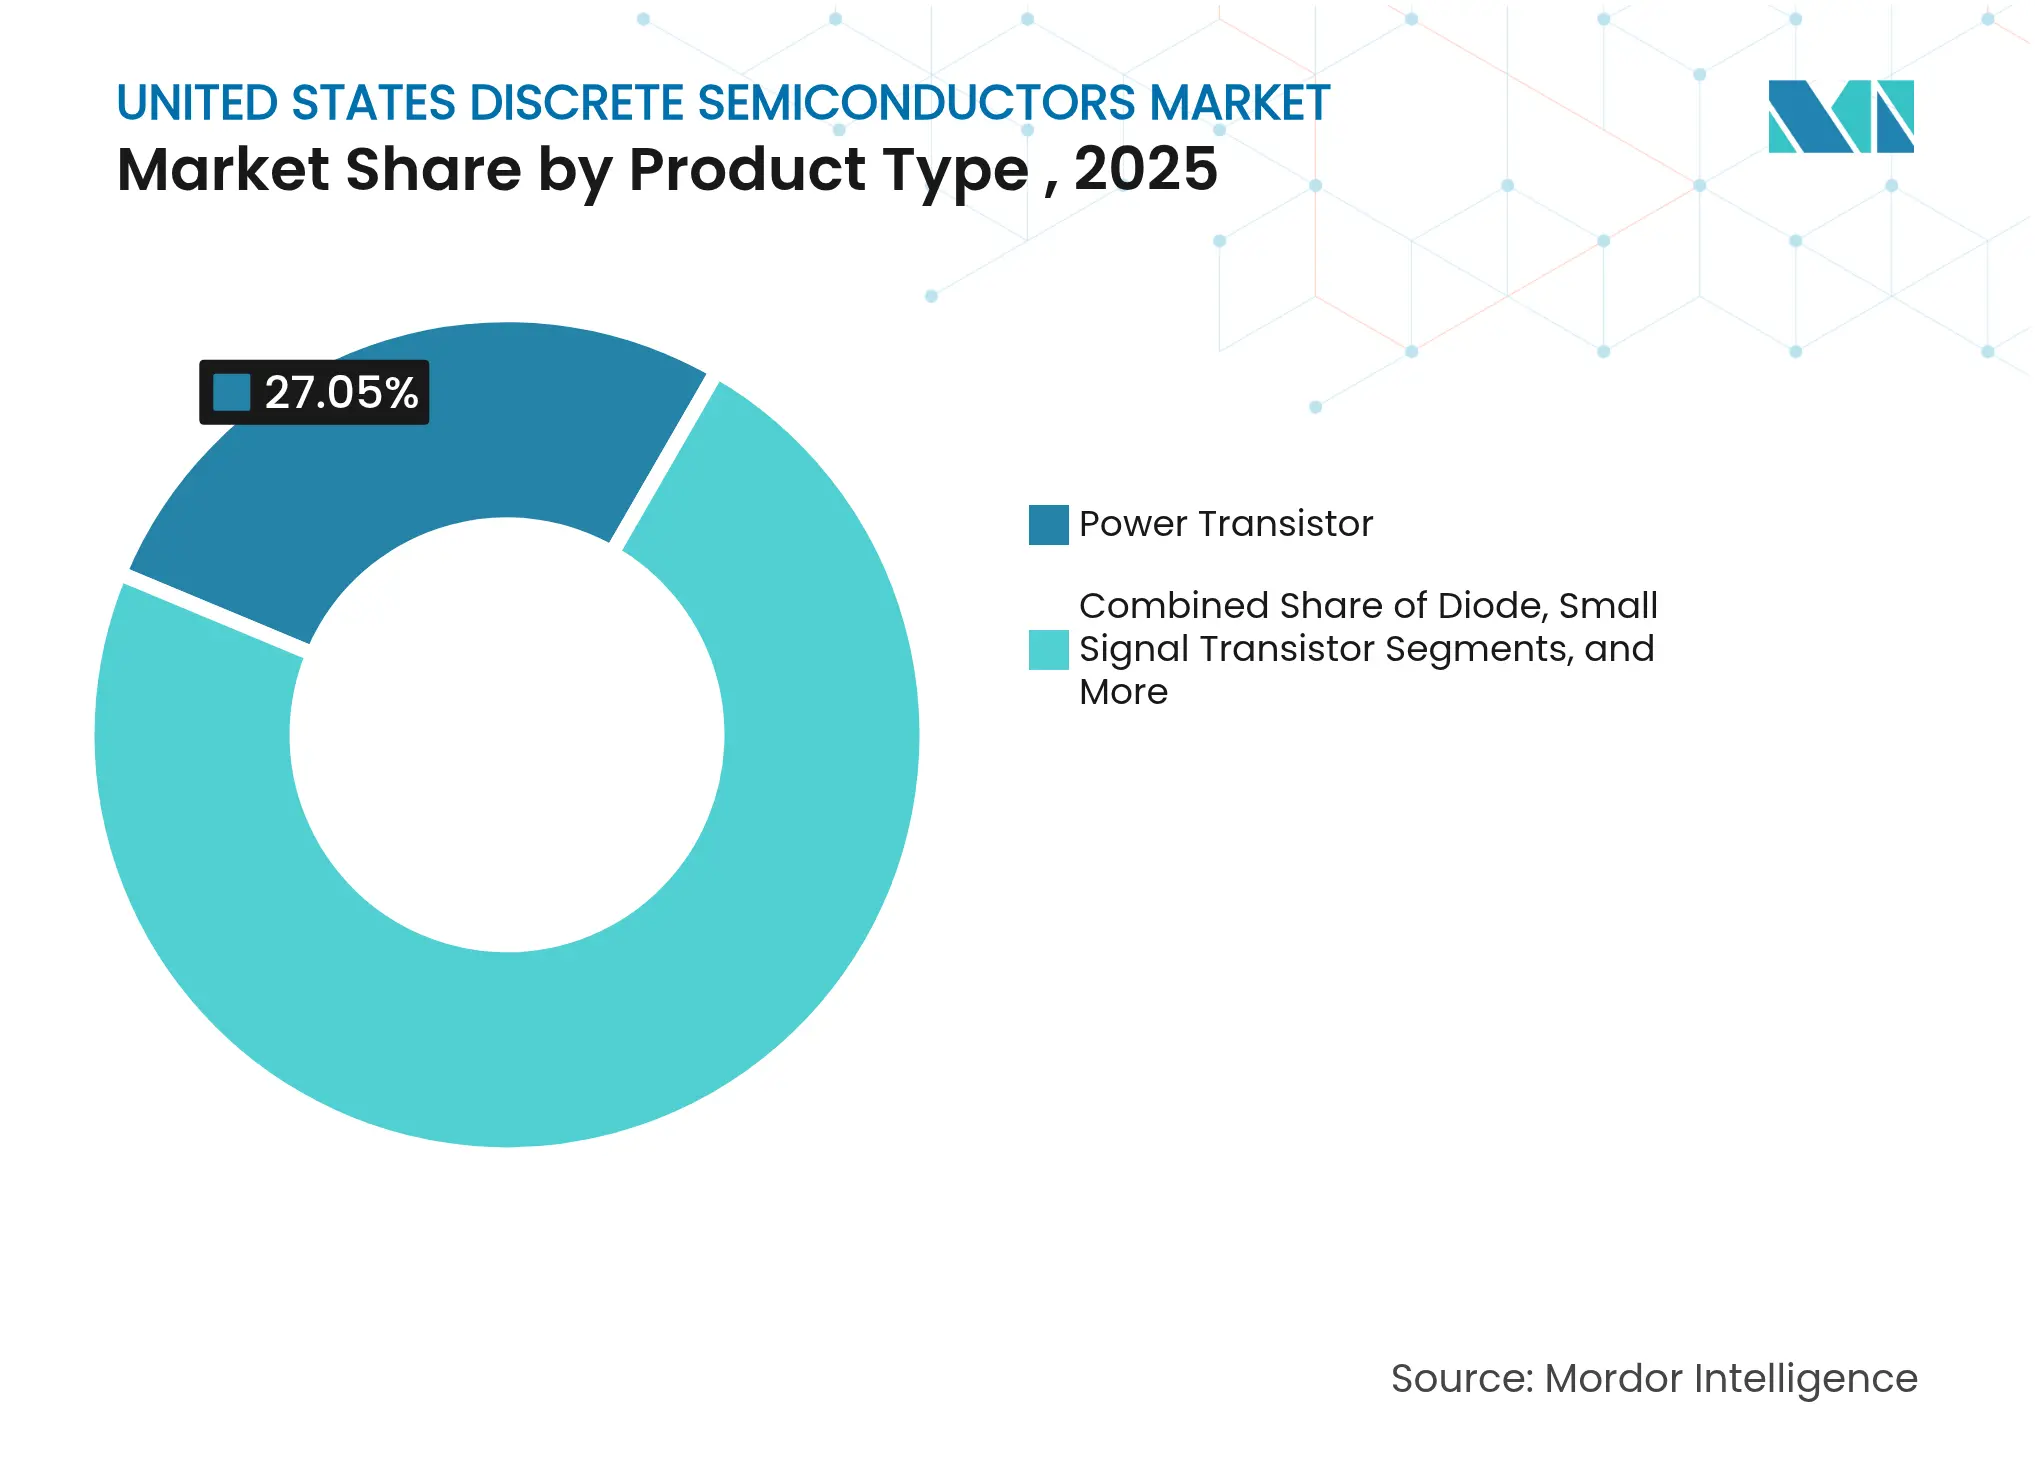
By Product Type – power transistors anchor electrification gains
Power transistors captured 27.05% revenue in 2025 as automakers, renewable-energy developers, and AI data-centre builders demanded efficient switching solutions. The United States discrete semiconductors market size for power transistors was forecast to climb at a 10.01% CAGR, underpinning overall sector expansion. MOSFETs led within the category thanks to fast switching and ruggedness, while insulated-gate bipolar transistors held niches in high-voltage industrial drives. onsemi reported a 50% cut in turn-off losses with its EliteSiC M3e MOSFET family, supporting compact traction inverters.
Small-signal transistors supported RF front ends and precision analog functions, whereas thyristors and rectifiers served grid-tied conversion. Diodes Incorporated released SiC Schottky variants with industry-leading figure-of-merit that enhanced server-supply efficiency. The mix shift toward high-margin wide-bandgap devices preserved average selling prices despite silicon commoditization. Design engineers valued discrete form factors for serviceability and thermal de-risking even as module integration advanced. As a result, the United States discrete semiconductors market continued to rely on stand-alone transistors for fast-paced prototyping and diverse voltage classes.
Note: Segment shares of all individual segments available upon report purchase
By Material – silicon dominance eroded by wide-bandgap
Silicon held 85.45% revenue in 2025 yet ceded share to SiC, which booked an 17.95% CAGR through 2031. Infineon began sampling 200 mm SiC wafers out of Villach and Kulim, bringing scale economies closer to silicon pricing. The United States discrete semiconductors market share for SiC was expected to widen as automotive 800 V platforms proliferated.
Gallium nitride addressed high-frequency power supplies and RF amplifiers, with Infineon unveiling 300 mm GaN wafers that yielded 2.3 times more chips per substrate. GaAs and silicon-germanium kept their roles in millimetre-wave radios and high-speed logic. Material migration was governed by the physics limits of silicon on switching speed and breakdown field. Yield improvements, substrate supply contracts, and integration of passive elements on the same die became deciding factors for cost parity.
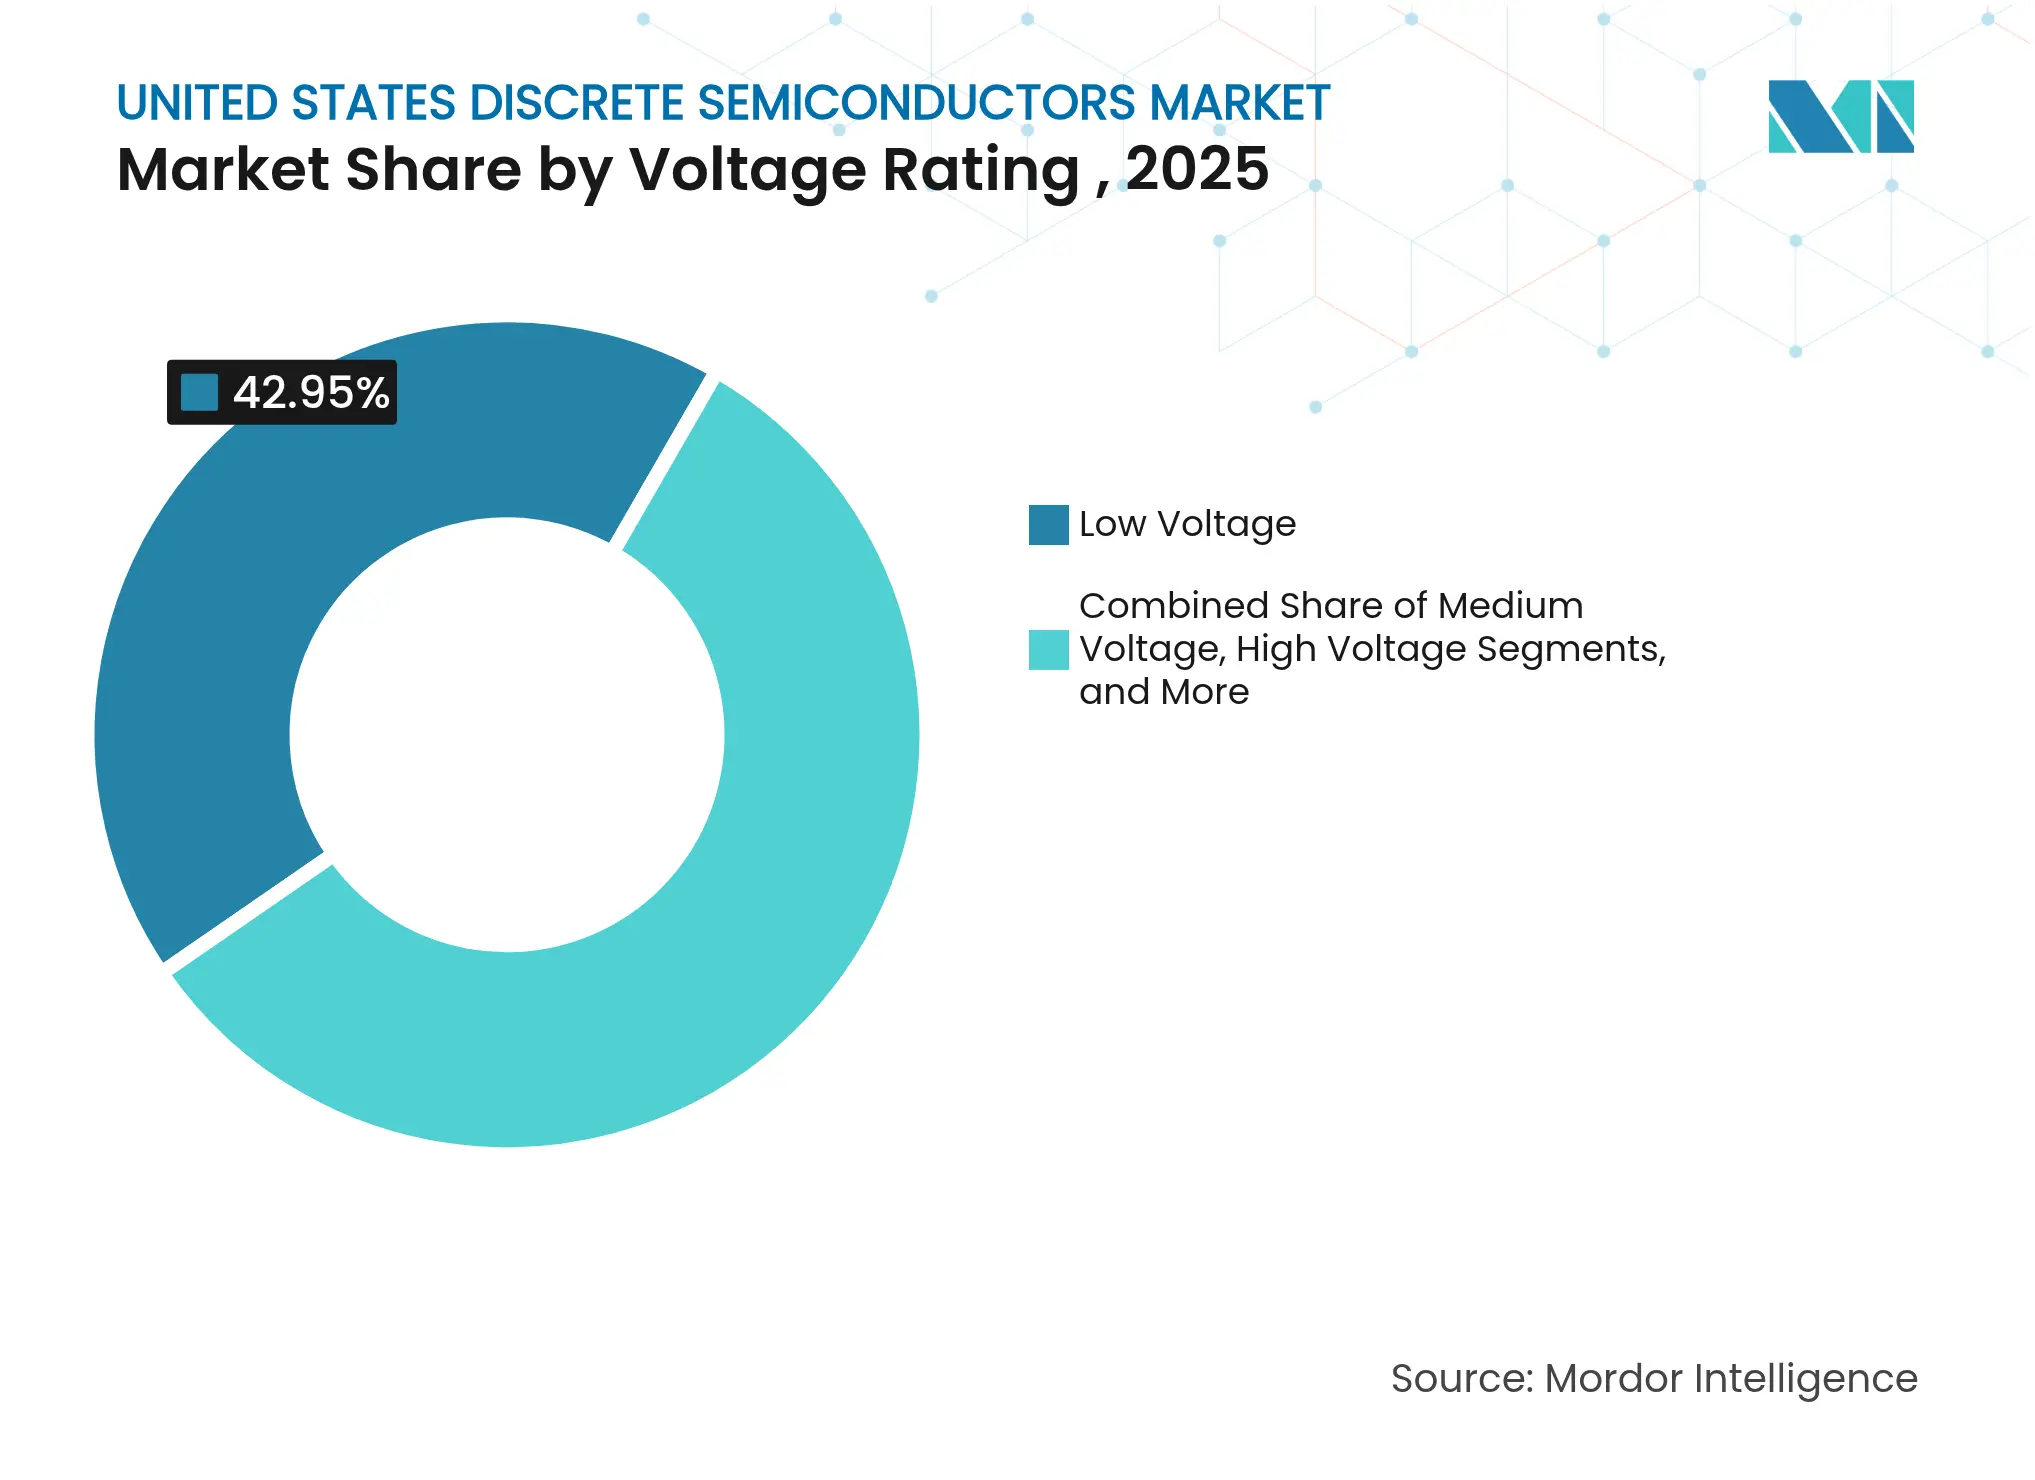
By Voltage Rating – low-voltage breadth meets ultra-high-voltage surge
Low-voltage devices below 40 V commanded 42.95% revenue in 2025, reflecting their ubiquity in consumer gadgets, automotive body electronics, and server motherboards. Medium-voltage ranges up to 600 V served motor drives and telecom rectifiers, while 600 V to 1200 V parts powered traction inverters and solar inverters. Devices above 1200 V expanded at a 12.32% CAGR, making them the fastest tier within the United States discrete semiconductors market.
ROHM’s 2 kV SiC MOSFET addressed central solar inverters where higher string voltages cut cable losses. Tesla’s move to 800 V battery packs increased demand for 1200 V diodes and MOSFETs. Utilities piloted solid-state transformers that required even higher ratings, validating roadmaps toward 3 kV discrete. Vendors balanced die shrinking to manage cost with thicker epitaxial layers to secure avalanche ruggedness, a key reliability metric in grid gear.
Note: Segment shares of all individual segments available upon report purchase
By Packaging Type – surface-mount strength faces miniaturization
Surface-mount formats represented 66.55% revenue in 2025 due to automated placement and double-sided cooling options. Through-hole parts retained value in harsh-environment drives where mechanical stress was high. Wafer-level and chip-scale packages expanded at 10.73% CAGR, the fastest pace in the United States discrete semiconductors market. Vishay introduced 600 V TMBS rectifiers in 3 mm × 3 mm DFN packages that delivered 9 A forward current, underscoring density gains.
Nexperia launched automotive-qualified 1200 V SiC MOSFETs in D2PAK-7 that merged low parasitic with copper clip technology, improving thermal resistance. Data-centre operators prioritized bottom-side cooling, inspiring novel gull-wing designs. As power density climbed, substrate and moulding compounds with higher thermal conductivity became critical. Packaging advances thus evolved in lockstep with material shifts to realize full device potential.
By End-user Industry – electronics leadership pivots to mobility
Consumer electronics accounted for 29.45% revenue in 2025, yet its growth trailed automotive and e-mobility, which recorded a 14.26% CAGR. Companies such as Texas Instruments confirmed double-digit automotive growth while noting seasonal softness in personal devices. The United States discrete semiconductors market size for electric-drive applications widened as federal mileage targets tightened.
Industrial automation delivered steady base orders for motor-drive IGBTs and protection diodes. Communication infrastructure, including 5G base stations, demanded RF switches with stringent linearity specs. Energy and power utilities broadened discrete uptake through storage projects and smart-grid upgrades. Aerospace and defense programs required radiation-hardened MOSFETs qualified to MIL-PRF-19500 standards, a niche that Microchip addressed with 300 krad capability parts. End-market diversification lowered revenue cyclicality and supported premium pricing for specialized parts.

Note: Segment shares of all individual segments available upon report purchase
By Application – power conversion dominance reinforced by RF climb
Power conversion represented 42.15% of 2025 revenue, as every electronic system required efficient voltage translation. Signal amplification and switching functions followed, serving instrumentation and factory automation. RF and microwave discretes expanded at 9.36% CAGR on the back of 5G macro buildouts and advanced driver-assistance radar.
Texas Instruments announced single-chip lidar laser drivers and high-reliability clocks that highlighted discrete innovation beyond mere power handling. Data-center operators projected that AI workloads could consume 9% of U.S. electricity by 2030, spurring MOSFET retrofits in server power supplies. Protection and isolation devices, such as transient-voltage suppressors, are gained from stricter automotive functional-safety norms. Integration trends challenged standalone parts, yet design freedom and serviceability kept discrete at the heart of fast-moving prototypes.
Arizona emerged as a manufacturing magnet after TSMC committed USD 6.6 billion and Intel won USD 8.5 billion in federal grants, catalysing supplier ecosystems around Phoenix. Texas blended legacy fabs with growing EV and server markets; Texas Instruments enlarged its Richardson campus while GlobalFoundries earmarked USD 16 billion for new modules in the state. New York attracted Micron’s USD 200 billion multiphase memory and logic investment, reinforcing a Northeast corridor of wafer and tool producers.
California stayed the design epicentre, generating pull for prototype runs and specialty SiC MOSFETs used in its 7.3 GW installed battery-storage base. Virginia’s data-centre alley lifted discrete demand for hot-swap controllers and power FETs, with electricity consumption adding 14 billion kWh over four years. Ohio and other Midwest states leveraged automotive heritages to anchor inverter assembly plants that favoured locally sourced discrete parts.
Defense contractors in Idaho and Oregon relied on onsemi Category 1A trusted foundries for radiation-hard parts that met secure-supply criteria. Regional clusters reduced freight risk and shortened development cycles through proximity to customers. State-level tax credits and workforce training grants further amplified CHIPS Act incentives, creating virtuous loops of capital, talent, and infrastructure.
Market Concentration
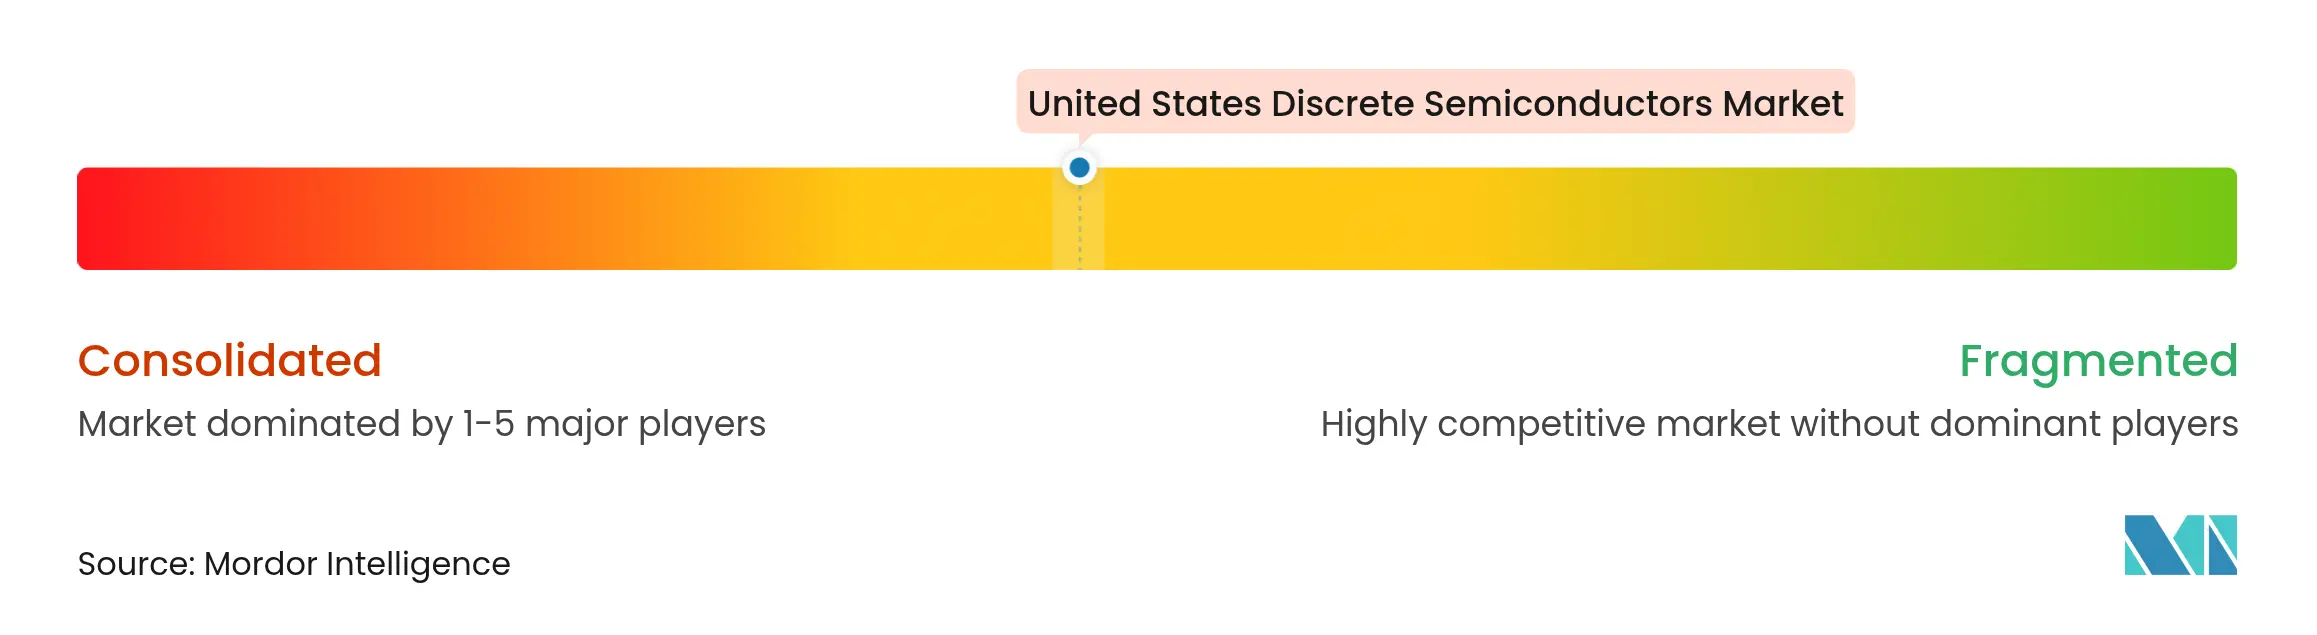
The market featured moderate fragmentation, with top players extending reach through vertical integration and material specialization. Infineon pioneered 300 mm GaN wafers, increasing die counts per batch and lowering cost curves. onsemi paired wafer production in New Hampshire with end-device assembly in the Czech Republic, ensuring cradle-to-grave control over SiC MOSFET quality. Texas Instruments leveraged its internal 300 mm analog fabs to supply automotive and industrial customers at scale, insulating against foundry swings.
White-space opportunities attracted niche entrants focusing on aerospace and high-temperature oil-field tools. However, high substrate costs and qualification cycles deterred many startups. Larger incumbents sealed long-term capacity deals with automakers, locking in offtake volumes. onsemi’s USD 115 million purchase of Qorvo’s SiC JFET line broadened its patent portfolio and removed a potential rival.
Operational execution remained a decisive factor, as SiC yields lagged behind bulk silicon. Companies that aligned R&D with captive substrate output and advanced testing platforms mitigated scrap risk. Customer co-development agreements, such as Infineon’s work with SMA Solar on 2 kV inverters, ensured design-win stickiness under multiyear supply clauses. Overall, success hinged on marrying material science, packaging expertise, and localized manufacturing grants.

*Disclaimer: Major Players sorted in no particular order
1. INTRODUCTION
2. RESEARCH METHODOLOGY
3. EXECUTIVE SUMMARY
4. MARKET LANDSCAPE
5. MARKET SIZE AND GROWTH FORECASTS (VALUE)
6. COMPETITIVE LANDSCAPE
7. MARKET OPPORTUNITIES AND FUTURE OUTLOOK
Market Definitions and Key Coverage
Our study defines the United States discrete semiconductors market as all individually packaged silicon, silicon carbide, and gallium nitride devices, including diodes, rectifiers, power MOSFETs, IGBTs, thyristors, and RF transistors, manufactured in, imported into, or shipped within the country for commercial or defense use.
Scope exclusion (clarification). Integrated circuits, sensors, and optoelectronic components are excluded to avoid double counting and to keep focus on strictly discrete devices.
Segmentation Overview
Detailed Research Methodology and Data Validation
Primary Research
Mordor analysts interviewed device fabrication engineers, distribution executives, and purchasing managers across California, Texas, New York, and Arizona. Conversations validated material mix shifts, ASP movements, and downstream demand in automotive, data center, and defense applications, thereby filling gaps that public sources leave.
Desk Research
We first gathered shipment, production, and trade volumes from tier 1 public datasets such as the U.S. Census Bureau's HTS 8541 trade tables, Federal Reserve industrial production indexes for electronic components, and Semiconductor Industry Association sales trackers. Supplemental cues on electric vehicle output and utility scale renewables came from the Department of Energy and the Energy Information Administration, while patent family counts were reviewed through Questel to gauge wide bandgap adoption. Company filings and investor presentations enriched device level average selling prices, and D&B Hoovers provided revenue splits for domestic fabs. This list is illustrative; numerous other open publications supported data collection and cross checks.
Market Sizing and Forecasting
A top down model reconstructs national demand from domestic output plus net imports, which are then reconciled with selective bottom up roll ups of leading supplier revenues and sampled ASP × volume checks. Key variables include electric vehicle unit shipments, renewable energy inverter installations, 5G base station deployments, domestic wafer fab capacity additions, and the SiC device penetration ratio. Multivariate regression, benchmarked against primary expert consensus, projects each driver through 2030; scenario analysis captures upside tied to CHIPS Act incentives. Any bottom up gaps, for example confidential military contracts, are bridged with validated proxy ratios derived from historical contract disclosures.
Data Validation and Update Cycle
Outputs pass anomaly screens, variance checks against independent indices, and multi level analyst reviews before sign off. We refresh every twelve months and trigger interim updates when policy shifts, major fab expansions, or material pricing swings occur; a brief final audit is completed just before delivery.
Why Mordor's United States Discrete Semiconductors Baseline Commands Reliability
Benchmark comparison
Published estimates often diverge because firms apply different device scopes, currency conversions, and refresh cadences.
Key gap drivers here include the inclusion of hybrid power modules by some publishers, the exclusion of military grade lots by others, and contrasting ASP escalation paths. Mordor selects a device pure scope, applies trade weighted ASPs, and updates the model annually, which steadies our 2025 baseline.
| Market Size | Anonymized source | Primary gap driver | ||
|---|---|---|---|---|
USD 9.36 Bn (2025) | Mordor Intelligence | Anonymized source:Mordor Intelligence | Primary gap driver: | |
USD 17.09 Bn (2023) | Global Consultancy A | Counts North American totals and optoelectronic hybrids; no trade reconciliation | ||
USD 7.91 Bn (2023) | Industry Tracker B | Vendor survey only; omits SiC modules and defense contracts |
Pricing Strategy for Semiconductor Components
3 Min Read
Accelerating Additive Manufacturing Adoption in India
3 Min Read
When decisions matter, industry leaders turn to our analysts. Let’s talk.