Market Overview
| Study Period | 2021 - 2031 |
|---|---|
| Forecast Data Period | 2026 - 2031 |
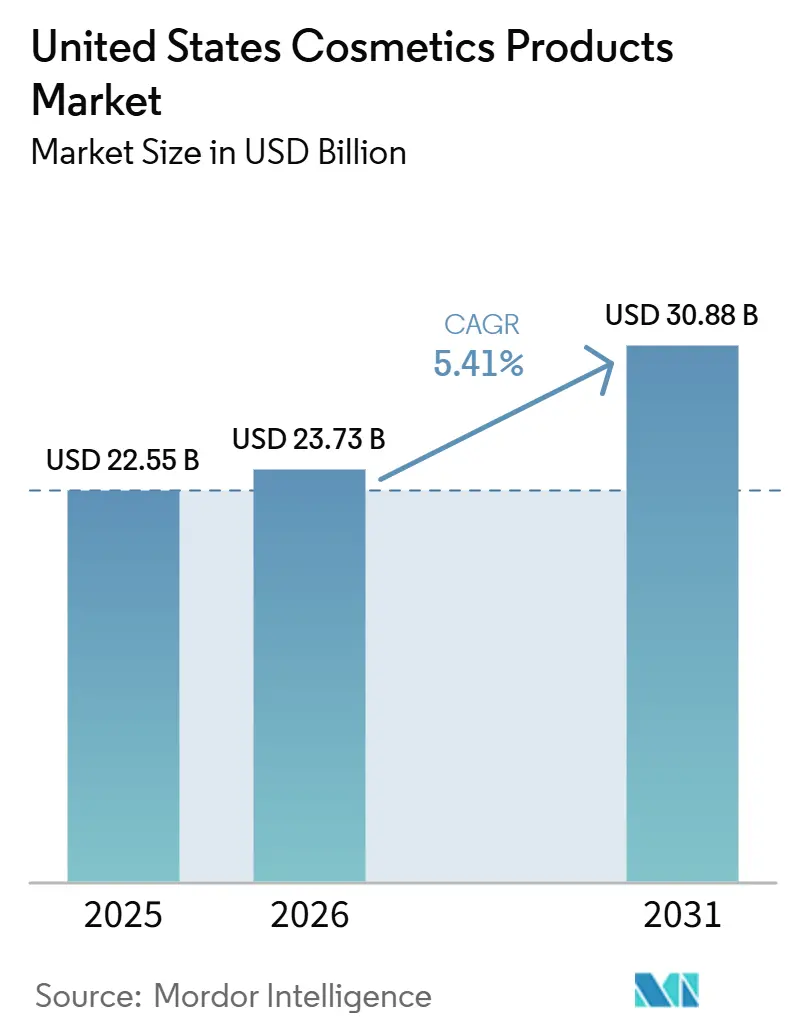
| Base Year Market Size (2025) | USD 22.55 Billion |
| Market Size (2026) | USD 23.73 Billion |
| Market Size (2031) | USD 30.88 Billion |
| Growth Rate (2026 - 2031) | 5.41% CAGR |
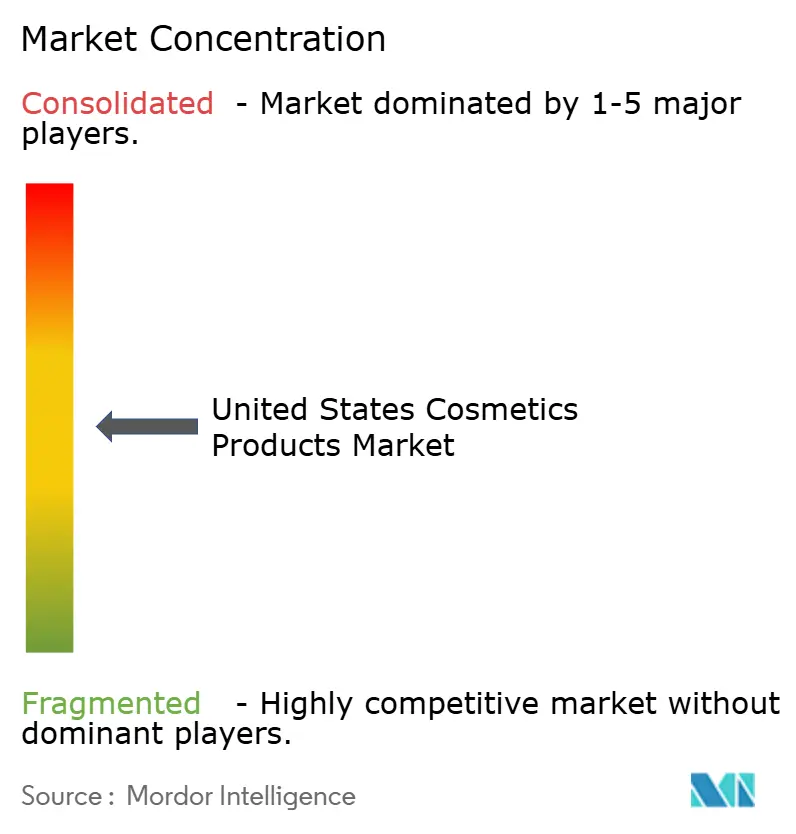
| Market Concentration | Medium |
Major Players
*Disclaimer: Major Players sorted in no particular order Image © Mordor Intelligence. Reuse requires attribution under CC BY 4.0. |
|
United States Cosmetics Products Market Analysis by Mordor Intelligence
The United States cosmetics products market size is expected to grow from USD 22.55 billion in 2025 to USD 23.73 billion in 2026 and is forecast to reach USD 30.88 billion by 2031 at 5.41% CAGR over 2026-2031. Despite tightening discretionary budgets, consumers increasingly consider beauty products essential. This trend, along with a shift from mass-market products to premium, "clean," and digitally-focused offerings, is transforming the competitive landscape. Millennials and Gen Z, in particular, are driving demand for clean, natural, and organic beauty products. They prefer cosmetics free from harmful chemicals, often labeled as clean, vegan, or cruelty-free. This preference is prompting brands to innovate with eco-friendly formulations and sustainable packaging. While mass-market channels continue to dominate revenue streams, they are experiencing margin pressures. Supermarkets and hypermarkets are losing online market share to platforms like Amazon, TikTok Shop, and brand-specific websites. In response, established players are utilizing AI and vertical integration to strengthen their market position. However, agile newcomers focusing on traceability and community-driven marketing are gaining significant cultural influence.
Key Report Takeaways
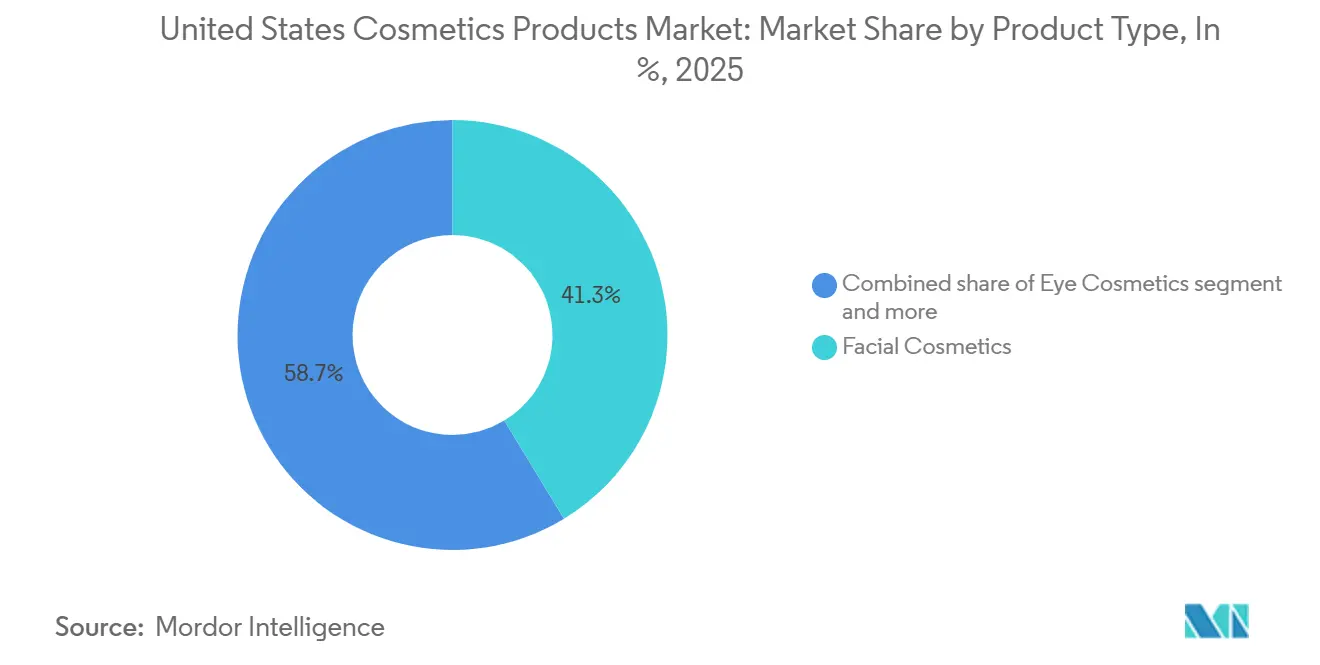
- By product type, facial cosmetics led with 41.32% of the United States cosmetics products market share in 2025, whereas lip and nail make-up products are advancing at the fastest 6.38% CAGR through 2031.
- By category, mass products held a 55.84% share of the United States cosmetics products market size in 2025, while premium products recorded the highest 6.89% CAGR to 2031.
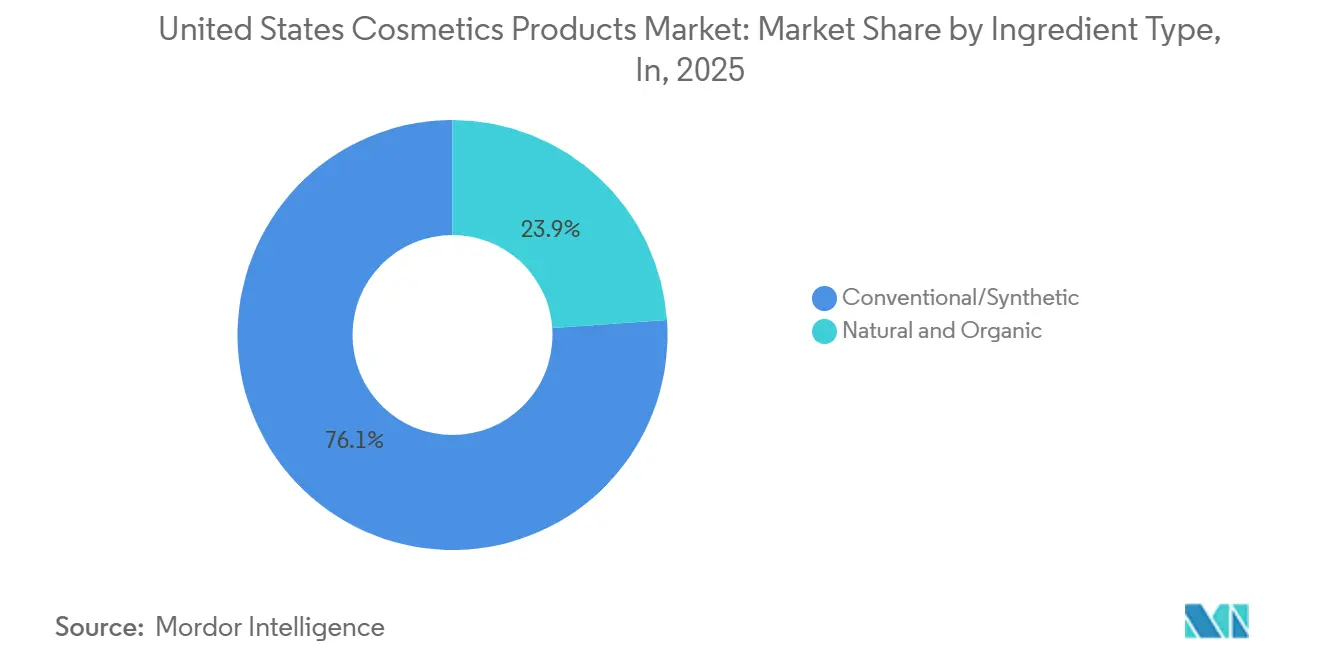
- By ingredient type, conventional synthetic formulations commanded 76.12% of 2025 volume, yet natural and organic alternatives are expanding at a 7.62% CAGR through 2031.
- By distribution channel, supermarkets and hypermarkets accounted for 41.65% of 2025 revenue, but online retail stores are growing at a 6.76% CAGR, the quickest among all channels.
Note: Market size and forecast figures in this report are generated using Mordor Intelligence’s proprietary estimation framework, updated with the latest available data and insights as of 2026.
United States Cosmetics Products Market Trends and Insights
Drivers Impact Analysis*
| Driver | (~) % Impact on CAGR Forecast | Geographic Relevance | Impact Timeline |
|---|---|---|---|
| Social media influence boosting market demand | +0.8% | National, with concentration in urban markets and coastal states | Short term (≤ 2 years) |
| Clean/organic beauty demand among Millennials and Gen Z | +1.1% | National, strongest in California, New York, Pacific Northwest | Medium term (2-4 years) |
| Technological advancements in product formulations | +0.7% | National | Medium term (2-4 years) |
| Premiumization of cosmetics product supports growth | +0.9% | National, elevated in high-income metropolitan areas | Medium term (2-4 years) |
| AI-powered personalization boosting demand | +0.6% | National, early adoption in tech-forward markets | Long term (≥ 4 years) |
| Increasing disposable income drives market expansion | +0.5% | National, with regional variations tied to employment trends | Long term (≥ 4 years) |
| Source: Mordor Intelligence | |||
Clean/Organic Beauty Demand Among Millennials and Gen Z
Millennials and Gen Z are significantly boosting beauty spending, with their emphasis on ingredient transparency driving changes in industry formulation strategies. Beginning January 2025, California's "Right to Know Act" will require brands to disclose fragrance components, removing the "trade secret" protection that legacy brands have relied on for decades. This regulatory change increases consumer skepticism; for example, Gen Z frequently cross-references ingredient lists with third-party databases, relying on crowdsourced platforms for quality assurance. According to 2024 data from the U.S. Census Bureau, Millennials account for 74.19 million people, while Gen Z numbers 70.79 million in the United States[1]Source: U.S. Census Bureau, "National Population by Characteristics: 2020-2024", census.gov. Brands that voluntarily disclose ingredient origins, such as supply-chain details for mica or palm derivatives, are gaining a larger share of this consumer base. However, the lack of a federal definition for "clean" creates a fragmented market, with California's standards effectively becoming the national benchmark for premium branding.
AI-Powered Personalization Boosting Demand
AI-powered personalization is revolutionizing the U.S. cosmetics market by advancing product customization, enhancing shopping experiences, and driving product innovation. Estée Lauder's 2024 partnership with Microsoft and OpenAI to create an AI Innovation Lab signifies a transition from mass customization to large-scale hyper-personalization. The lab's implementation of over 240 customized GPT models covers diverse applications: from AI-enabled fragrance development, which interprets olfactory preferences through digital interactions, to accelerated clinical trial designs that identify efficacy markers in weeks rather than months. This advancement reduces the time-to-market for luxury product launches and supports dynamic pricing based on real-time demand. Simultaneously, smaller brands are utilizing third-party AI platforms to introduce virtual try-on and shade-matching tools. These solutions are minimizing return rates in online sales, addressing a challenge that previously benefited brick-and-mortar specialty stores. The strategic takeaway is clear: personalization is shifting from a premium feature to a standard expectation. Brands lacking advanced algorithmic infrastructure may struggle to justify premium pricing as consumers increasingly compare their experiences with AI-driven competitors.
Premiumization of cosmetics product supports growth
Premiumization is a significant growth driver in the U.S. cosmetics market, enhancing product value through superior quality, unique features, luxurious experiences, and trusted efficacy. This trend highlights consumers' growing readiness to spend more on differentiated products that deliver high performance, sensory excellence, and aspirational branding, beyond just higher price points. With rising disposable incomes, U.S. consumers are increasingly willing to pay a premium. In 2024, the U.S. Bureau of Economic Analysis reported the per capita disposable personal income at USD 64,423[2]Source: U.S. Bureau of Economic Analysis via FRED, "Disposable personal income: Per capita", fred.stlouisfed.org. Premium and masstige products, offering premium attributes at accessible prices, are merging with mass-market offerings, making elevated beauty experiences more accessible while retaining exclusivity. This integration is driving widespread growth across skincare, haircare, and makeup categories. Premiumization is also fueling the strong growth of cosmetic fragrances, with digital marketing, limited editions, artisanal packaging, and innovative product formats adding experiential value that justifies higher prices and fosters emotional engagement with consumers. By addressing consumer demand for high-quality, effective, and ethically conscious beauty solutions, premiumization is transforming the U.S. cosmetics market. Through innovative and experiential products, brands are strengthening their equity, increasing average selling prices, and expanding market size across product lines and consumer demographics.
Social media influence to boost the market
Social media plays a crucial role in the U.S. cosmetics market by driving brand discovery, educating consumers, and enabling purchases, particularly among younger, digitally native audiences. Platforms like TikTok, Instagram, and YouTube have become reliable sources of beauty information, influencing nearly 50% of U.S. women aged 18-29 through advertisements and influencer content. These platforms integrate brand discovery, community reviews, and in-app purchasing, encouraging impulse buying and boosting conversions. They shape product trends and promote inclusivity, contributing to market growth. Social media accelerates trends such as K-beauty and clean beauty, quickly informing consumers about product textures, ingredients, and performance. Brands are responding to social media feedback by expanding product ranges, such as offering more diverse foundation shades to meet inclusivity demands. By leveraging influencer marketing, authentic content, and interactive features like live commerce, brands strengthen consumer relationships, enhance loyalty, and drive repeat purchases. With 93% of the U.S. population using the internet, as reported by the World Bank, high internet penetration further amplifies social media's impact [3]Source: World Bank, Individuals using the Internet", worldbank.org.
Restraints Impact Analysis*
| Restraint | (~) % Impact on CAGR Forecast | Geographic Relevance | Impact Timeline |
|---|---|---|---|
| Ingredient and packaging supply-chain volatility | -0.6% | National, acute for brands reliant on imported raw materials | Short term (≤ 2 years) |
| Consumer concerns about chemical ingredients | -0.4% | National, amplified in California, Northeast corridor | Medium term (2-4 years) |
| Rising concerns over counterfeit products in the market | -0.3% | National, concentrated in online marketplaces and discount channels | Short term (≤ 2 years) |
| Stringent regulatory frameworks impacting product launches | -0.5% | National, with California setting precedent for state-level rules | Medium term (2-4 years) |
| Source: Mordor Intelligence | |||
Consumer Concerns About Chemical Ingredients
In 2024, the FDA introduced MoCRA, which requires mandatory adverse-event reporting for cosmetics, a regulation previously applicable only to drugs. This shift in transparency is bringing ingredient risks to light, risks that brands had historically managed discreetly. However, the more significant challenge lies in consumer perception. Social media has the power to amplify ingredient controversies, leading to drastic declines in sales almost overnight. For instance, parabens and sulfates faced widespread criticism and rejection, even though scientific evidence regarding their safety remains inconclusive. To mitigate such risks, brands are increasingly adopting "free-from" claims as a protective measure. Interestingly, many of these replacement ingredients often carry similar or even greater risk profiles. This trend highlights the disconnect between regulatory compliance and the psychological factors driving consumer behavior.
Ingredient and Packaging Supply-Chain Volatility
In 2024, ethical-sourcing mandates in India aimed at eliminating child labor caused mica shortages. This compelled eyeshadow manufacturers to switch to synthetic alternatives during production, leading to texture inconsistencies and subsequent recalls. Packaging challenges were equally disruptive: lead times for glass bottles increased from 8 to 22 weeks as European suppliers prioritized pharmaceutical clients, leaving prestige fragrance brands struggling to find alternatives. These disruptions disproportionately affected smaller brands, which often lack the purchasing power for priority allocations and the capital to stockpile inventory. In response, larger players are adopting vertical integration, exemplified by L'Oréal's 2024 acquisition of a New Jersey-based specialty-packaging manufacturer. Others are expanding their supplier networks across various geographies to mitigate concentration risks. This evolution highlights a critical shift: supply-chain resilience, once considered a back-office function, now directly impacts product launch schedules and market share outcomes.
*Our forecasts treat driver/restraint impacts as directional, not additive. The impact forecasts reflect baseline growth, mix effects, and variable interactions.
Segment Analysis
By Product Type: Lip and Nail Cosmetics Outpace Facial Dominance
Lip and nail make-up products are expanding at 6.38% CAGR through 2031, the fastest pace among product categories, even as facial cosmetics retain 41.32% of 2025 revenue. This shift highlights Gen Z's preference for bold color cosmetics, contrasting with millennials' focus on full-coverage foundations and contouring palettes. TikTok's "lip combo" trend, where users layer products to create custom shades, has driven this growth. Similarly, nail polish sales have risen, supported by the sustained popularity of at-home manicures post-pandemic. Although eye cosmetics are not the fastest-growing segment, they are gaining traction due to innovative mascaras that combine cosmetic and treatment benefits, such as lash-care serums.
Facial cosmetics, despite their leading position, are under pressure from the "skin first, makeup second" trend, which prioritizes skincare over makeup, reducing the frequency of foundation and concealer use. To adapt, brands are launching hybrid products, such as tinted moisturizers with SPF 30+ and cushion compacts infused with hyaluronic acid, which blend skincare and cosmetic benefits. Regulatory oversight in this segment remains limited, as color additives face less scrutiny compared to skincare actives, though California's fragrance-disclosure rules apply across all categories. The key opportunity lies in developing multi-functional products within a single SKU, lowering barriers to trial and capturing a greater share of both cosmetics and skincare budgets.


By Category: Premium Gains Despite Mass Majority
Premium products are growing at 6.89% CAGR through 2031, closing the gap with mass products that held 55.84% of 2025 revenue. This ongoing trend of premiumization is not merely a result of increasing disposable incomes. Instead, it reflects a significant shift in consumer preferences, where shoppers are prioritizing quality over quantity. Consumers are opting for fewer, high-quality items rather than accumulating extensive collections of mass-market alternatives. Prestige brands are capitalizing on this behavioral shift by introducing innovative solutions such as refillable compacts and subscription-based models. These approaches effectively lower the cost per use for consumers while maintaining premium pricing for initial purchases. A notable example is E.l.f. Beauty's success in the "masstige" category, where it bridges the gap between prestige aesthetics and mass-market pricing. This success highlights the increasingly blurred boundaries between product categories.
Mass products, however, continue to dominate in high-turnover categories such as mascara and lip balm. In these segments, the functional similarities between products reduce consumers' willingness to pay a premium. Additionally, in value-conscious regions where household budgets are constrained, consumers tend to prioritize purchasing larger volumes over seeking brand prestige. Retailers are responding to these market dynamics by expanding their private-label prestige product lines. Brands that adopt portfolio strategies encompassing both premium and mass segments are well-positioned to capture a diverse consumer base across varying income levels and purchasing occasions. However, this dual-segment approach carries inherent risks, particularly the potential for brand dilution if consumers perceive the premium and mass offerings as functionally indistinguishable.
By Ingredient Type: Biotechnology Narrows Synthetic Lead
Natural and organic ingredients are projected to grow at a 7.62% CAGR through 2031, nearly double the overall market rate. Yet, in 2025, conventional synthetic formulations still dominate, commanding 76.12% of the market volume. This enduring dominance highlights the performance gaps that clean alternatives have historically struggled to bridge: synthetic polymers offer longer wear in foundations, silicones ensure a smooth slip in primers, and lab-made preservatives extend shelf life beyond the capabilities of plant-based systems. A potential game-changer is fermentation technology, harnessing microorganisms to produce cosmetic actives. These actives mirror plant extracts but boast enhanced purity and consistency.
Under California's Safer Consumer Products program, conventional ingredients are facing heightened scrutiny. In 2024, the program added several UV filters and fragrance compounds to its candidate chemicals list. This addition mandates brands selling in California to conduct an alternatives analysis. Given California's 40 million consumers, the state's market is too significant to overlook. This reality is prompting national reformulations, often benefiting suppliers of natural ingredients. However, a strategic tension emerges: while natural actives can command price premiums of 2x to 5x over their synthetic counterparts, there's a looming risk. As mass brands increasingly adopt clean formulations, the "natural" positioning might risk commoditization. To counter this, brands are weaving in provenance storytelling, highlighting elements like single-origin botanicals or partnerships in regenerative agriculture, to justify and sustain their premium pricing.
By Distribution Channel: Online Retail Reshapes Shelf Economics
Online retail stores are expected to grow at a 6.76% CAGR through 2031, making them the fastest-growing channel. This growth is reducing the 41.65% market share that supermarkets and hypermarkets held in 2025. In a significant development, Amazon's beauty category outperformed Walmart in unit sales in 2024, emphasizing a shift where convenience and variety are prioritized over in-store trials by an increasing number of consumers. TikTok Shop's U.S. launch in 2024 simplified the process from product discovery to purchase on a single platform. At the same time, specialty retailers like Sephora and Ulta are maintaining their market share by focusing on experiential retail, which includes in-store beauty services, personalized consultations, and exclusive product launches. These unique offerings have enabled both chains to expand their U.S. presence in 2024, despite challenges in the e-commerce space.
Supermarkets and hypermarkets are facing a major challenge as beauty products shift from being a secondary purchase during grocery trips to a primary category requiring specialized assortments and expertise. To address this, retailers are introducing dedicated prestige beauty sections staffed with specialists, effectively creating mini-stores that replicate specialty formats. Although channels like direct-to-consumer brand websites and subscription boxes hold only a mid-single-digit market share, they excel in customer lifetime value. Subscribers to these services demonstrate a 40% higher retention rate compared to one-time buyers. This highlights a key strategic insight: distribution is fragmenting into specialized channels designed for distinct purchasing purposes, such as discovery through social commerce, replenishment via subscriptions, or experimentation at specialty stores. Brands must therefore develop omnichannel strategies that account for these varied consumer behaviors, rather than treating all touchpoints as identical.
Geography Analysis
In the U.S. cosmetics market, regional differences challenge the simplistic coastal-versus-heartland narrative. California, a major player in national beauty sales, acts as both a regulatory hub and trendsetter. Due to California's Proposition 65 ingredient restrictions and the Cosmetic Fragrance and Flavor Ingredient Right to Know Act, brands are required to reformulate for the entire U.S. market. This eliminates the need for California-specific SKUs, effectively spreading California's rigorous standards nationwide. Meanwhile, the Pacific Northwest, including cities like Seattle and Portland, strongly favors natural and organic products. This "clean beauty" trend, driven by environmental awareness and a culture centered on outdoor recreation, contrasts with New York's focus on luxury. In New York, Manhattan's zip codes dominate luxury fragrance and skincare sales. However, with New York's upcoming clean beauty legislation potentially aligning with California's, a bicoastal regulatory bloc could emerge, influencing national formulation standards.
The dynamics vary in the Southeast and Midwest. Florida's thriving tourism industry drives spontaneous cosmetic purchases at airports and resorts. In contrast, Texas's growing population is expanding the market for both mass and luxury brands. Midwestern consumers prioritize practicality over ingredient narratives, making the region a stronghold for mass brands and private labels. Specialty stores are gaining traction in Sun Belt cities, with Ulta opening 33 new locations in 2024, betting on an influx of higher-income residents from coastal areas to boost demand for prestige products.
Regulatory fragmentation is becoming a strategic challenge. Beyond California, Maryland and New York are considering legislation to ban certain ingredients or require supply-chain transparency, creating a patchwork of regulations. This could force brands to either maintain state-specific formulations or adopt the strictest standard as a national baseline. While the FDA's MoCRA provides federal oversight, it explicitly allows states to impose additional requirements, potentially creating conflicts between national efficiency and local preferences. Brands with flexible supply chains and modular formulation platforms can leverage this fragmentation by customizing products to regional preferences, while those reliant on centralized manufacturing may face increasing complexity costs that reduce margins.
Competitive Landscape
The U.S. cosmetics market is moderately concentrated, with key players such as L'Oréal, Estée Lauder, Procter and Gamble Company, Unilever, and Coty holding significant revenue shares. However, the market is becoming increasingly fragmented as digitally native brands bypass traditional retail channels. A clear strategic divide has emerged: established companies are leveraging AI and biotechnology to sustain their premium positioning, while newer entrants rely on social media virality and direct-to-consumer models to gain market share without substantial R and D investments. Estée Lauder's AI Innovation Lab, developed in collaboration with Microsoft and OpenAI, exemplifies this approach.
Traditional beauty giants are adopting a dual strategy to navigate the evolving market landscape. They are making significant investments in research and development to enhance their product portfolios and incorporate advanced biotechnology. These efforts aim to address the growing consumer demand for innovative, sustainable, and personalized beauty solutions. At the same time, these companies are actively acquiring emerging brands to diversify their offerings and reach new consumer segments. These acquisitions also help them strengthen their presence in alternative distribution channels, such as e-commerce and social commerce platforms, which are becoming increasingly critical in the current market environment.
Opportunities are emerging in underserved areas: men's cosmetics, while still a small segment, are growing at twice the rate of the overall market as grooming norms evolve. Disruptors are capitalizing on the slow pace of innovation among incumbents. For example, Fenty Beauty pushed the industry to expand shade ranges after years of neglecting deeper skin tones. Technology has become the primary competitive advantage; brands that integrate AI-driven shade matching, AR virtual try-ons, and predictive replenishment tools are reducing return rates and increasing customer lifetime value. Meanwhile, companies relying on outdated e-commerce experiences are losing market share to platforms like TikTok Shop, which combine product discovery and purchasing into a single interface. By December 2024, compliance with MoCRA's facility registration and adverse-event reporting requirements will create challenges for smaller brands lacking regulatory infrastructure, potentially driving consolidation as undercapitalized players exit the market or seek acquisition.
United States Cosmetics Products Industry Leaders
-
L'Oréal S.A.
-
The Estee Lauder Companies Inc.
-
Unilever PLC
-
Coty Inc.
-
Procter and Gamble Company
- *Disclaimer: Major Players sorted in no particular order

Recent Industry Developments
- October 2025: MAC Cosmetics has launched in Sephora's U.S. stores for the first time. This initiative aligns with ELC's efforts to revitalize declining sales, both for MAC and its broader business operations.
- August 2025: Maryam Cosmetics has entered the U.S. market with the launch of a halal-certified luxury lipstick collection. The debut range features a limited-edition selection of ten premium lipsticks, each carefully designed to meet halal certification standards.
- February 2025: L'Oréal S.A. invested USD 160 million to establish its North America Research and Innovation Center in Clark, New Jersey. The facility, which encompassed 250,000 square feet, became L'Oréal's largest research and development center outside France. It incorporated modular laboratories, consumer testing facilities, and a mini-factory for product scaling. The center employed more than 600 scientists and focused on developing personalized beauty solutions and sustainability initiatives.
- February 2025: Estée Lauder Companies established a partnership with Serpin Pharma to research anti-inflammatory applications in cosmetics. The collaboration utilized Serpin's biotechnology, which demonstrated effectiveness in reducing inflammation and enhancing cell resilience for longevity-focused skincare ingredients.


United States Cosmetics Products Market Report Scope
Beauty and personal care products mainly encompass the products that are applied to the external parts of the body, including the skin, nails, hair, and lips. These products also extend to oral hygiene and are used to clean and maintain teeth and the mucosal membrane of the oral cavity, protect it from germs, prevent bad odor, and improve appearance. The scope of the report includes an analysis pertaining to various types of beauty and personal care products associated with skin care, hair care, bathing and showering, oral care, cosmetics and make-up, deodorants, and perfumes, among others. The United States beauty and personal care market is segmented into product types, categories, and distribution channels. By product type, the market is segmented into personal care products and cosmetics/make-up products. Personal care is segmented into categories such as hair care, skin care, bathing and showering, oral care, men's grooming, and deodorants and antiperspirants. Hair care is further sub-segmented into shampoo, conditioner, hair oil, hair styling and coloring products, and other hair care products. Skin care is further sub-segmented into facial care, body care, and lip care. Similarly, bath and shower is sub-segmented into soaps, shower gels, bath salts, bathing accessories, and other bath and shower products. Oral care is sub-segmented into toothbrushes and replacements, toothpaste, mouthwashes and rinses, and other oral care products. Additionally, beauty and make-up/cosmetics are sub-segmented into facial make-up products, eye make-up products, and lip and nail make-up products. By category, the market is segmented into premium products and mass products, and by distribution channels, into specialist retail stores, supermarkets and hypermarkets, convenience stores, pharmacies and drug stores, online retail stores, and other distribution channels. For each segment, the market sizing and forecasts have been done based on value (in USD billion).
By Product Type
| Facial Cosmetics |
| Eye Cosmetics |
| Lip and Nail Make-up Products |
By Category
| Premium Products |
| Mass Products |
By Ingredient Type
| Natural and Organic |
| Conventional/Synthetic |
By Distribution Channel
| Specialty Stores |
| Supermarkets/Hypermarkets |
| Online Retail Stores |
| Other Channels |
| By Product Type | Facial Cosmetics |
| Eye Cosmetics | |
| Lip and Nail Make-up Products | |
| By Category | Premium Products |
| Mass Products | |
| By Ingredient Type | Natural and Organic |
| Conventional/Synthetic | |
| By Distribution Channel | Specialty Stores |
| Supermarkets/Hypermarkets | |
| Online Retail Stores | |
| Other Channels |


Key Questions Answered in the Report
How large is the United States cosmetics products market in 2026?
It is valued at USD 23.73 billion and is projected to expand to USD 30.88 billion by 2031 at a 5.41% CAGR.
Which product segment is growing the fastest?
Lip and nail make-up products are advancing at a 6.38% CAGR through 2031, the highest among product categories.
What role does e-commerce play in beauty sales?
Online retail is the fastest-growing channel at 6.76% CAGR, capturing share from supermarkets and hypermarkets.
How are regulations shaping cosmetic formulations?
MoCRA and California transparency laws mandate ingredient disclosure and adverse-event reporting, compelling nationwide reformulations.
Page last updated on:


