
Market Overview
| Study Period | 2021 - 2031 |
|---|---|
| Forecast Data Period | 2026 - 2031 |
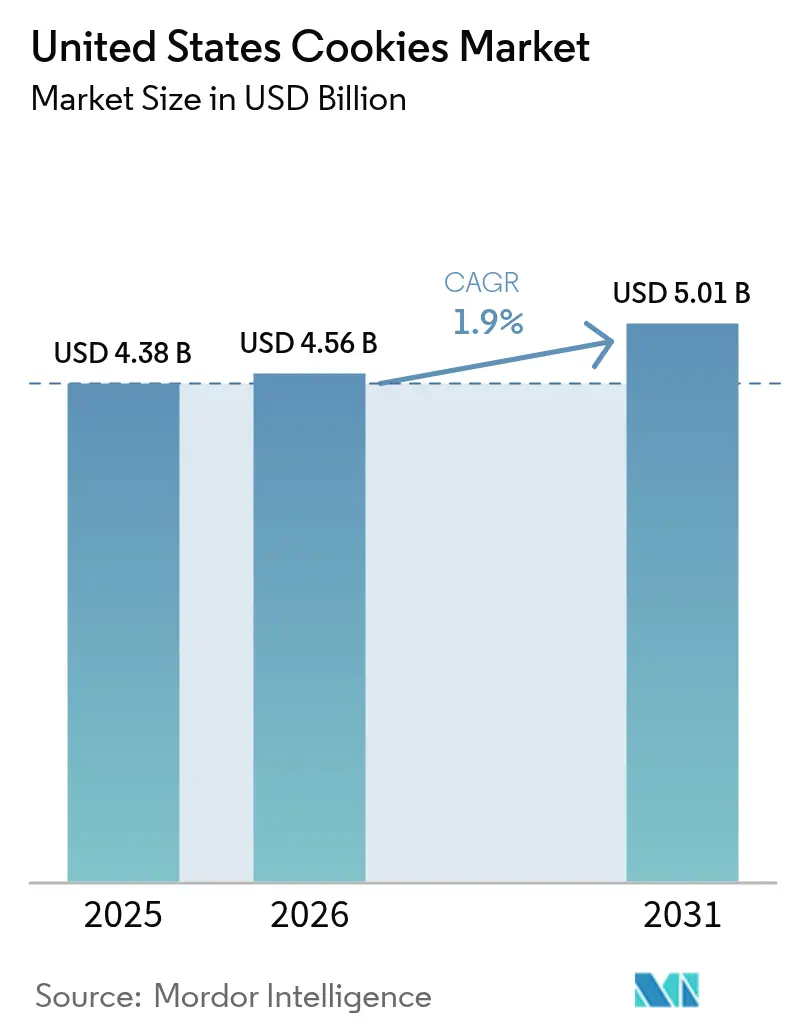
| Base Year Market Size (2025) | USD 4.38 Billion |
| Market Size (2026) | USD 4.56 Billion |
| Market Size (2031) | USD 5.01 Billion |
| Growth Rate (2026 - 2031) | 1.90 % |
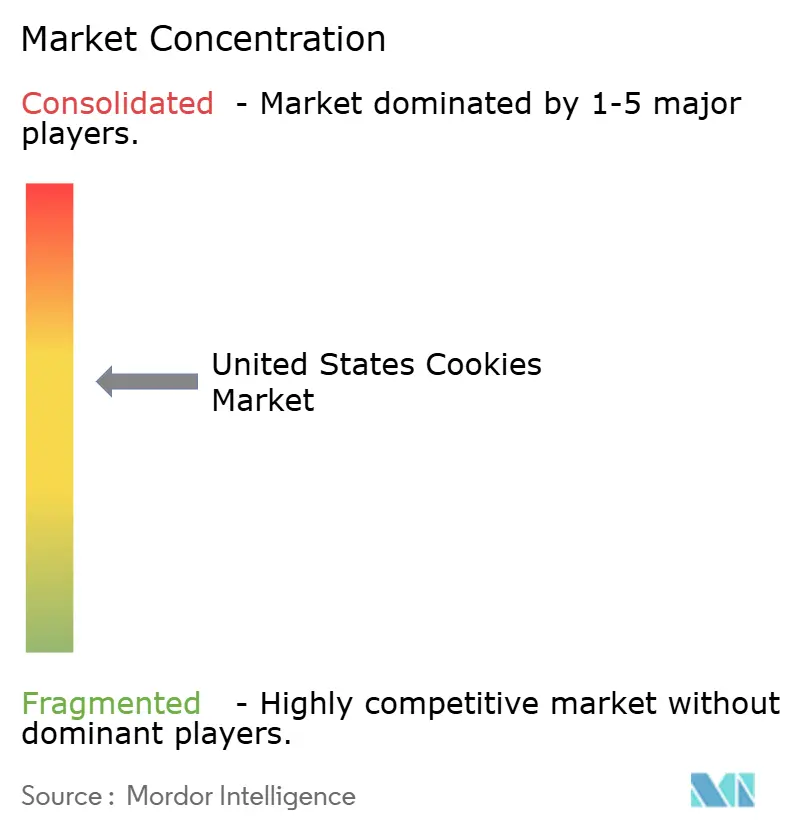
| Market Concentration | Medium |
Major Players
*Disclaimer: Major Players sorted in no particular order Image © Mordor Intelligence. Reuse requires attribution under CC BY 4.0. |
|
United States Cookies Market Analysis by Mordor Intelligence
The United States cookies market size is expected to grow from USD 4.38 billion in 2025 to USD 4.56 billion in 2026 and is forecast to reach USD 5.01 billion by 2031, registering a 1.9% CAGR over 2026-2031. Accelerating premiumization, tighter high-fat-high-sugar-high-salt (HFSS) rules, and growing demand for portion-controlled and fortified snacks are reshaping purchase drivers. Retail prices climbed per pound in January 2026 as manufacturers passed on higher wheat, sugar, and butter costs while using packaging upgrades to position cookies as emotional gifts rather than commodity treats. Although the United States cookies market remains moderately concentrated, a proliferation of allergen-free and direct-to-consumer (DTC) labels is pressuring multinationals to speed up innovation cycles. Plant-based fat reformulation, oleogel adoption, and nutrient-dense fillings are letting leading brands stay under pending Food and Drug Administration (FDA) front-of-package warning thresholds while defending sensory appeal. At the same time, functional protein-rich cookies have opened an entry point, drawing incremental shoppers away from traditional bars.
Key Report Takeaways
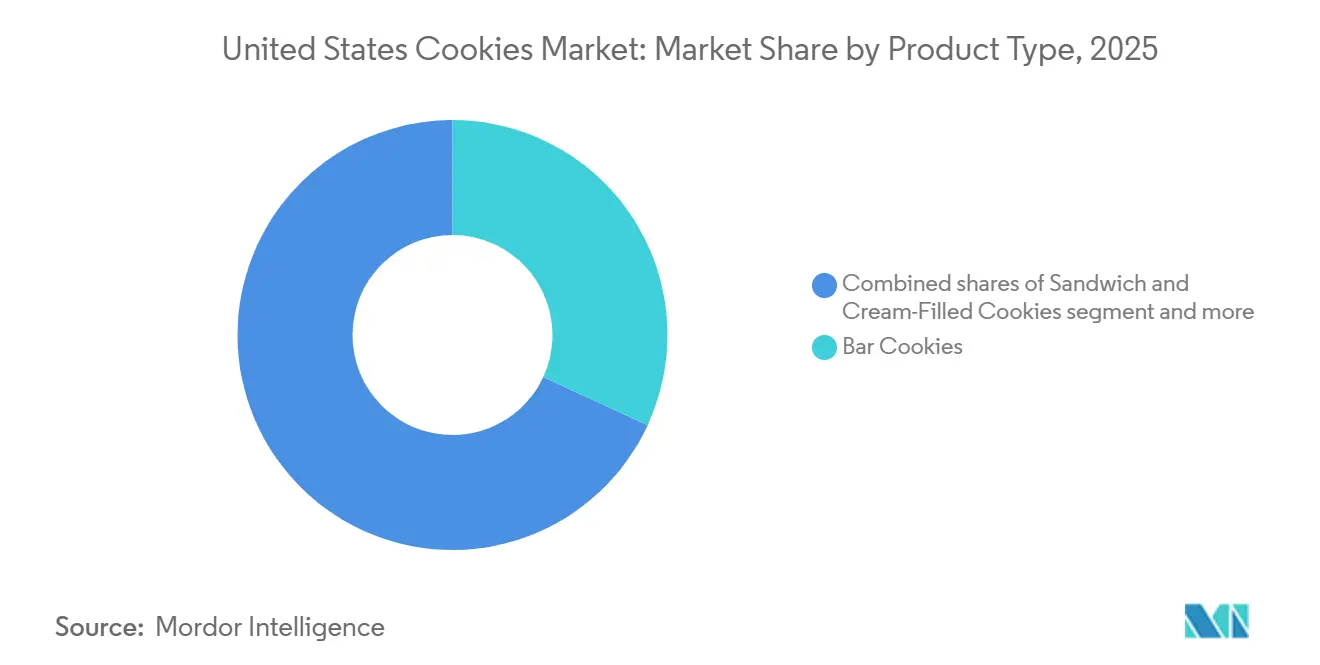
- By product type, bar cookies held 31.89% of the United States cookies market share in 2025, while sandwich and cream-filled cookies are projected to advance at a 2.02% CAGR through 2031.
- By category, conventional lines commanded 89.97% of the United States cookies market size in 2025; the free-from segment is forecast to expand at a 2.99% CAGR to 2031.
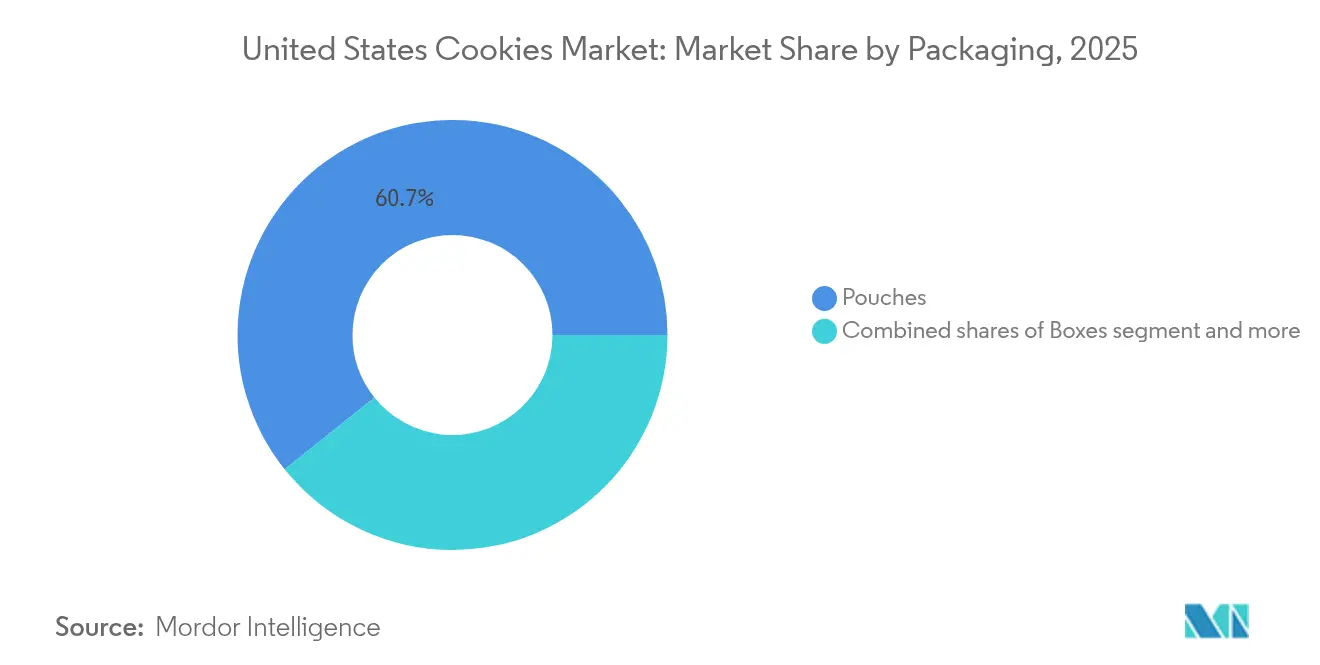
- By packaging, pouches captured 61.75% of 2025 sales; boxes are forecast to climb at a 2.36% CAGR on the back of gifting and premium positioning.
- By distribution channel, supermarkets/hypermarkets led with 36.09% of the 2025 value; online retail stores are expected to grow at a 1.98% CAGR to 2031 on the strength of cookie-of-the-month subscriptions.
- By geography, the South generated 30.78% of 2025 revenue, whereas the Northeast is projected to post a 3.21% CAGR through 2031.
Note: Market size and forecast figures in this report are generated using Mordor Intelligence’s proprietary estimation framework, updated with the latest available data and insights as of 2026.
United States Cookies Market Trends and Insights
Drivers Impact Analysis*
| Driver | (~) % Impact on CAGR Forecast | Geographic Relevance | Impact Timeline |
|---|---|---|---|
| Rising demand for portion-controlled indulgence snacks | +0.4% | National, with early gains in Northeast and West metropolitan areas | Short term (≤ 2 years) |
| Accelerated urban breakfast culture in metropolitan hubs | +0.3% | Northeast, West urban corridors | Medium term (2-4 years) |
| Fortification and nutrient enhancement drive cookies market growth | +0.3% | National, strongest in health-conscious Northeast and West | Medium term (2-4 years) |
| Plant-based fat reformulation driving growth | +0.2% | National, with premium positioning in coastal markets | Long term (≥ 4 years) |
| Direct-to-consumer subscription surge for gourmet cookies | +0.2% | National, concentrated in high-income urban zip codes | Medium term (2-4 years) |
| Gift-giving and premiumization as emotional positioning | +0.3% | National, seasonal peaks in Q4 | Short term (≤ 2 years) |
| Source: Mordor Intelligence | |||
Rising demand for portion-controlled indulgence snacks
Portion control has emerged as the primary demand catalyst, with 48.8% of US consumers snacking three or more times daily in 2025, creating sustained demand for individually wrapped formats that deliver sensory satisfaction without triggering portion-size guilt[1]Source: Snack Food & Wholesale Bakery, "State of the Industry 2025: Snack industry thrives with diverse products", snackandbakery.com. Campbell Soup Company's Pepperidge Farm launched limited-edition Holiday Cookie Jar Collections in 2025, featuring portion-controlled ceramic containers that reinforce mindful consumption while enhancing gift appeal. Pending FDA warning-symbol proposals for products exceeding 10% of the daily value for saturated fat, sodium, or added sugar have hastened recipe tweaks that preserve indulgence while remaining within disclosure limits. Consequently, portion-controlled SKUs continue to record unit growth even as broader cookie unit sales turn slightly negative, underscoring how right-sizing can offset volume softness. This strategic positioning captures growing consumer willingness to pay premiums for products that support lifestyle goals rather than merely satisfying hunger.
Accelerated urban breakfast culture in metropolitan hubs
Urban breakfast culture is redefining cookie consumption occasions, particularly in Northeast and West metropolitan areas, where consumers actively seek "good for you" snacks that double as meal replacements. General Mills capitalized on this shift by launching Pillsbury Cinnamon Toast Crunch and Lucky Charms Soft Baked Cookies in January 2025, leveraging cereal brand equity to position cookies as acceptable breakfast items. The USDA's Smart Snacks in School regulations, which prohibit cookies from counting toward breakfast grain requirements and cap added sugars at 35% by weight, have paradoxically validated cookies as breakfast-adjacent snacks by establishing nutrient guardrails that manufacturers now use as product-development benchmarks. This breakfast-culture tailwind is most pronounced in the Northeast, where the region reflects dense urban populations with limited time for traditional morning meals and a willingness to pay for convenience formats.
Fortification and nutrient enhancement drive cookies market growth
Fortification strategies are enabling cookies to compete in the protein-cookie segment. As consumers sought functional snacks that deliver macronutrient benefits alongside indulgence. Manufacturers are incorporating whey protein isolate, pea protein, and collagen peptides to achieve 5 to 10 grams of protein per serving, positioning cookies as post-workout recovery snacks that rival traditional protein bars at lower price points. General Mills increased media investment by more than 40% in Q3 fiscal 2025 to support its "Accelerating Cookie Momentum" strategy, which includes 30% portfolio renovation focused on nutrient-enhanced variants[2].Source: General Mills Inc., "General Mills Reports Fiscal 2025", generalmills.com This fortification wave is most advanced in the Northeast and West, where health-conscious consumers are willing to pay premiums for functional attributes, yet adoption is spreading to the South and Midwest as mass-market players introduce value-priced fortified lines to defend share against specialty brands.
Plant-based fat reformulation driving growth
Plant-based fat reformulation is addressing saturated-fat concerns while maintaining the sensory attributes that define cookie quality, with manufacturers deploying oleogel technologies that replace butter and palm oil with structured vegetable oils. Rise Baking Company is committed to removing all synthetic colors by 2026, signaling broader clean-label trends that extend to fat sources as consumers scrutinize ingredient panels for recognizable, plant-derived components. Mondelez's March 2024 "MMMproved" Chips Ahoy recipe reformulation, which incorporated higher cacao content and Madagascar vanilla, exemplifies the industry's pivot toward premium plant-based ingredients that justify price increases while mitigating saturated-fat content. The increase in butter prices is creating cost incentives for plant-based substitution even as consumer demand for clean-label formulations drives the strategic shift.
Restraints Impact Analysis*
| Restraint | (~) % Impact on CAGR Forecast | Geographic Relevance | Impact Timeline |
|---|---|---|---|
| Fluctuating raw-material costs impact cookie production margins | -0.3% | National, with acute pressure on regional bakeries | Short term (≤ 2 years) |
| Increased HFSS regulations create market challenges | -0.2% | National, with stricter enforcement in select states | Medium term (2-4 years) |
| Food-safety compliance requirements | -0.1% | National, elevated costs for multi-facility operators | Long term (≥ 4 years) |
| Growing market share of alternative snacking options | -0.2% | National, concentrated among GLP-1 user households | Medium term (2-4 years) |
| Source: Mordor Intelligence | |||
Fluctuating raw-material costs impact cookie production margins
Raw-material volatility is compressing margins, with wheat season-average farm prices of USD 5.00 to USD 5.30 per bushel in 2025/26 and sugar stocks-to-use ratios tightening to 11.62% to 15.2%, creating input-cost inflation of approximately 3% to 4% of cost of goods sold[3]Source: USDA, "Wheat Outlook: May 2025", usda.gov. General Mills reported that input-cost inflation reached 3% to 4% of COGS in fiscal 2025, partially offset by holistic margin management savings of 4% to 5%, yet the company revised its full-year organic net sales outlook downward to a decline of 1.5% to 2% from an earlier projection of flat to 1% growth, signaling that pricing power remains constrained. Additionally, the increased butter prices complicate procurement planning that may prove disadvantageous if spot prices decline. Regional bakeries with limited hedging capabilities face acute margin pressure, as they lack the scale to negotiate multi-year supply agreements without triggering consumer backlash over recipe changes.
Increased HFSS Regulations Create Market Challenges
High Fat, Salt, and Sugar (HFSS) regulations are intensifying, with the Food and Drug Administration (FDA) proposing a front-of-package labeling scheme requiring warning symbols on products exceeding 10% of the daily value for saturated fat, sodium, or added sugars, a threshold that most conventional cookies would trigger. The USDA's Smart Snacks in School regulations limit added sugars to 35% by weight and bar cookies from meeting breakfast grain requirements, sidelining conventional cookies from the USD 14 billion school-meals market. These regulatory headwinds are most acute in states with additional local ordinances, such as California's Proposition 65 warnings for acrylamide in baked goods, which require manufacturers to reformulate or display cancer-risk warnings that undermine premium positioning. The FDA's evolving definition of "healthy" claims, while creating opportunities for fortified cookies, simultaneously raises the bar for conventional products that cannot meet nutrient-density thresholds.
*Our forecasts treat driver/restraint impacts as directional, not additive. The impact forecasts reflect baseline growth, mix effects, and variable interactions.
Segment Analysis
By Product Type: Sandwich Formats Leverage Filling Innovation
Bar cookies commanded 31.89% share of the market in 2025, anchored by granola-adjacent formats and brownie-inspired variants that position themselves as energy-dense snacks suitable for breakfast or post-workout recovery. General Mills' January 2025 launch of Cinnamon Toast Crunch and Golden Grahams Soft Baked Oat Bars leverages cereal brand equity to attract consumers who view bar formats as more nutritious than traditional cookies. Manufacturers are reformulating products in response to the FDA's proposed front-of-package labeling, using alternatives like allulose, monk fruit, and stevia to reduce added sugars and caloric density.
Sandwich and cream-filled cookies are projected to grow at a 2.02% CAGR through 2031, outpacing the broader market. Manufacturers are employing innovative filling technologies and nostalgic flavor combinations, allowing them to command premium prices. Unique flavors like salted caramel and red velvet have boosted cookie appeal. In May 2024, Mondelez's Oreo, holding a 40% share of the sweet cookie market, introduced gluten-free variants to target health-conscious consumers. AI-driven product development accelerates innovation, enabling swift responses to trends and consumer needs.



By Category: Free-From Segment Captures Health-Conscious Demand
Conventional cookies retained 89.97% share in 2025, reflecting entrenched consumer preferences for familiar formulations and price points that remain 20% to 40% below free-from alternatives. The conventional segment benefits from economies of scale in ingredient procurement and production efficiency, enabling mass-market players to defend share through promotional pricing and multi-pack formats that deliver superior value per ounce. Organic certification, non-GMO verification, and other clean-label attributes are becoming table stakes even within the conventional segment, as consumers scrutinize ingredient panels and demand transparency around sourcing and processing methods.
The free-from segment is forecast to grow at 2.99% CAGR through 2031, driven by celiac disease prevalence and broader clean-label preferences that extend beyond diagnosed gluten intolerance. Mondelez's May 2024 launch of gluten-free Chips Ahoy, the brand's first allergen-free variant, signals mainstream adoption of free-from formulations that previously were confined to specialty brands such as Partake Foods and Tate's Bake Shop. However, a study published in April 2025 linking arsenic exposure to gluten-free diets has introduced a countervailing health concern that manufacturers must address through ingredient sourcing and testing protocols.
By Packaging Type: Resealable Pouches Dominate Convenience Occasions
Pouches held 61.75% of the 2025 market share, benefiting from resealability that extends product freshness and on-the-go convenience that aligns with snacking occasions outside the home. Flexible packaging costs 15% to 25% less than rigid boxes on a per-unit basis, enabling mass-market players to maintain competitive pricing while preserving margins in a promotional retail environment. However, pouches face sustainability headwinds as municipalities implement extended producer responsibility (EPR) regulations that impose recycling fees on non-recyclable flexible packaging, creating cost pressures that may accelerate the shift toward mono-material films and paper-based alternatives.
Boxes are projected to grow at a 2.36% CAGR through 2031, driven by demand for rigid structures that convey quality and protect delicate cookies during shipping. Tate's October 2024 holiday launches, featuring Dark Chocolate Peppermint Cookie Bark and Chocolate Toffee in decorative tins, highlight a seasonal gifting strategy that positions boxes as emotional tokens. Sustainable packaging innovations, such as recyclable paperboard and compostable films, are becoming key differentiators as consumers increasingly prioritize environmental impact, particularly in the Northeast and West.
By Distribution Channel: E-Commerce Gains Share Through Subscription Models
Supermarkets and hypermarkets accounted for 36.09% of 2025 distribution channels, leveraging scale economies in merchandising and promotional execution that smaller channels cannot replicate. Campbell Soup's Pepperidge Farm division reported a 3% volume/mix increase in cookies during Q1 fiscal 2025, attributing gains to Farmhouse brand growth and Milano performance in mainstream grocery channels. The FDA's menu-labeling requirements, which mandate calorie disclosure for chain restaurants with 20 or more locations, are reshaping distribution by increasing transparency around cookie nutritional profiles and potentially deterring impulse purchases.
Online retail stores are forecast to grow at 1.98% CAGR through 2031, propelled by subscription models and omnichannel shoppers. Grocer-owned platforms grew in 2024 while third-party aggregators declined, signaling that cookie brands must establish direct relationships with retailers' e-commerce operations rather than relying solely on marketplace listings. Flowers Foods' USD 795 million acquisition of Simple Mills in December 2024 was explicitly designed to capture the target's direct-to-consumer capabilities.
Geography Analysis
The South generated 30.78% of the United States cookies market size in 2025, supported by entrenched loyalty to legacy value packs from brands like Little Debbie. Production hubs nearby keep freight bills low and promotional cadence high, cementing share. Yet premiumization lags; many households remain price reactive, leaving limited headroom for USD 8 artisanal tins. Manufacturers must weigh volume stability against slower revenue growth as GLP-1 adoption, now spreading beyond coastal metros, clips calorie-dense snack occasions.
The Northeast is projected to expand at a 3.21% CAGR to 2031, outstripping national growth as dense urban residents trade up to breakfast-replacement and fortified formats. Tate’s Bake Shop routinely pilots innovations here before rolling them out nationally, and Oreo’s gluten-free line achieved above-average sales velocity in Northeast independents within six months. Higher household income and advanced online grocery habits ensure that premium Direct-to-customer (DTC) boxes land on doorsteps weekly, reinforcing channel migration.
The Midwest mirrors Southern value focus but benefits from agricultural proximity that lowers grain inputs, allowing regional bakeries to fend off national chains on price. Ferrero’s Bloomington, Illinois chocolate hub exemplifies strategic investment aimed at servicing both Midwest and South cost-effectively. The West, by contrast, aligns with the Northeast’s wellness orientation; protein cookies and plant-based fat reformulations find early adopters in California and Washington. However, sparse retail geography inflates distribution costs, maintaining moderate share despite strong per-capita spend.
Regulatory Landscape
United States cookie manufacturers primarily work under FDA oversight for labeling and preventive controls, while FSIS takes jurisdiction only when products include a significant portion of meat or poultry, which can trigger label pre-approval requirements. Core FDA labeling elements (identity, net quantity, Nutrition Facts, ingredients, allergen declaration, and responsible firm information) keep packaging compliance work centered on standard consumer-facing information. The FDA also set January 1, 2028 as the uniform compliance date for final food labeling regulations published between January 1, 2025 and December 31, 2026, which helps companies align label-change cycles across multiple SKUs.
Food safety oversight is also shifting in how inspections are carried out. FDA initiatives such as the BRIDGE Project move more domestic manufacturing food inspections toward state agencies, increasing the need for multi-site audit readiness and consistent documentation across co-manufacturers. For institutional and government channels, procurement specifications can add another layer, including USDA AMS Commercial Item Description A-A-20295E for cookies, and organic claims in these channels must align with USDA organic regulations when used.
Competitive Landscape
The United States cookies market exhibits moderate concentration, as multinational conglomerates such as Mondelez, Ferrero, and General Mills coexist with agile specialty brands that exploit direct-to-consumer channels and allergen-free positioning to capture incremental share. Consolidation waves are reshaping competitive dynamics, exemplified by Ferrero's USD 3.1 billion acquisition of WK Kellogg in September 2025 and Flowers Foods' USD 795 million purchase of Simple Mills in December 2024, concentrating manufacturing capacity and distribution leverage among a shrinking cohort of large-scale operators.
Strategic patterns reveal a bifurcation between mass-market players, who deploy incremental reformulation and promotional intensity to defend volume, and premium specialists, who leverage clean-label credentials and emotional positioning to command price premiums of 30% to 50%. Technology adoption is accelerating, with Mondelez using artificial intelligence to develop gluten-free Oreo formulations and General Mills increasing digital media investment by more than 40% to support its "Accelerating Cookie Momentum" strategy, signaling that data-driven product development and precision marketing are becoming competitive necessities.
White-space opportunities are emerging in the intersection of functional nutrition and indulgent formats, as protein cookies and fortified variants capture consumers seeking macronutrient benefits alongside sensory satisfaction, yet incumbents' scale advantages in ingredient procurement and distribution access create high barriers for new entrants lacking venture backing or strategic partnerships. Emerging disruptors such as Partake Foods and Tate's Bake Shop are unsettling incumbents by bypassing traditional retail gatekeepers through direct-to-consumer models and subscription offerings that generate recurring revenue streams insulated from promotional pressure.
United States Cookies Industry Leaders
-
General Mills Inc.
-
Mondelēz International
-
Ferrero Group
-
Mckee Foods Corporation
-
The Campbell Soup Company
- *Disclaimer: Major Players sorted in no particular order

Market Opportunities and Future Outlook
Capacity additions and modernization programs give brands more flexibility to improve service levels and expand formats across retail and foodservice. In June 2026, Bauducco opened a 160,000-square-foot manufacturing facility in Zephyrhills, Florida, with a scale-up path to 1.2 million square feet, reinforcing the push toward US-based production that can reduce lead times and support product development across cookie and sweet-baked platforms. Similar investment signals appear in June 2025, when David's Cookies completed a USD 25 million, 100,000-square-foot expansion in Cedar Grove, New Jersey, and in May 2024, when Joy Baking began a 200,000-square-foot expansion at its Hermitage, Pennsylvania plant to add cookie and wafer capacity.
With HFSS scrutiny and packaging compliance timelines tightening, manufacturers can pair line expansions with updates to recipes, pack sizes, and pack architectures, especially for free-from, portion-controlled, and nutrient-enhanced cookies competing for snack occasions beyond traditional dessert use. In 2026, Mondelēz also highlighted initiatives to modernize US biscuit operations and upgrade route-to-market capabilities, creating room for suppliers and co-manufacturers to support faster changeovers, scalable fillings, and compliant label updates across wide SKU portfolios.
Recent Industry Developments
- May 2026: Mondelēz International announced a global partnership with BTS to launch limited-edition OREO & BTS Cookies, with US retail availability starting June 8, 2026. The collaboration uses entertainment-led branding and a distinct flavor and color profile to stand out in crowded cookie sets and support premium, limited-time merchandising.
- May 2026: General Mills introduced limited-edition products tied to Americas 250th birthday, including Betty Crocker Americas Birthday Cake Soft Baked Cookie Mix and Pillsbury Ready-to-Bake seasonal cookie dough items. The rollout reinforces event-driven, seasonal rotation strategies that help large brands defend shelf presence and drive incremental purchases beyond everyday staples.
- May 2024: Joy Baking commenced construction on a 200,000-square-foot expansion at its Hermitage, Pennsylvania plant to increase cookie, wafer, and ice cream cone production capacity. The build-out strengthens domestic supply capability for both branded and contract manufacturing programs and supports broader assortment growth across snack and dessert adjacencies.


Research Methodology Framework and Report Scope
Market Definition and Coverage
This market is defined as the value of cookies sold in the United States across mainstream retail and online channels, covering packaged cookie products purchased for at-home consumption. The sizing focuses on sales value tracked in USD, with volume checks used to keep totals realistic.
Scope exclusions: Fresh bakery cookies sold loose at in-store bakeries, restaurant-made desserts, and broader sweet baked goods like cakes and pastries are not counted.
Segmentation Overview
-
By Product Type
- Bar Cookies
- Molded/Drop Cookies
- Sandwich and Cream-Filled Cookies
- Wafer and Rolled Cookies
- Butter/Shortbread and Plain Cookies
- Others
-
By Category
- Conventional
- Free-from
-
By Packaging Type
- Pouches
- Boxes
- Others
-
By Distribution Channel
- Supermarkets/Hypermarkets
- Convenience/Grocery Stores
- Specialty Stores
- Online Retail Stores
- Other Distribution Channels
-
By Geography
- Northeast
- Midwest
- South
- West
Data Sources, Market Sizing, and Validation
Desk Research
Desk work starts with public, non-paywalled sources that anchor the model to real food consumption and pricing signals. We referenced sources such as USDA Economic Research Service (food spending and price trends), US Census Bureau retail trade series, Bureau of Labor Statistics CPI data for bakery and snack price movements, and public FDA labeling guidance that affects how cookie types are classified and marketed.
To avoid treating cookies like a generic snack, we also reviewed trade association publications and category notes from reputable press, plus company filings and investor presentations to track brand mix shifts and channel exposure. A paid subscription for company financials and a separate news and financials service were used selectively to align revenue timelines and flag major launches, M&A, or plant changes. These examples are not exhaustive, and other public sources were used for data collection, cross-checking, and clarification.
Primary Interviews and Surveys
Primary work was used to convert desk signals into a working market model, mainly by validating channel splits, price bands, and how promotional intensity changed cookie revenue without a matching volume lift. We spoke with manufacturers, ingredient and packaging participants, distributors, and retail category contacts across the United States so the assumptions could be stress-tested and adjusted where needed.
Distribution of primary research fieldwork respondents
| Company type | Respondent position |
|---|---|
| Top tier: 26% | CXOs: 15% |
| Mid tier: 58% | Functional/Unit leaders: 31% |
| Smaller Players: 16% | Managers: 54% |
Market-Sizing & Forecasting
Sizing is built using a top-down approach where retail and food spending indicators are reconstructed into a cookies-only demand pool, then filtered by channel and product mix before the final total is reached. After that, results are checked using selective bottom-up approximations, such as sampled brand and private-label price points multiplied by plausible volumes, plus channel checks on how much of cookie sales are promoted versus everyday pricing.
Inputs used in the model include cookie price inflation using CPI-linked movements, household food-at-home spending direction, online share changes versus store-based retail, shifts between conventional and free-from offerings, and packaging mix that can influence price per unit. For forecasting, we used scenario analysis supported by short regression tests on the main drivers, and the forward view was then adjusted to reflect what interviewees expect on pricing normalization, promotion cadence, and steady category maturity. Where bottom-up signals were thin for smaller channels, we filled gaps using conservative ranges and then rebalanced totals to match the top-down demand pool.
Data Validation & Update Cycle
Outputs are validated through triangulation across independent signals, such as price inflation versus value growth, and expected volume patterns versus reported category momentum. If a step produces a jump that does not match known events, the inputs are rechecked, and follow-up calls are triggered with the most relevant respondents.
Before sign-off, the model goes through multi-step analyst reviews that include variance checks by channel and a final logic review on assumptions that move the forecast. Reports are refreshed annually, and interim updates are made when material changes occur in pricing, regulation, or channel structure. Right before delivery, a fresh pass is completed so the numbers reflect the latest available public indicators.
Mordor Intelligence's United States Cookies Market Size Versus Other Published Estimates
Published market sizes for US cookies often look far apart because studies do not always count the same revenue pool, and they may also apply different price timing and channel coverage. Differences usually come from what is treated as retail packaged cookies versus broader baked sweets, how foodservice is handled, and whether inflation is pushed through the forecast in an aggressive way.
In our checks, the biggest gap drivers were whether fresh bakery and foodservice cookie sales were blended into the total, and whether the estimate extended into adjacent snack and dessert baskets. Currency is not the issue here, but timing is, because shifting the base year and using higher price escalation can lift value quickly in a mature category where volumes move slowly.
In our checks, the biggest gap drivers were whether fresh bakery and foodservice cookie sales were blended into the total, and whether the estimate stretched into adjacent snack and dessert baskets. Currency is not the issue here, but timing is, because shifting the base year and using higher price escalation can lift value quickly in a mature category where volumes move slowly.
Benchmark comparison
| Source | Market Size | Gaps in Research Methodology |
|---|---|---|
| Mordor Intelligence | USD 4.38 B (2025) | |
| Global Consultancy A | USD 7.88 B (2025) | Often reflects a wider scope that can fold in foodservice and bakery-linked cookie sales, and it may use a broader product taxonomy that captures adjacent sweet baked snack baskets. |
| Industry Publisher B | USD 6.48 B (2025) | Typically assumes faster value expansion by pushing higher price growth and may treat online and non-store channels as incremental without fully netting out shifts from store-based retail. |
The spread mainly comes from what gets counted as cookies sales and how price and channel shifts are translated into dollars. When the model is kept tied to packaged cookies sold through tracked retail and online channels, and volume checks are used to avoid overstating inflation-only growth, the result aligns with the narrower scope applied by Mordor Intelligence.


Key Questions Answered in the Report
What is the projected value of the United States cookies market in 2031?
It is expected to reach USD 5.01 billion, advancing at a 1.90% CAGR from 2026.
Which product segment is growing fastest in United States cookies?
Sandwich and Cream-Filled Cookies are projected to post the quickest 2.02% CAGR through 2031.
Why are boxes gaining popularity as a packaging format?
Gift-oriented purchases and premium positioning drive a 2.36% CAGR for boxes, even as pouches retain the bulk of sales.
Which region shows the strongest growth outlook?
The Northeast is set for the fastest 3.21% CAGR owing to higher incomes and premium product uptake.
Page last updated on:





