
Market Overview
| Study Period | 2021 - 2031 |
|---|---|
| Forecast Data Period | 2026 - 2031 |
| Base Year Market Size (2025) | 6.75 gigawatt |
| Market Volume (2026) | 7.95 gigawatt |
| Market Volume (2031) | 18.05 gigawatt |
| Growth Rate (2026 - 2031) | 17.82 % |
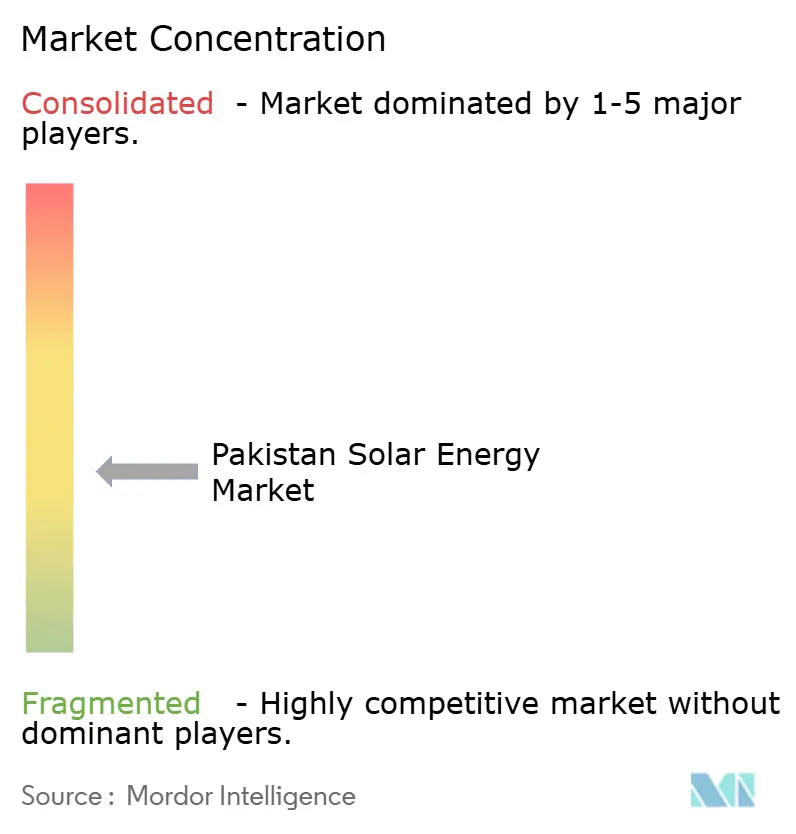
| Market Concentration | Medium |
Major Players *Disclaimer: Major Players sorted in no particular order Image © Mordor Intelligence. Reuse requires attribution under CC BY 4.0. | |
Pakistan Solar Energy Market Analysis by Mordor Intelligence
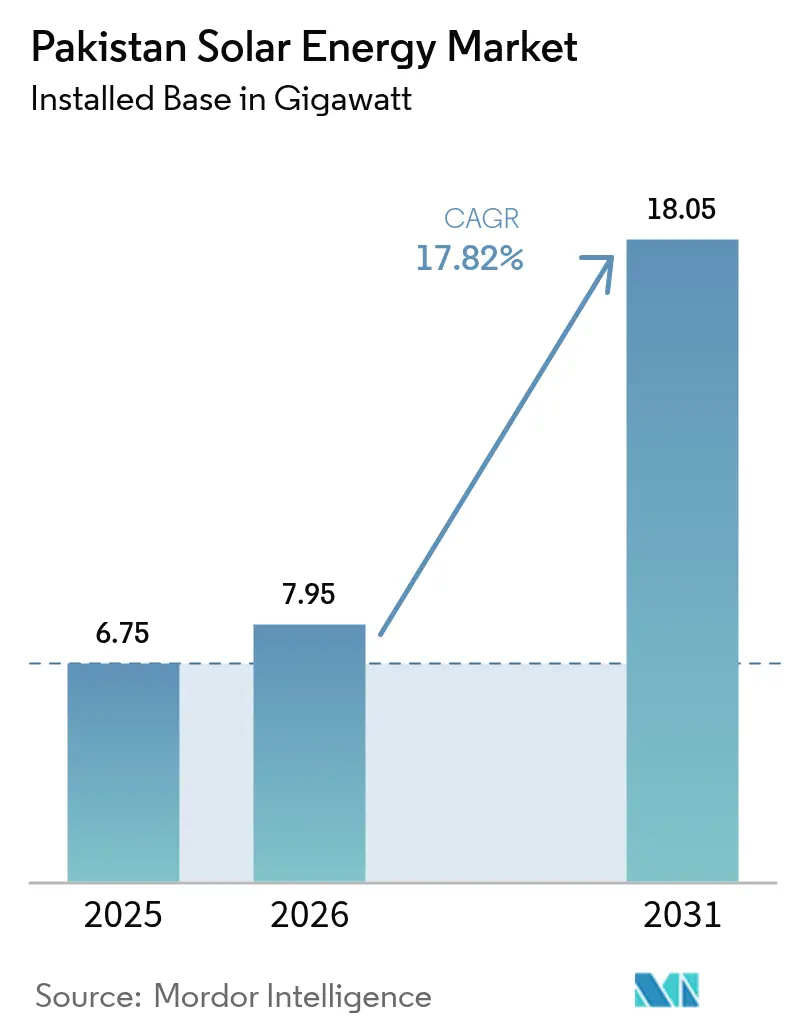
The Pakistan Solar Energy Market size is expected to grow from 6.75 gigawatt in 2025 to 7.95 gigawatt in 2026 and is forecast to reach 18.05 gigawatt by 2031 at 17.82% CAGR over 2026-2031.
Plunging module prices, a cumulative 155% run-up in retail electricity tariffs since 2021, and widening access to concessional vendor financing have compressed commercial payback periods below three years, catalyzing adoption among textile mills and food processors.(1)NEPRA, “Electricity Tariff Notifications 2021-2024,” nepra.org.pkPakistan imported 16.9 GW of photovoltaic (PV) modules in 2024, a 127% year-on-year surge that vaulted the country to the world’s third-largest destination for Chinese solar exports, trailing only the United States and Brazil. Provincial free-solar-kit schemes targeting 500,000 households and corporate power-purchase agreements (PPAs) are reshaping demand patterns faster than distribution utilities can stabilize reverse power flows. Rising dependence on daytime self-generation has shaved 8-10% off grid demand in solar-dense urban feeders, forcing distribution companies (DISCOs) to socialize PKR 200 billion in stranded grid costs among non-solar consumers.
Key Report Takeaways
- By technology, solar photovoltaic captured 100.00% of Pakistan's solar energy market share in 2025 and is forecast to advance at an 17.82% CAGR through 2031.
- By grid type, on-grid systems held 91.80% of the Pakistan solar energy market size in 2025, whereas off-grid systems are expected to post a 24.6% CAGR to 2031.
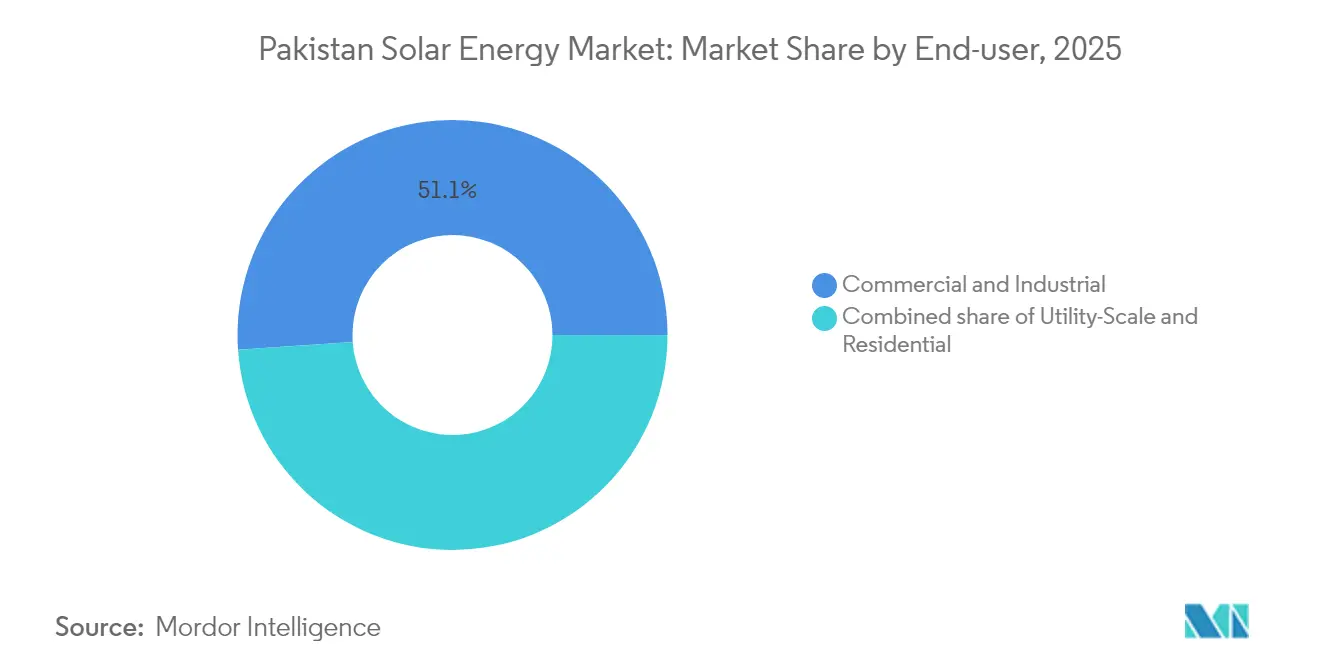
- By end user, the commercial and industrial segment commanded 51.10% of the Pakistan solar energy market share in 2025, while the residential segment is projected to expand at a 22.8% CAGR through 2031.
Note: Market size and forecast figures in this report are generated using Mordor Intelligence’s proprietary estimation framework, updated with the latest available data and insights as of 2026.
Pakistan Solar Energy Market Trends and Insights
Drivers Impact Analysis*
| Driver | (~) % Impact on CAGR Forecast | Geographic Relevance | Impact Timeline |
|---|---|---|---|
| Plummeting module and balance-of-system prices | +4.50% | Punjab and Sindh industrial corridors | Short term (≤ 2 years) |
| Surge in residential rooftop net-metering connections | +3.80% | Urban Punjab, Sindh, Islamabad Capital Territory | Medium term (2-4 years) |
| Corporate PPAs by export-oriented industries | +2.20% | Faisalabad, Lahore, Karachi | Medium term (2-4 years) |
| Chinese vendor financing for CPEC-aligned solar parks | +1.80% | Bahawalpur, planned Balochistan sites | Long term (≥ 4 years) |
| Falling lithium-ion prices enabling solar-plus-BESS | +1.50% | Nationwide early C&I adopters | Long term (≥ 4 years) |
| Provincial free-solar-kit schemes for low-income homes | +3.20% | Punjab, Sindh, Khyber Pakhtunkhwa | Short term (≤ 2 years) |
| Source: Mordor Intelligence | |||
Plummeting Module and Balance-of-System Prices
Module prices collapsed 60% in 2024 after Chinese manufacturers dumped surplus inventory into South Asia, dragging utility-scale levelized costs below PKR 9.8 per unit, far under the PKR 29-48 retail range in Islamabad.(2)K-Electric, “Generation Cost Comparison FY 2024,” kelectric.com.pkBulk procurement enabled EPCs to quote turnkey commercial systems at PKR 100,000–300,000 per kilowatt, down from PKR 180,000–400,000 nine months earlier, shortening payback periods for textile mills to under three years. However, slower declines in steel-intensive racking and cable pricing have squeezed local integrator margins and strengthened vertically integrated Chinese firms that fold vendor financing into supply contracts. Oversupply exceeding 200 GW worldwide is expected to keep module prices soft through 2026, yet any anti-dumping duties or further PKR depreciation would offset part of the advantage for Pakistani buyers.
Surge in Residential Rooftop Net-Metering Connections
Residential net-metering accounts rose to 283,000 by December 2024, a meteoric rise from negligible levels in 2020, as households aimed to hedge against the 155% tariff escalation since 2021. The Punjab Chief Minister’s zero-interest solar program, launched in December 2024, drew 861,000 applications within three months for 100,000 subsidized systems, revealing pent-up demand. An Economic Coordination Committee proposal to slash the buy-back rate from PKR 27 to PKR 10 per unit has triggered industry protests and legal challenges, injecting policy uncertainty that already dampens new rooftop bookings. DISCOs report an 8-10% midday demand erosion in dense feeders, spurring costly grid reinforcements to handle voltage swings and reverse power flow.
Corporate PPAs by Export-Oriented Industries
Textile exporters, which consume nearly one-third of Pakistan’s industrial electricity, now execute 10-15-year solar PPAs to lock in tariffs below PKR 15 per unit while meeting European sustainability mandates. Yellow Door Energy disclosed a 50 MW corporate portfolio in 2024 with Engro and ICI Pakistan, reflecting a growing appetite for behind-the-meter generation insulated from net-metering revisions. Nishat Mills, Interloop, and Artistic Milliners have each installed multi-megawatt systems to cut outage-driven downtime that idled production for up to eight hours daily during 2024’s peak-demand months.
Provincial Free-Solar-Kit Schemes for Low-Income Homes
Punjab earmarked PKR 12.6 billion to distribute 100,000 rooftop kits to households using fewer than 200 monthly units, targeting completion of 94,483 systems by July 2025. Sindh and Khyber Pakhtunkhwa plan a combined 300,000 kits, while Balochistan’s PKR 55 billion project will solarize 28,000 agricultural tube wells by 2027. These programs focus on regions where grid reliability hovers at 12-16 daily service hours and diesel costs hit PKR 40-60 per unit, making decentralized solar the lowest-cost alternative.
Restraints Impact Analysis*
| Restraint | (~) % Impact on CAGR Forecast | Geographic Relevance | Impact Timeline |
|---|---|---|---|
| Proposed cut in net-metering buy-back tariff | -2.50% | Punjab and Sindh urban feeders | Short term (≤ 2 years) |
| Grid congestion and reverse-power-flow risks | -1.80% | Lahore, Karachi, Islamabad DISCOs | Medium term (2-4 years) |
| PKR depreciation inflating imported component costs | -1.20% | Nationwide | Short term (≤ 2 years) |
| Weak local standards and counterfeit panels glut | -0.80% | Low-income residential segments | Medium term (2-4 years) |
| Source: Mordor Intelligence | |||
Proposed Cut in Net-Metering Buy-Back Tariff
The Economic Coordination Committee’s March 2025 nod to lower the buy-back rate from PKR 27 to PKR 10 per unit, plus term reduction from 10 to five years, seeks to avert PKR 545 billion in cross-subsidies by 2034.(3)ECC Approves Net-Metering Tariff Cut,” dawn.com If enforced, payback periods for typical 5 kW rooftops would stretch from four to eight years and could slow residential adoption by 30-40% through 2027. Industrial users remain shielded because direct PPAs avoid net-metering altogether.
Weak Local Standards and Counterfeit Panels Glut
The Pakistan Solar Association warned in August 2024 that low-grade modules are penetrating price-sensitive segments, threatening long-term system performance.(4) Pakistan Solar Association, “Position Paper on Module Quality,” paksolar.org Voluntary certification and lax border checks exacerbate the risk, undermining consumer confidence.
*Our forecasts treat driver/restraint impacts as directional, not additive. The impact forecasts reflect baseline growth, mix effects, and variable interactions.
Segment Analysis
By Technology: Photovoltaic Monopoly Persists
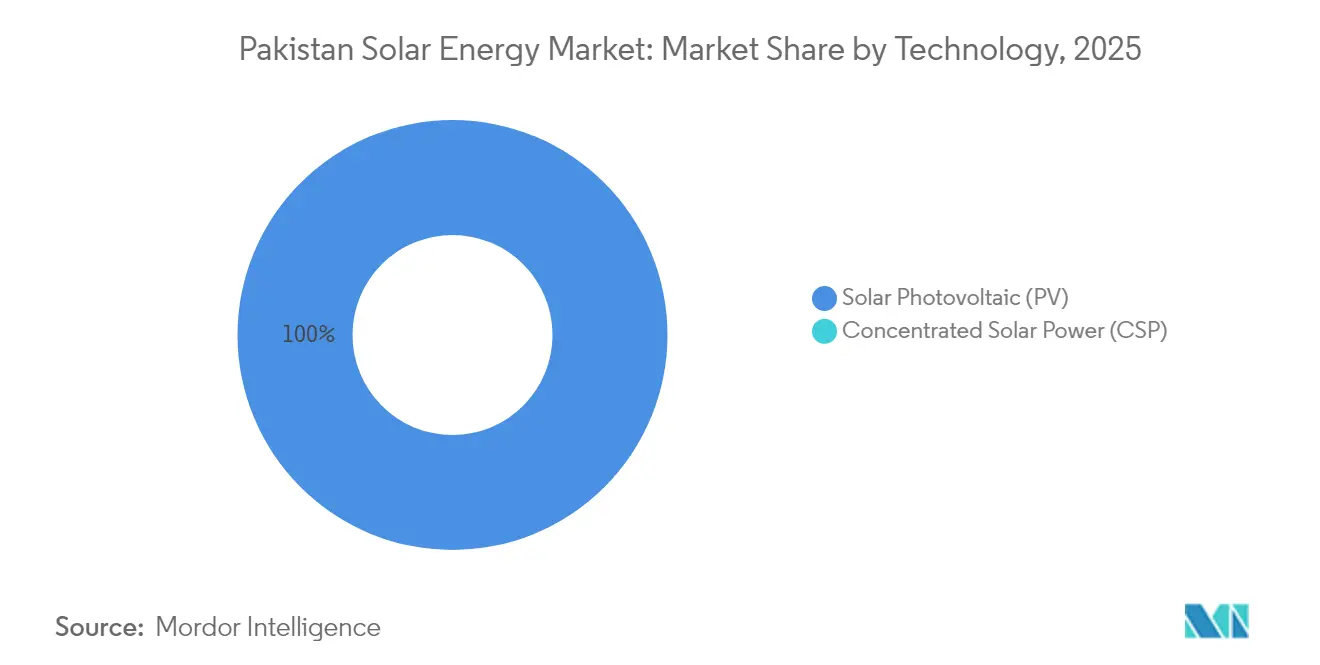
Solar photovoltaic maintained a 100.00% installation footprint within the Pakistan solar energy market in 2025 and is forecast to expand at an 17.82% CAGR through 2031, leaving concentrated solar power (CSP) commercially dormant. Crystalline-silicon modules, chiefly polycrystalline and monocrystalline PERC, represent 98% of deployed wattage, driven by 18-22% conversion efficiencies and sub-USD 0.15-per-watt pricing. Pakistan imported 16.9 GW of PV modules in 2024 alone, validating the country’s status as a pivotal off-take base for excess Chinese capacity.
CSP languishes despite superior direct-normal-irradiance in Balochistan and Sindh because water-intensive steam cycles are incompatible with the regions’ arid climates and because PV CAPEX has fallen below PKR 70,000 per kilowatt. Until dry-cooled CSP costs drop by at least 40%, PV will preserve its stranglehold on the Pakistan solar energy market.



By Grid Type: Off-Grid Gains Momentum
On-grid systems controlled 91.80% of installed wattage in 2025 owing to lucrative net-metering and bankable industrial PPAs. However, net-metering caps and buy-back revisions are beginning to steer adopters toward self-sufficient architectures. Off-grid installations are forecast to grow at a 24.6% CAGR to 2031 as rural households, telecom towers, and agricultural tube wells bypass unreliable networks. Balochistan’s PKR 55 billion tube-well program alone will inject 28,000 standalone pumps, freeing 200-250 MW of grid capacity for factories.
By End User: Residential Surge Reshapes Demand
Commercial and industrial users occupied 51.10% of installed capacity in 2025, anchored by textile and food clients that hedge tariff volatility through rooftop assets. Yet the residential segment is projected to rise at a blistering 22.8% CAGR, powered by provincial subsidies and net-metering. Punjab’s zero-interest program could alone seed 1 GW of additional rooftops by 2027.
Geography Analysis
Punjab and Sindh jointly host 70-75% of the national capacity. Punjab leads with an estimated 3.5 GW, propelled by Faisalabad and Lahore textile rooftops plus the province’s expansive residential-subsidy slate. Sindh sits at roughly 2 GW, punctuated by K-Electric’s 490 MW pipeline spanning Gharo and Jhimpir, which promises PKR 3.4 billion in annual savings and will displace 400,000 tons of coal annually. Karachi’s commercial districts showcase the densest rooftop penetration, nearing 50,000 metered systems.
Balochistan and Khyber Pakhtunkhwa trail but post outsized growth rates as off-grid solar overtakes costly line extensions. Islamabad Capital Territory, though representing less than 2% of installed capacity, ranks highest on a per-capita basis thanks to affluent demographics and efficient net-metering administration. Provincial disparities in budgetary firepower, Punjab’s PKR 12.6 billion versus Balochistan’s PKR 2.5 billion, risk widening regional adoption gaps without federal equalization.
Regulatory Landscape
Pakistan's distributed solar market is governed by the National Electric Power Regulatory Authority (NEPRA) framework for prosumers and interconnection, supported by Power Division planning documents such as the National Electricity Plan 2023-27. A major inflection point came in February 2026 when NEPRA notified the NEPRA (Prosumer) Regulations, 2026 (SRO 251(I)2026), replacing the earlier net-metering regime for new distributed generation up to 1 MW with a net-billing mechanism, tightening contract terms (five-year agreements) and resetting export compensation for new participants.
Beyond tariff and settlement rules, compliance increasingly depends on technical and quality controls. Grid-connected inverters and generators are commonly required to meet internationally recognized standards (for example, IEEE 1547 and IEC 61215). National quality enforcement efforts are also being reinforced through initiatives such as the Pak-Korea Solar Testing Lab, which announced commercial operations in 2026 and an accreditation pathway via the Pakistan National Accreditation Council (PNAC) to support solar product testing and confidence in system performance.
Competitive Landscape
The Pakistan solar energy market is moderately fragmented. Chinese module majors, JinkoSolar, Canadian Solar, LONGi, Trina Solar, and JA Solar, collectively funnel more than 95% of imports through vendor financing tied to CPEC obligations. Local EPC specialists such as Reon Energy and Yellow Door Energy compete on speed and service, increasingly bundling finance, O&M, and monitoring. Reon disclosed a 1.5 GW pipeline in 2024 and expanded into Bangladesh, while Yellow Door’s 50 MW PPA-backed fleet underscores growth in captive C&I supply. Huawei, SMA, and Fronius dominate inverters, with Huawei’s AI-enabled FusionSolar lowering downtime by 15-20% for process-heavy factories. Rising provincial tenders featuring tariffs near PKR 9.8 per unit promise volume but compress developer margins to single-digits, foreshadowing consolidation among undercapitalized firms. Counterfeit panel inflows and optional certification regimes remain systemic risks to long-term customer trust.
Pakistan Solar Energy Industry Leaders
Yellow Door Energy
Reon Energy Ltd
Zonergy
Shams Power Ltd
Alpha Renewables
- *Disclaimer: Major Players sorted in no particular order

Market Opportunities and Future Outlook
A clearer whitespace is emerging in utility-scale and infrastructure-integrated solar, which can ease stress on strained urban feeders while expanding supply in underserved regions. This includes the planned 500 MW floating solar project at Keenjhar Lake in Sindh (structured to supply K-Electric) and the government-led 100 MW Gilgit-Baltistan solar initiative, combining an 82 MW utility-scale component with 18 MW of distributed systems across 499 government buildings targeted for completion by December 2026. Together, these projects translate into addressable demand for EPC delivery, grid interconnection engineering, and performance monitoring across both centralized and distributed footprints.
On the distributed side, recent market design changes are shifting the solution mix toward higher self-consumption and hybridization. In FY2025-26, solar net metering accounted for 1,663 MW of the 1,820 MW added to the grid, which points to the size of the existing rooftop base. The February 2026 prosumer rule change to net billing for new entrants increases the value of load-matching, power quality, and storage-enabled designs in residential and C&I settings. Equipment quality assurance is also becoming more actionable as government-backed lab capacity (Pak-Korea Solar Testing Lab) and standards alignment raise scrutiny of module and inverter performance, supporting certified testing, installer credentialing, and bankable product supply chains.
Recent Industry Developments
- July 2026: The Power Division and Prime Minister's Office advanced a 100 MW solar push for Gilgit-Baltistan, combining an 82 MW utility-scale project with 18 MW of rooftop systems planned across 499 government buildings by December 2026. The program broadens addressable demand for EPC contractors, interconnection works, and O&M in a region where reliability constraints make distributed solar strategically important.
- May 2026: The Government of Pakistan outlined plans for a 500 MW floating solar project at Keenjhar Lake in Sindh, with an estimated cost of about USD 243.63 million and an offtake link to K-Electric. The scale and configuration introduce a new utility procurement lane for PV, creating downstream demand for floating PV technology, marine-grade balance-of-system, and grid integration services.
- June 2025: Reon Energy signed an agreement with Soorty Textile for a 7.88 MW solar plant integrated with a 7.63 MWh battery energy storage system (BESS). The deal underscores the growing role of solar-plus-storage in Pakistan's C&I segment to manage intermittency and reduce reliance on grid supply during peak-demand disruptions.


Research Methodology Framework and Report Scope
Market Definition and Coverage
For this report, the Pakistan solar energy market is sized as the country's installed solar capacity added and operating across the year, measured in gigawatts, covering grid-tied and off-grid deployments.
Scope exclusions: We exclude non-solar renewables and we do not count solar-related services unless they translate into installed capacity (GW).
Segmentation Overview
- By Technology
- Solar Photovoltaic (PV)
- Concentrated Solar Power (CSP)
- By Grid Type
- On-Grid
- Off-Grid
- By End-User
- Utility-Scale
- Commercial and Industrial (C&I)
- Residential
- By Component (Qualitative Analysis)
- Solar Modules/Panels
- Inverters (String, Central, Micro)
- Mounting and Tracking Systems
- Balance-of-System and Electricals
- Energy Storage and Hybrid Integration
Data Sources, Market Sizing, and Validation
Desk Research
Desk work starts by building the fact base that anchors the model inputs, including policy direction, grid expansion plans, and the latest public statistics on power generation and capacity. For Pakistan solar, we mainly use sources such as Alternative Energy Development Board materials, NEPRA publications, Pakistan Bureau of Statistics releases, and State Bank of Pakistan macro tables to keep assumptions aligned with local conditions.
To stress-test solar build-out signals, we also review sources such as IEA and IRENA dashboards, UN Comtrade trade statistics for solar equipment flows (as a direction check rather than a direct proxy), customs and tariff notifications published by the government, plus company filings, investor presentations, and credible press coverage of awarded and commissioned projects. A paid subscription for company financials and intelligence, and an import-export shipment-level database, are used selectively to verify entity activity and timing when public disclosures are thin. These desk research sources are illustrative, and many other public documents and datasets were also reviewed for data collection, cross-checking, and clarification.
Primary Interviews and Surveys
We use interviews and surveys with Pakistani utilities, project developers, EPC installers, distributors, industrial users, and policy experts to test import-to-installation conversion, system prices, inventory, and policy effects. Their feedback fills gaps in off-grid records, checks secondary data, and helps triangulate assumptions and the final view.
Distribution of primary research fieldwork respondents
| Company type | Respondent position |
|---|---|
| Top tier: 27% | CXOs: 18% |
| Mid tier: 48% | Functional/Unit leaders: 32% |
| Smaller Players: 25% | Managers: 50% |
Market-Sizing & Forecasting
Sizing is built using top-down and bottom-up logic together, but the core build is top-down, where national capacity additions are reconstructed from policy targets, grid connection signals, and the visible project pipeline that can realistically be commissioned in-year. To keep the totals grounded, we then corroborate with selective bottom-up approximations, such as sampled project capacities by end user, distributor and installer channel checks, and typical system sizing ranges for C&I and residential installations.
Key inputs used in the model include announced versus commissioned utility-scale capacity, interconnection and grid readiness indicators, solar module and inverter import direction as a supporting signal, financing availability and expected payback trends, and policy and tariff shifts that impact adoption timing. Forecasts are produced using scenario analysis, where base, slower, and faster adoption paths are shaped by these drivers and then aligned to expert views gathered in interviews so the pace of additions stays realistic. Where bottom-up signals are incomplete, gaps are handled through clearly stated penetration and commissioning-rate assumptions that are rechecked against recent project outcomes.
Data Validation & Update Cycle
Validation is done in steps, starting with cross-checking the modeled capacity trajectory against independent markers such as commissioning news, regulator disclosures, and macro power-sector constraints, and then reviewing any large year-to-year jumps for plausibility. Outliers are flagged, assumptions are revisited, and follow-up calls are triggered when a single data point changes the curve more than expected.
Before sign-off, the work is reviewed by another analyst to ensure definitions, units, and conversions are consistent and that the logic can be repeated. The report is refreshed annually, and interim updates are made when there are material policy changes, major project awards, or unusual import swings. Right before delivery, a final pass is completed so clients receive the most current view available.
Mordor Intelligence's Pakistan Solar Energy Market Sizing Compared With Other Published Estimates
Published market sizes for Pakistan solar often do not match because different sources measure different things, and the unit choice changes the story quickly. Some estimates are value-based in USD and others are capacity-based in GW, and timing assumptions around commissioning can also shift the number for the same calendar year.
Import direction checks and commissioning validation from public project disclosures are the controls that tie Mordor Intelligence's number to installed capacity (GW), rather than to equipment spending that can move with module prices and exchange rates. Gaps also come from whether rooftop and off-grid systems are counted only when they are installed and operating, or when equipment is imported or sold through channels.
Benchmark comparison
| Source | Market Size | Gaps in Research Methodology |
|---|---|---|
| Mordor Intelligence | USD 6.75 B (2025) | |
| Regional Consultancy A | USD 1.20 B (2023) | Uses a USD value lens that can mix equipment sales and project spend, and it can also treat imports as demand, which shifts totals away from installed capacity counted after commissioning. |
| Industry Brief B | USD 5.50 B (2025) | Often framed as annual investment flow rather than installed capacity, so a single year can look larger when one-off procurements and EPC spend are treated as market size. |
Overall, the spread is mainly explained by unit choice and the trigger used for counting activity, which is why capacity-based figures do not line up with spending-based totals. By anchoring the totals to installed capacity signals and then rechecking conversion assumptions during the annual refresh, the final market size stays transparent and repeatable for year-on-year comparisons.


Key Questions Answered in the Report
How fast is solar capacity growing in Pakistan?
Installed capacity is forecast to climb from 7.95 GW in 2026 to 18.05 GW by 2031, equal to an 17.82% CAGR.
What is the largest end-user group for solar in Pakistan?
Commercial and industrial consumers held 51.10% of capacity in 2025, led by textile and food processors seeking tariff relief.
How will the proposed net-metering tariff cut affect rooftop paybacks?
If the PKR 27 to PKR 10 unit rate is enforced, residential payback periods could lengthen from four to around eight years.
Which provinces are rolling out subsidized rooftop kits?
Punjab, Sindh, and Khyber Pakhtunkhwa have collectively budgeted programs targeting roughly 400,000 low-income households.
Are battery-storage hybrids gaining traction?
Yes, falling lithium-ion prices and Pakistan’s first 350 MW solar-wind-BESS agreement indicate a pivot toward storage-integrated projects.
What share of imports do Chinese module makers hold?
Chinese brands supply more than 95% of Pakistan’s imported modules, supported by vendor financing and steep price discounts.
Page last updated on:




