Market Overview
| Study Period | 2021 - 2031 |
|---|---|
| Forecast Data Period | 2026 - 2031 |
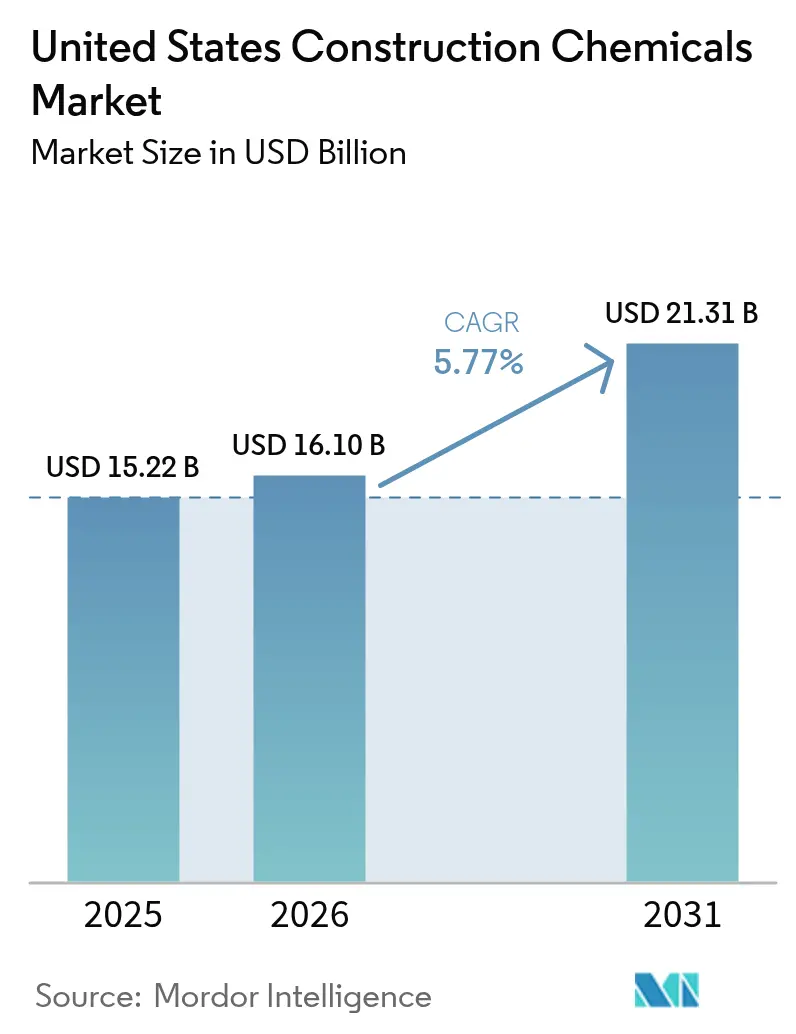
| Base Year Market Size (2025) | USD 15.22 Billion |
| Market Size (2026) | USD 16.10 Billion |
| Market Size (2031) | USD 21.31 Billion |
| Growth Rate (2026 - 2031) | 5.77% CAGR |
| Market Concentration | Medium |
Major Players *Disclaimer: Major Players sorted in no particular order Image © Mordor Intelligence. Reuse requires attribution under CC BY 4.0. | |
United States Construction Chemicals Market Analysis by Mordor Intelligence
The United States Construction Chemicals Market size is projected to expand from USD 15.22 billion in 2025 and USD 16.10 billion in 2026 to USD 21.31 billion by 2031, registering a CAGR of 5.77% between 2026 to 2031. Continued infrastructure rehabilitation, tougher building-code performance standards, and a pivot toward embodied-carbon reduction anchor this expansion. Federal Infrastructure Investment and Jobs Act (IIJA) appropriations have obligated 59% of the USD 1.2 trillion authorization, redirecting spending from greenfield capacity to repair-oriented applications that favor protective coatings, anchoring grouts, and fiber-wrapping systems. Residential remodeling channels an aging housing stock median age above 40 years into moisture-barrier membranes and structural adhesives, lessening exposure to the cyclicality of new-home starts. State-level climate codes, led by California’s CALGreen update, require embodied-carbon disclosures and volatile-organic-compound (VOC) ceilings, spurring rapid formulation shifts toward low-VOC, bio-based, and carbon-mineralization chemistries that attract Internal Revenue Service (IRS) Section 45Q and Section 48C credit. Competitive intensity remains high as global majors execute acquisitions that secure specialty-repair know-how and regional applicator networks ahead of forthcoming federal Buy Clean procurement rules.
Key Report Takeaways
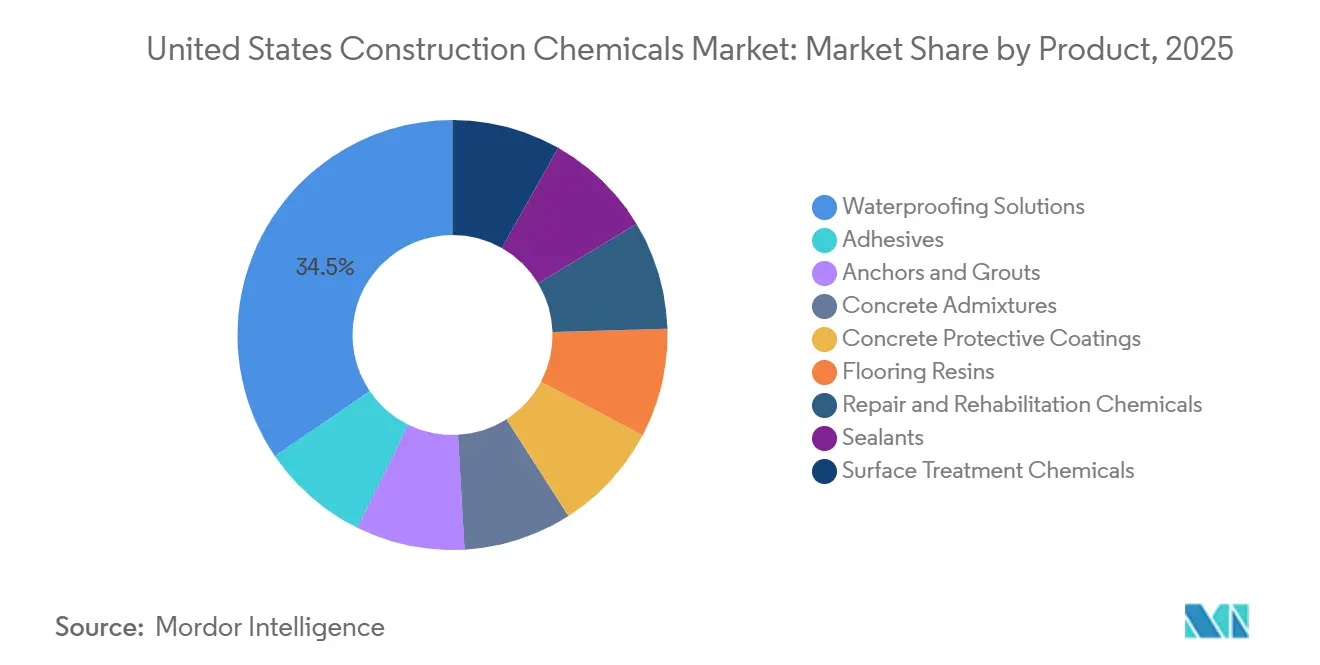
- By product, waterproofing solutions captured 34.51% of the United States construction chemicals market share in 2025 and are projected to expand at a 6.14% CAGR through 2031.
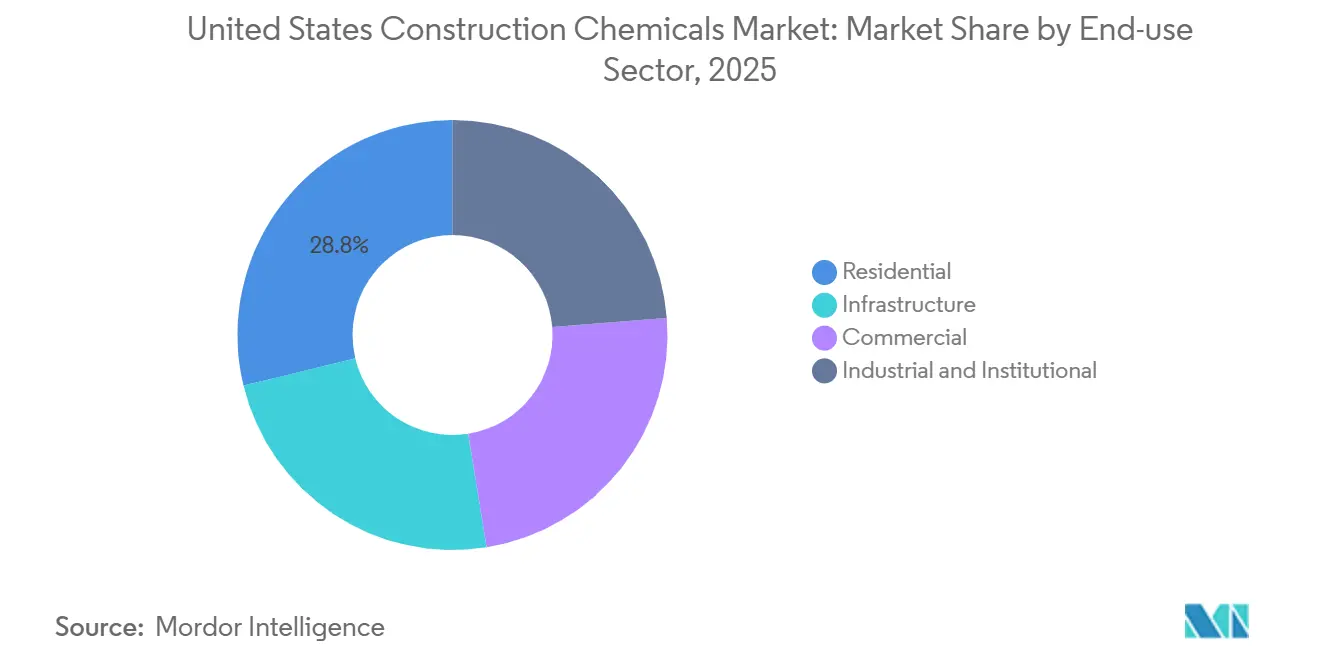
- By end-use sector, the residential segment accounted for 28.77% of the United States construction chemicals market share in 2025 and is projected to expand at a 6.27% CAGR through 2031.
Note: Market size and forecast figures in this report are generated using Mordor Intelligence’s proprietary estimation framework, updated with the latest available data and insights as of 2026.
United States Construction Chemicals Market Trends and Insights
Drivers Impact Analysis*
| Driver | (~) % Impact on CAGR Forecast | Geographic Relevance | Impact Timeline |
|---|---|---|---|
| Housing-start rebound and repair backlog | +1.4% | National, with concentration in Sunbelt and aging Northeast | Medium term (2–4 years) |
| Shift toward high-performance and green admixtures | +1.2% | California, Washington, Massachusetts lead; national diffusion | Long term (≥4 years) |
| Code-driven uptake of waterproofing and protective coatings | +1.6% | Coastal and high-precipitation states; IIJA infrastructure hubs | Medium term (2–4 years) |
| Modular construction demand for rapid-cure chemistries | +0.9% | Urban multifamily corridors (DFW, Austin, Phoenix, Charlotte) | Short term (≤2 years) |
| Tax incentives for embodied-carbon reduction boosting bio-based additives | +0.7% | Federal procurement; early adopters in CA, NY, IL | Long term (≥4 years) |
| Source: Mordor Intelligence | |||


Housing-Start Rebound and Repair Backlog
Single-family permits dipped 5% year-over-year in early 2025, yet home-improvement spending is projected to increase to USD 485 billion in 2025 as owners tackle deferred maintenance on foundations, roofs, and exterior envelopes. Moisture-intrusion failures and a median housing age above 40 years are steering demand toward crystalline waterproofing, hydrophobic sealers, and acrylic crack fillers that together account for over half of residential chemical consumption. Persistent mortgage rates near 7% in late 2025 kept existing-home turnover low, pushing discretionary budgets toward renovation rather than relocation. Parallel public-sector backlogs highlight 42% of bridges exceeding 50 years in service, favoring fiber-reinforced-polymer wraps and epoxy injections in bridge-deck repairs.
Shift Toward High-Performance and Green Admixtures
CALGreen’s July 2024 embodied-carbon requirement and General Services Administration (GSA) pilot procurements that reward environmental product declarations have accelerated adoption of supplementary cementitious materials and high-range water-reducers that enable 30%–50% clinker replacement[1]California Building Standards Commission, “CALGreen 2024,” bsc.ca.gov. HOLCIM’s ECOPlanet cement, which cuts CO₂ intensity by 30%, gained traction on West Coast infrastructure in 2025, while BASF’s MasterGlenium SKY 8700 supports water-cement ratios below 0.30, lowering embodied carbon per cubic yard. Graphene-oxide additives capable of sequestering dissolved CO₂ remain confined to pilot projects because state departments of transportation (DOTs) require multi-year field trials before qualifying novel chemistries.
Code-Driven Uptake of Waterproofing and Protective Coatings
The International Building Code (IBC) 2024 mandates continuous air- and water-barrier systems for commercial envelopes, and ACI 318-19 specifies corrosion inhibitors for chloride-exposed parking structures. IIJA allocates USD 110 billion for road and bridge projects, supporting double-digit growth in polyurethane and epoxy protective coatings on bridge decks and tunnel linings. The South Coast Air Quality Management District (SCAQMD) caps architectural-coating VOC content at 50 g/L, compelling water-borne reformulations that nevertheless retain adhesion and UV resistance.
Modular Construction Demand for Rapid-Cure Chemistries
Factory-built modules expanded 6%–7% annually in 2024-2025, emphasizing speed-to-occupancy for multifamily housing, healthcare, and student residences. Production lines require concrete panels to reach handling strength within six hours, elevating demand for calcium-nitrate and lithium accelerators that outperform chloride-based agents at low temperatures. Dow’s silicone adhesives and Henkel’s reactive hot-melts have gained share in panel bonding by eliminating multi-day cure windows and reducing factory footprints by 20%.
Restraints Impact Analysis*
| Restraint | (~) % Impact on CAGR Forecast | Geographic Relevance | Impact Timeline |
|---|---|---|---|
| Tightening VOC and toxic-chemical regulations | -0.6% | California, Northeast states; national EPA rules | Short term (≤2 years) |
| Skilled applicator shortage for advanced systems | -0.8% | National, acute in Sunbelt growth markets | Medium term (2–4 years) |
| Risk aversion among DOT specifiers delaying novel admixture approvals | -0.5% | State DOTs; federal highway projects | Long term (≥4 years) |
| Source: Mordor Intelligence | |||
Tightening VOC and Toxic-Chemical Regulations
The EPA aerosol-coatings rule effective January 2025 lowered permissible VOC levels, triggering a sector-wide scramble to reformulate roof coatings and marking paints[2]Environmental Protection Agency, “National Volatile Organic Compound Emission Standards for Aerosol Coatings,” epa.gov . California’s Proposition 65 added three construction-chemical intermediates in 2024, compelling new warning labels and spurring substitution toward bio-based isocyanates and amine-free curing agents that carry 15%–25% cost premiums. South Coast AQMD’s 50 g/L cap on architectural coatings effectively bans many solvent-borne systems, compressing mid-tier formulator margins and accelerating consolidation.
Skilled Applicator Shortage for Advanced Systems
An August 2024 survey indicated 80% of contractors could not fill craft positions, with more than 370,000 vacancies nationwide. Multi-component epoxy flooring and fiber-reinforced-polymer wraps require certified technicians, yet field apprenticeships remain scarce. Contractors are defaulting to single-component, moisture-curing alternatives that trade ultimate performance for simplicity, softening demand for premium chemistries.
*Our forecasts treat driver/restraint impacts as directional, not additive. The impact forecasts reflect baseline growth, mix effects, and variable interactions.
Segment Analysis
By Product: Waterproofing Solutions Sustain Leadership as Codes Tighten
Waterproofing solutions captured 34.51% of the United States construction chemicals market share in 2025 and are forecast to expand at a 6.14% CAGR through 2031. Their acceleration reflects aging structures facing moisture-intrusion failures and code-mandated continuous air- and water-barrier systems. Crystalline admixtures and hydrophobic sealers have become more prominent in below-grade applications due to their ability to eliminate labor-intensive membrane welding, a significant advantage amid skilled labor shortages. In contrast, membrane technologies continue to dominate above-grade envelope retrofits, particularly thermoplastic polyolefin (TPO) and polyvinyl-chloride (PVC) roofing systems, which comply with Title 24 cool-roof regulations. Meanwhile, accelerators and shrinkage reducers are experiencing faster growth, driven by modular factory cycle-time requirements.
Water-borne adhesives are also achieving growth following the implementation of EPA and SCAQMD VOC limits, while reactive polyurethanes maintain their leading position in structural glazing applications, where bond strengths exceed 2,000 psi. Concrete protective coatings are directly benefiting from the USD 110 billion allocation under the IIJA for bridge rehabilitation, with epoxy systems accounting for over half of bridge-deck applications due to their superior chloride resistance. Polyaspartic flooring resins, which cure within two hours, are meeting the stringent downtime requirements of e-commerce fulfillment centers. Repair chemicals, such as fiber wraps and injection grouts, are addressing the needs of structurally deficient bridges and offer installation speeds 70% faster than steel-plate bonding, reinforcing the size and growth of the United States construction chemicals market in the infrastructure segment.


By End-use Sector: Residential Repair Pipeline Drives Outperformance
The residential segment commanded 28.77% of the United States construction chemicals market share in 2025 and leads growth with a 6.27% CAGR through 2031, reflecting a USD 485 billion remodeling pipeline and mortgage-rate-induced stay-and-renovate behavior. Foundation waterproofing, basement crack injections, and exterior sealant replacements are prominent, with crystalline admixtures, which offer lifetime warranties, becoming more popular compared to membranes that need reapplication every 15 years. Commercial demand faces mixed signals; high office vacancies suppress new builds, yet data-center expansion by hyperscalers lifts demand for electrostatic-dissipative flooring and rapid-cure adhesives that reduce rack installation downtime. Industrial and institutional facilities emphasize chemical-resistant flooring that withstands forklift traffic and thermal cycling, while food-processing plants specify antimicrobial additives to meet USDA protocols. Infrastructure remains the largest aggregate outlet for admixtures and repair chemicals, as state DOTs pivot toward pavement preservation and bridge overlays rather than new lane-mile construction, sustaining the United States construction chemicals market share in public works.
Geography Analysis
California, Florida, New York, and Texas benefit from hurricane resilience mandates, salt-spray corrosion challenges, and the continuous repair needs of dense urban transit systems. California’s CALGreen disclosure law and the South Coast Air Quality Management District’s (SCAQMD) strict 50 g/L VOC cap have positioned the state as a hub for low-carbon, water-borne chemistries, which often expand to nationwide adoption. Texas’s USD 85 billion decadal infrastructure plan, coupled with rapid population growth in the Dallas-Fort Worth, Houston, and Austin corridors, drives demand for superplasticizers and sealants at rates 20% higher than the national average.
The Northeast faces challenges from aging infrastructure, with 42% of bridges exceeding 50 years of service. Freeze-thaw cycles exacerbate rebar corrosion, increasing the need for air-entrained concrete and chloride-resistant epoxies. Massachusetts’s 2024 Climate Bill established an Embodied Carbon Council to set procurement thresholds for state-funded projects, signaling potential regional growth in the adoption of low-clinker concrete mixes. In the Sunbelt states, Arizona, Nevada, Georgia, and North Carolina, growth in residential permits is offset by significant craft-labor shortages. This has led to increased reliance on premixed adhesives and single-component sealants to reduce on-site complexity.
Midwestern states, including Illinois, Ohio, and Michigan, rely heavily on funding from the Infrastructure Investment and Jobs Act (IIJA) to address deferred maintenance needs. Illinois’s USD 17 billion transportation allocation through 2026 supports consistent demand for concrete repair mortars and epoxy injections. These investments contribute to balanced regional growth in the United States construction chemicals market, even as private non-residential spending slows.
Competitive Landscape
Top players, such as BASF, Sika AG, MAPEI S.p.A., Saint-Gobain, and RPM International collectively account for roughly 59% of the United States construction chemicals market share in 2025, while more than 200 regional formulators fragment the remainder. Mergers and acquisitions target low-carbon product lines and regional applicator networks; Saint-Gobain’s November 2024 acquisition of Fosroc and RPM’s December 2024 purchase of Kirker Enterprises illustrate the rush to secure specialty-repair capabilities before embodied-carbon disclosure becomes a federal procurement gate. Patent filings in 2024-2025 highlight carbon-mineralization admixtures, graphene-enhanced mortars, and bio-polyol sealants, but state DOT approval cycles of two to five years delay commercialization. Digitalization differentiates incumbents; leading suppliers deploy machine-learning dosing models that cut ready-mix variability to ±2%, whereas mid-tier producers still rely on manual adjustments with ±10% swings. Accelerating consolidation is likely as escalating VOC and embodied-carbon compliance costs exceed the resources of sub-scale formulators lacking centralized R&D. White-space opportunities remain in rapid-cure systems for modular factories, low-VOC chemistries suitable for sub-freezing application, and self-leveling resins that cure in four hours to meet e-commerce warehouse downtime constraints.
Labor friction shapes product strategies: certified applicator shortages steer demand toward single-component, rapid-cure products that reduce field complexity. Smaller challengers leverage direct-to-contractor e-commerce and same-day delivery to chip away at incumbents’ share in waterproofing and repair niches where brand loyalty is comparatively weak.
United States Construction Chemicals Industry Leaders
Sika AG
MAPEI S.p.A.
RPM International Inc.
Saint-Gobain
BASF
- *Disclaimer: Major Players sorted in no particular order

Recent Industry Developments
- December 2025: Sika AG's new plant in Haines City became operational, marking a significant milestone in the company's expansion within Florida and the southeastern United States. The facility incorporated advanced levels of digitalization and automation, setting a benchmark for efficiency in concrete admixture production in the United States.
- March 2025: Sika AG fully acquired HPS North America, Inc., a supplier of building finishing materials. HPS distributed Schönox-branded products in the United States market.


United States Construction Chemicals Market Report Scope
Construction chemicals are specialized formulations incorporated into building materials such as concrete, mortar, and cement to improve durability, strength, workability, and resistance to environmental factors. These chemicals are utilized across various stages of construction, from foundational work to final finishes, to ensure long-term structural integrity.
The United States Construction Chemicals market is segmented by product and end-use sector. By product, the market is segmented into waterproofing solutions, adhesives, anchors and grouts, concrete admixtures, concrete protective coatings, flooring resins, repair and rehabilitation chemicals, sealants, and surface treatment chemicals. By chemicals, the market is sub-segmented into membranes, adhesives, hot-melt, reactive, solvent-borne, and water-borne. By anchors and grouts, the market is sub-segmented into cementitious fixing and resin fixing. By concrete admixtures, the market is sub-segmented into accelerator, air-entraining, super-plasticizer, retarder, shrinkage-reducer, viscosity-modifier, plasticizer, and other concrete admixtures. By concrete protective coatings, the market is sub-segmented into acrylic, alkyd, epoxy, polyurethane, and other concrete protective coatings. By flooring resins, the market is sub-segmented into acrylic, epoxy, polyaspartic, polyurethane, and other flooring resins. By repair and rehabilitation chemicals, the market is sub-segmented into fiber-wrapping systems, injection grouting, micro-concrete mortars, modified mortars, and rebar protectors. By sealants, the market is sub-segmented into acrylic, epoxy, polyurethane, silicone, and other sealants. By surface treatment chemicals, the market is sub-segmented into curing compounds, mold-release agents, and other surface treatment chemicals. By end-use sector, the market is segmented into residential, commercial, industrial and institutional, and infrastructure. For each segment, the market sizing and forecasts have been done on the basis of value (USD).
By Product
| Waterproofing Solutions | Chemicals |
| Membranes | |
| Adhesives | Hot-Melt |
| Reactive | |
| Solvent-borne | |
| Water-borne | |
| Anchors and Grouts | Cementitious Fixing |
| Resin Fixing | |
| Concrete Admixtures | Accelerator |
| Air-Entraining | |
| Super-plasticizer | |
| Retarder | |
| Shrinkage-Reducer | |
| Viscosity-Modifier | |
| Plasticizer | |
| Other Concrete Admixtures | |
| Concrete Protective Coatings | Acrylic |
| Alkyd | |
| Epoxy | |
| Polyurethane | |
| Other Concrete Protective Coatings | |
| Flooring Resins | Acrylic |
| Epoxy | |
| Polyaspartic | |
| Polyurethane | |
| Other Flooring Resins | |
| Repair and Rehabilitation Chemicals | Fiber-Wrapping Systems |
| Injection Grouting | |
| Micro-concrete Mortars | |
| Modified Mortars | |
| Rebar Protectors | |
| Sealants | Acrylic |
| Epoxy | |
| Polyurethane | |
| Silicone | |
| Other Sealants | |
| Surface Treatment Chemicals | Curing Compounds |
| Mold-Release Agents | |
| Other Surface Treatment Chemicals |
By End-use Sector
| Residential |
| Commercial |
| Industrial and Institutional |
| Infrastructure |
| By Product | Waterproofing Solutions | Chemicals |
| Membranes | ||
| Adhesives | Hot-Melt | |
| Reactive | ||
| Solvent-borne | ||
| Water-borne | ||
| Anchors and Grouts | Cementitious Fixing | |
| Resin Fixing | ||
| Concrete Admixtures | Accelerator | |
| Air-Entraining | ||
| Super-plasticizer | ||
| Retarder | ||
| Shrinkage-Reducer | ||
| Viscosity-Modifier | ||
| Plasticizer | ||
| Other Concrete Admixtures | ||
| Concrete Protective Coatings | Acrylic | |
| Alkyd | ||
| Epoxy | ||
| Polyurethane | ||
| Other Concrete Protective Coatings | ||
| Flooring Resins | Acrylic | |
| Epoxy | ||
| Polyaspartic | ||
| Polyurethane | ||
| Other Flooring Resins | ||
| Repair and Rehabilitation Chemicals | Fiber-Wrapping Systems | |
| Injection Grouting | ||
| Micro-concrete Mortars | ||
| Modified Mortars | ||
| Rebar Protectors | ||
| Sealants | Acrylic | |
| Epoxy | ||
| Polyurethane | ||
| Silicone | ||
| Other Sealants | ||
| Surface Treatment Chemicals | Curing Compounds | |
| Mold-Release Agents | ||
| Other Surface Treatment Chemicals | ||
| By End-use Sector | Residential | |
| Commercial | ||
| Industrial and Institutional | ||
| Infrastructure | ||


Market Definition
- END-USE SECTOR - Construction chemicals consumed in the construction sectors such as commercial, residential, industrial, institutional, and infrastructure are considered under the scope of the study.
- PRODUCT/APPLICATION - Under the scope of the study, the consumption of construction chemical products such as concrete admixtures, repair and rehabilitation chemicals, flooring resins, waterproofing solutions, anchors and grouts, adhesives and sealants, and surface treatment chemicals is considered.
| Keyword | Definition |
|---|---|
| Accelerator | Accelerators are admixtures used to fasten the setting time of concrete by increasing the initial rate and speeding up the chemical reaction between cement and the mixing water. These are used to harden and increase the strength of concrete quickly. |
| Acrylic | This synthetic resin is a derivative of acrylic acid. It forms a smooth surface and is mainly used for various indoor applications. The material can also be used for outdoor applications with a special formulation. |
| Adhesives | Adhesives are bonding agents used to join materials by gluing. Adhesives can be used in construction for many applications, such as carpet laying, ceramic tiles, countertop lamination, etc. |
| Air Entraining Admixture | Air-entraining admixtures are used to improve the performance and durability of concrete. Once added, they create uniformly distributed small air bubbles to impart enhanced properties to the fresh and hardened concrete. |
| Alkyd | Alkyds are used in solvent-based paints such as construction and automotive paints, traffic paints, flooring resins, protective coatings for concrete, etc. Alkyd resins are formed by the reaction of an oil (fatty acid), a polyunsaturated alcohol (Polyol), and a polyunsaturated acid or anhydride. |
| Anchors and Grouts | Anchors and grouts are construction chemicals that stabilize and improve the strength and durability of foundations and structures like buildings, bridges, dams, etc. |
| Cementitious Fixing | Cementitious fixing is a process in which a cement-based grout is pumped under pressure to fill forms, voids, and cracks. It can be used in several settings, including bridges, marine applications, dams, and rock anchors. |
| Commercial Construction | Commercial construction comprises new construction of warehouses, malls, shops, offices, hotels, restaurants, cinemas, theatres, etc. |
| Concrete Admixtures | Concrete admixtures comprise water reducers, air entrainers, retarders, accelerators, superplasticizers, etc., added to concrete before or during mixing to modify its properties. |
| Concrete Protective Coatings | To provide specific protection, such as anti-carbonation or chemical resistance, a film-forming protective coat can be applied on the surface. Depending on the applications, different resins like epoxy, polyurethane, and acrylic can be used for concrete protective coatings. |
| Curing Compounds | Curing compounds are used to cure the surface of concrete structures, including columns, beams, slabs, and others. These curing compounds keep the moisture inside the concrete to give maximum strength and durability. |
| Epoxy | Epoxy is known for its strong adhesive qualities, making it a versatile product in many industries. It resists heat and chemical applications, making it an ideal product for anyone needing a stronghold under pressure. It is widely used in adhesives, electrical and electronics, paints, etc. |
| Fiber Wrapping Systems | Fiber Wrapping Systems are a part of construction repair and rehabilitation chemicals. It involves the strengthening of existing structures by wrapping structural members like beams and columns with glass or carbon fiber sheets. |
| Flooring Resins | Flooring resins are synthetic materials applied to floors to enhance their appearance, increase their resistance to wear and tear or provide protection from chemicals, moisture, and stains. Depending on the desired properties and the specific application, flooring resins are available in distinct types, such as epoxy, polyurethane, and acrylic. |
| High-Range Water Reducer (Super Plasticizer) | High-range water reducers are a type of concrete admixture that provides enhanced and improved properties when added to concrete. These are also called superplasticizers and are used to decrease the water-to-cement ratio in concrete. |
| Hot Melt Adhesives | Hot-melt adhesives are thermoplastic bonding materials applied as melts that achieve a solid state and resultant strength on cooling. They are commonly used for packaging, coatings, sanitary products, and tapes. |
| Industrial and Institutional Construction | Industrial and institutional construction includes new construction of hospitals, schools, manufacturing units, energy and power plants, etc. |
| Infrastructure Construction | Infrastructure construction includes new construction of railways, roads, seaways, airports, bridges, highways, etc. |
| Injection Grouting | The process of injecting grout into open joints, cracks, voids, or honeycombs in concrete or masonry structural members is known as injection grouting. It offers several benefits, such as strengthening a structure and preventing water infiltration. |
| Liquid-Applied Waterproofing Membranes | Liquid-Applied membrane is a monolithic, fully bonded, liquid-based coating suitable for many waterproofing applications. The coating cures to form a rubber-like elastomeric waterproof membrane and may be applied over many substrates, including asphalt, bitumen, and concrete. |
| Micro-concrete Mortars | Micro-concrete mortar is made up of cement, water-based resin, additives, mineral pigments, and polymers and can be applied on both horizontal and vertical surfaces. It can be used to refurbish residential complexes, commercial spaces, etc. |
| Modified Mortars | Modified Mortars include Portland cement and sand along with latex/polymer additives. The additives increase adhesion, strength, and shock resistance while also reducing water absorption. |
| Mold Release Agents | Mold release agents are sprayed or coated on the surface of molds to prevent a substrate from bonding to a molding surface. Several types of mold release agents, including silicone, lubricant, wax, fluorocarbons, and others, are used based on the type of substrates, including metals, steel, wood, rubber, plastic, and others. |
| Polyaspartic | Polyaspartic is a subset of polyurea. Polyaspartic floor coatings are typically two-part systems that consist of a resin and a catalyst to ease the curing process. It offers high durability and can withstand harsh environments. |
| Polyurethane | Polyurethane is a plastic material that exists in various forms. It can be tailored to be either rigid or flexible and is the material of choice for a broad range of end-user applications, such as adhesives, coatings, building insulation, etc. |
| Reactive Adhesives | A reactive adhesive is made of monomers that react in the adhesive curing process and do not evaporate from the film during use. Instead, these volatile components become chemically incorporated into the adhesive. |
| Rebar Protectors | In concrete structures, rebar is one of the important components, and its deterioration due to corrosion is a major issue that affects the safety, durability, and life span of buildings and structures. For this reason, rebar protectors are used to protect against degrading effects, especially in infrastructure and industrial construction. |
| Repair and Rehabilitation Chemicals | Repair and Rehabilitation Chemicals include repair mortars, injection grouting materials, fiber wrapping systems, micro-concrete mortars, etc., used to repair and restore existing buildings and structures. |
| Residential Construction | Residential construction involves constructing new houses or spaces like condominiums, villas, and landed homes. |
| Resin Fixing | The process of using resins like epoxy and polyurethane for grouting applications is called resin fixing. Resin fixing offers several advantages, such as high compressive and tensile strength, negligible shrinkage, and greater chemical resistance compared to cementitious fixing. |
| Retarder | Retarders are admixtures used to slow down the setting time of concrete. These are usually added with a dosage rate of around 0.2% -0.6% by weight of cement. These admixtures slow down hydration or lower the rate at which water penetrates the cement particles by making concrete workable for a long time. |
| Sealants | A sealant is a viscous material that has little or no flow qualities, which causes it to remain on surfaces where they are applied. Sealants can also be thinner, enabling penetration to a certain substance through capillary action. |
| Sheet Waterproofing Membranes | Sheet membrane systems are reliable and durable thermoplastic waterproofing solutions that are used for waterproofing applications even in the most demanding below-ground structures, including those exposed to highly aggressive ground conditions and stress. |
| Shrinkage Reducing Admixture | Shrinkage-reducing admixtures are used to reduce concrete shrinkage, whether from drying or self-desiccation. |
| Silicone | Silicone is a polymer that contains silicon combined with carbon, hydrogen, oxygen, and, in some cases, other elements. It is an inert synthetic compound that comes in various forms, such as oil, rubber, and resin. Due to its heat-resistant properties, it finds applications in sealants, adhesives, lubricants, etc. |
| Solvent-borne Adhesives | Solvent-borne adhesives are mixtures of solvents and thermoplastic or slightly cross-linked polymers such as polychloroprene, polyurethane, acrylic, silicone, and natural and synthetic rubbers. |
| Surface Treatment Chemicals | Surface treatment chemicals are chemicals used to treat concrete surfaces, including roofs, vertical surfaces, and others. They act as curing compounds, demolding agents, rust removers, and others. They are cost-effective and can be used on roadways, pavements, parking lots, and others. |
| Viscosity Modifier | Viscosity Modifiers are concrete admixtures used to change various properties of admixtures, including viscosity, workability, cohesiveness, and others. These are usually added with a dosage of around 0.01% to 0.1% by weight of cement. |
| Water Reducer | Water reducers, also called plasticizers, are a type of admixture used to decrease the water-to-cement ratio in the concrete, thereby increasing the durability and strength of concrete. Various water reducers include refined lignosulfonates, gluconates, hydroxycarboxylic acids, sugar acids, and others. |
| Water-borne Adhesives | Water-borne adhesives use water as a carrier or diluting medium to disperse resin. They are set by allowing the water to evaporate or be absorbed by the substrate. These adhesives are compounded with water as a dilutant rather than a volatile organic solvent. |
| Waterproofing Chemicals | Waterproofing chemicals are designed to protect a surface from the perils of leakage. A waterproofing chemical is a protective coating or primer applied to a structure's roof, retaining walls, or basement. |
| Waterproofing Membranes | Waterproofing membranes are liquid-applied or self-adhering layers of water-tight materials that prevent water from penetrating or damaging a structure when applied to roofs, walls, foundations, basements, bathrooms, and other areas exposed to moisture or water. |


Research Methodology
Mordor Intelligence follows a four-step methodology in all our reports.
- Step-1: Identify Key Variables: The quantifiable key variables (industry and extraneous) pertaining to the specific product segment and country are selected from a group of relevant variables & factors based on desk research & literature review; along with primary expert inputs. These variables are further confirmed through regression modeling (wherever required).
- Step-2: Build a Market Model: In order to build a robust forecasting methodology, the variables and factors identified in Step-1 are tested against available historical market numbers. Through an iterative process, the variables required for market forecast are set and the model is built on the basis of these variables.
- Step-3: Validate and Finalize: In this important step, all market numbers, variables and analyst calls are validated through an extensive network of primary research experts from the market studied. The respondents are selected across levels and functions to generate a holistic picture of the market studied.
- Step-4: Research Outputs: Syndicated Reports, Custom Consulting Assignments, Databases & Subscription Platforms


