Market Overview
| Study Period | 2020 - 2031 |
|---|---|
| Forecast Data Period | 2026 - 2031 |
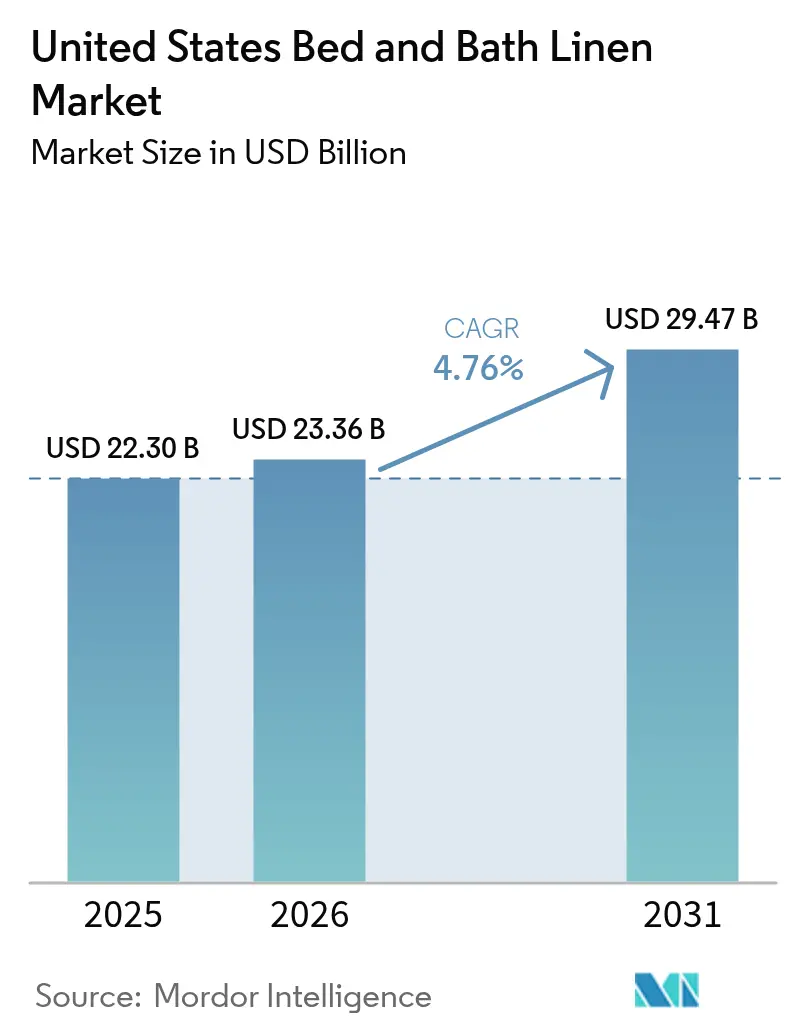
| Base Year Market Size (2025) | USD 22.30 Billion |
| Market Size (2026) | USD 23.36 Billion |
| Market Size (2031) | USD 29.47 Billion |
| Growth Rate (2026 - 2031) | 4.76% CAGR |
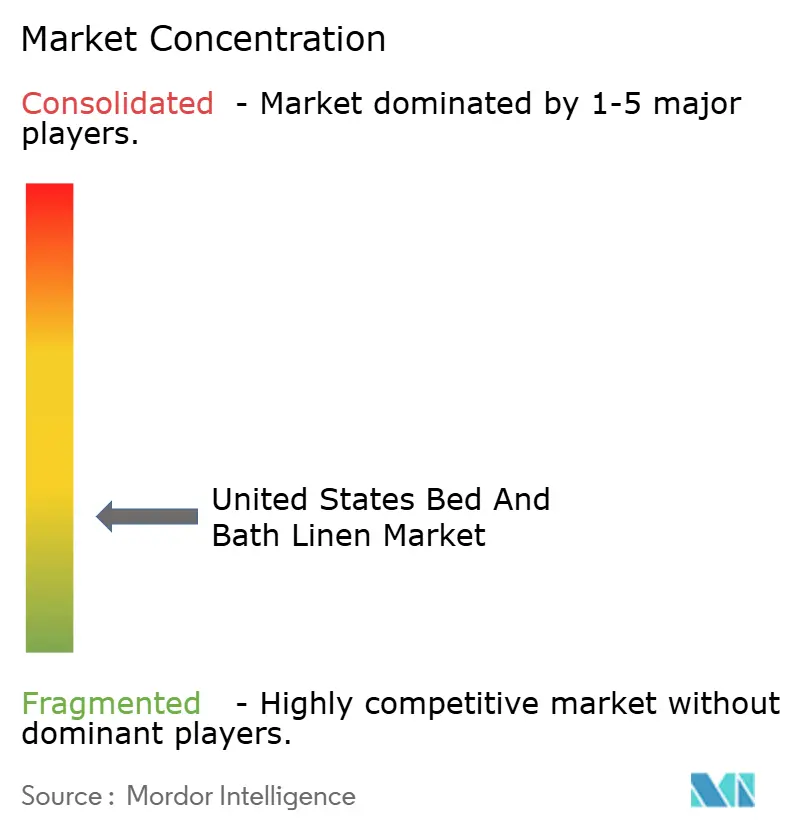
| Market Concentration | Low |
Major Players *Disclaimer: Major Players sorted in no particular order Image © Mordor Intelligence. Reuse requires attribution under CC BY 4.0. | |
United States Bed And Bath Linen Market Analysis by Mordor Intelligence
The United States bed and bath linen market size is expected to grow from USD 22.30 billion in 2025 to USD 23.36 billion in 2026, and is forecast to reach USD 29.47 billion by 2031, at a 4.76% CAGR over 2026-2031. Growth builds on stable institutional procurement, a robust hotel construction pipeline that adds nearly 100,000 rooms in 2026, and sustained home-improvement expenditure led by bathroom remodels that refresh towels, mats, and shower curtains[1]FashionNetwork, “Oeko-Tex sees 8% increase in certifications in 2024/25,” FashionNetwork, fashionnetwork.com. E-commerce penetration continues to rise, now driving a greater share of bed and bath linen purchases, reinforcing direct-to-consumer models and platform partnerships that shorten time-to-market for new collections. Certification momentum shapes demand, with OEKO-TEX issuing 57,412 certificates and labels in 2024 and 2025 combined, and Global Organic Textile Standard registrations expanding further in 2024, signaling firm buyer preferences for verified safe and organic textiles[2]Worley, Mark, and Grishma Bhattarai, “Only 28 Out of Every 1,000 U.S. Homes Changed Hands This Year,” Worley, Mark, and Grishma Bhattarai, redfin.com. Hospitality fundamentals show near-term softness in RevPAR, though mega-events such as the FIFA World Cup 2026 and brand conversion cycles still support linen replenishment tied to standard upgrades.
Key Report Takeaways
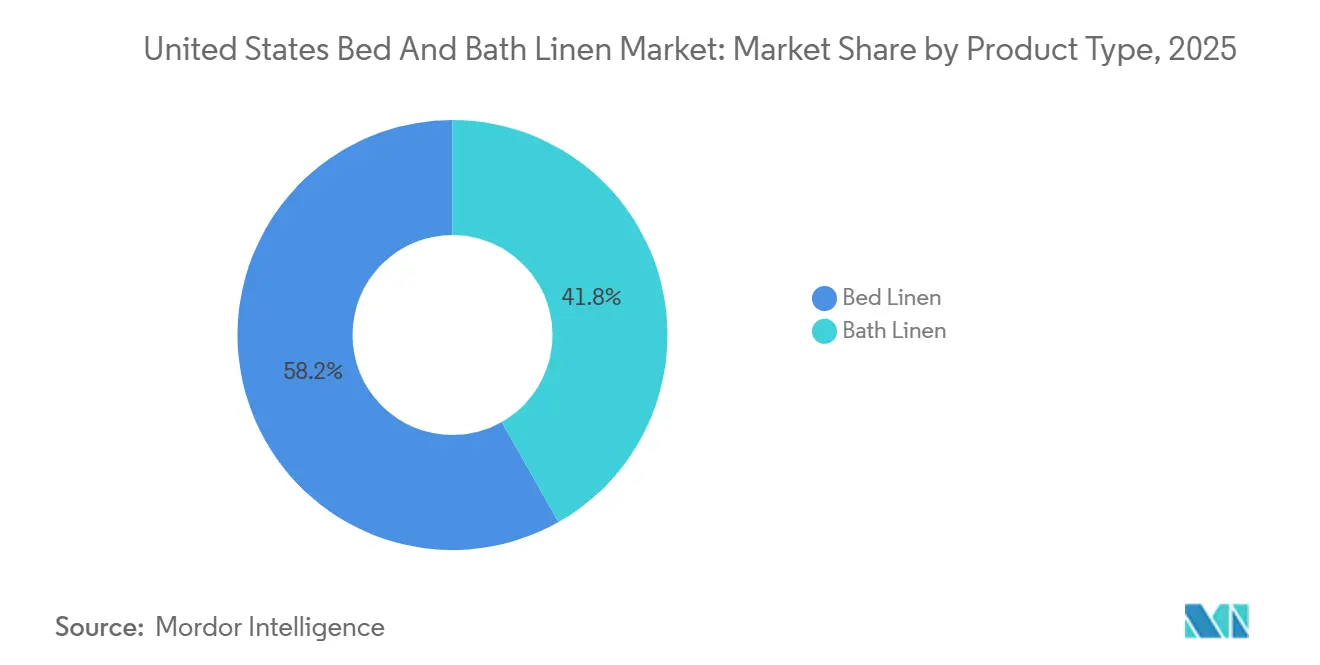
- By product type, bed linen led with 58.21% of the United States bed and bath linen market share in 2025, while bath linen is forecast to expand at a 6.65% CAGR through 2031.
- By end user, residential accounted for 69.15% of the United States bed and bath linen market size in 2025, whereas residential is projected to grow at a 6.48% CAGR through 2031.
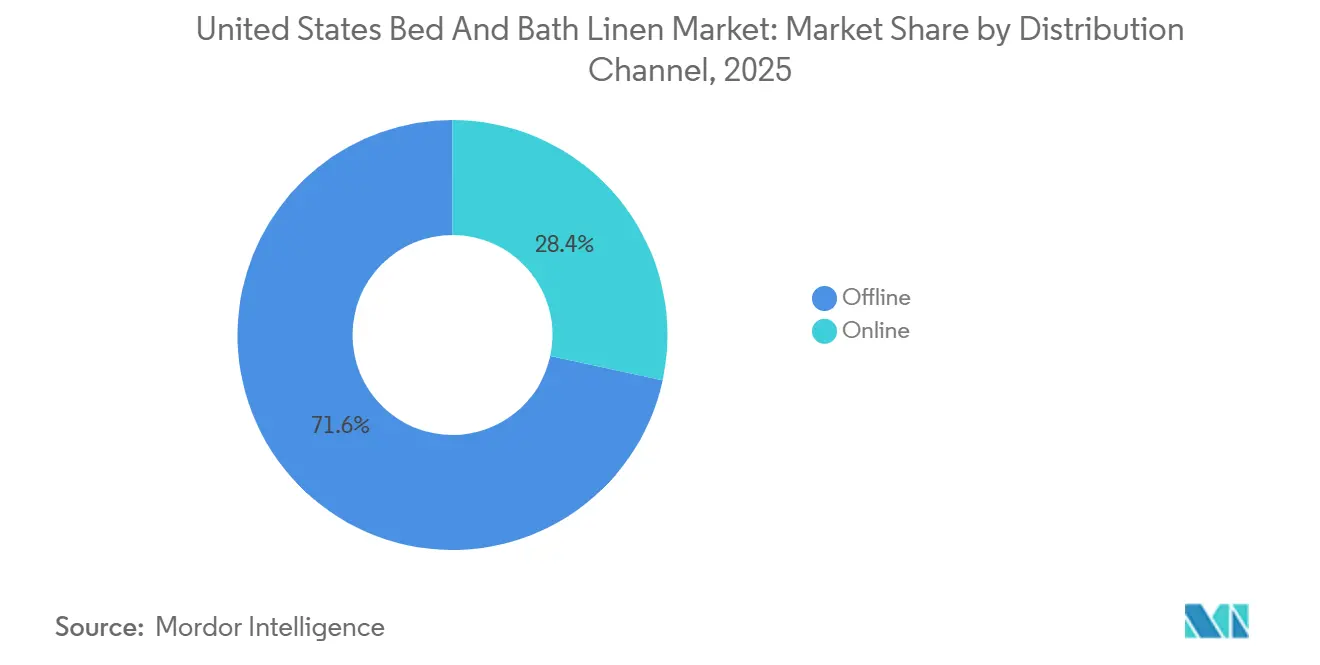
- By distribution channel, offline held 71.62% of the United States bed and bath linen market share in 2025, while online is projected to record a 5.98% CAGR through 2031.
- By material, cotton commanded 71.74% of the United States bed and bath linen market share in 2025, whereas linen is projected to grow at a 6.08% CAGR through 2031.
- By geography, the South led the United States bed and bath linen market with 27.54% market share in 2025, while the West is forecast to record a 5.82% CAGR through 2031.
Note: Market size and forecast figures in this report are generated using Mordor Intelligence’s proprietary estimation framework, updated with the latest available data and insights as of 2026.
United States Bed And Bath Linen Market Trends and Insights
Drivers Impact Analysis*
| Driver | (~) % Impact on CAGR Forecast | Geographic Relevance | Impact Timeline |
|---|---|---|---|
| Residential turnover and renovation cycles | +0.8% | National, strongest in South (27.54% market share), West (5.82% CAGR) | Medium term (2-4 years) |
| Hospitality pipeline, renovations, and brand standards | +1.2% | National, with early gains in New York, Phoenix, Dallas, Orlando, Miami | Short term (≤ 2 years) |
| Institutional demand growth from healthcare, senior living, and student housing facilities | +1.4% | National, concentrated in the Northeast (senior living), the South, and the Sun Belt (student housing expansion) | Long term (≥ 4 years) |
| Sustainability certification-led premiumization (GOTS, OEKO-TEX) | +0.6% | National, over-indexing in Northeast urban centers, West Coast | Medium term (2-4 years) |
| Short-term rental and mid-term stay inventory growth | +0.7% | Coastal markets, Mountain and Lake resorts, Large City Suburban areas | Short term (≤ 2 years) |
| Antimicrobial and performance textiles adoption in commercial settings | +0.5% | National, strongest in the healthcare and hospitality sectors | Medium term (2-4 years) |
| Source: Mordor Intelligence | |||


Residential Turnover and Renovation Cycles
United States home turnover fell to 28 per 1,000 homes in the first nine months of 2025, a 31.2% decline from pre-pandemic 2019 levels, primarily because over 70% of mortgaged homeowners hold mortgage rates below 5% and resist selling into a 6.17% rate environment[3]Worley, Mark, and Grishma Bhattarai, “Only 28 Out of Every 1,000 U.S. Homes Changed Hands This Year,” Worley, Mark, and Grishma Bhattarai, redfin.com. First-time buyers represented 31% of existing-home sales in January 2026, up from 28% a year earlier, a shift that supports repeat purchases of coordinated bed and bath sets for new household setups. Renovation spending reached USD 522 billion in 2025 and is expected to grow 2.9% early in 2026 before moderating to 1.6% by year-end, a pattern that favors bath linen upgrades as homeowners refresh fixtures and soft goods in tandem. Bathroom remodels remain among the most popular projects, with urban households reporting a higher incidence than their non-urban peers, pointing to concentrated demand for towels, bathmats, and shower curtains in dense metro areas, where value per square foot justifies higher-quality textiles.
Hospitality Pipeline, Renovations, and Brand Standards
Hotel construction is rebounding, with the 2027 pipeline tracking 1,688 hotels and nearly 192,000 rooms nationwide. Extended-stay hotels comprise 40% of all projects and 34% of all rooms in the construction pipeline at Q3 2025, with middle-tier extended-stay accounting for 1,648 projects/154,499 rooms[4]Lodging Econometrics Editorial Team, “U.S. Hotel Openings and Pipeline, 2026–2027,” Lodging Econometrics, lodgingeconometrics.com. Brand conversions reached record levels, with 1,477 projects and 148,035 rooms, up 18% by projects and 22% by rooms year over year, prompting owners to replace linens to meet new flag standards for specifications and treatments. Industry forecasts peg 2026 RevPAR growth at just +0.6%, which signals cautious near-term property spending even as installed capacity rises, while the FIFA World Cup 2026 is expected to contribute +0.4% to the United States RevPAR and drive localized spikes in occupancy and turnover. The United States bed and bath linen market absorbs these cyclical effects through steady institutional replenishment and contract-led adoption of antimicrobial and sustainability features when brands update operating standards.
Institutional Demand Growth from Healthcare, Senior Living, and Student Housing Facilities
Senior housing occupancy reached 89.4% in Q4 2025 across NIC MAP primary and secondary markets, the highest since 2015, and NIC expects average occupancy to exceed 90% in 2026 as aging demographics accelerate move-ins. Product design is evolving, with the share of two-bedroom or larger units in new assisted living and memory care developments rising, which increases per-unit linen requirements while encouraging higher-quality towel and bedding specifications. Student housing preleasing for the 2026 to 2027 academic year reached 52.3% in January 2026 versus 45.6% a year earlier, while purpose-built beds registered 96.2% occupancy near record highs, and roughly 30,000 new beds are scheduled for Fall 2026 across 37 campuses. Enrollment at 184 universities tracked by Yardi rose 1.8% to 4.9 million students in Fall 2025, and flagship projects such as the University of South Carolina’s USD 185 million, 1,000-bed residence hall reinforce a multiyear procurement runway for bed and bath textiles. Healthcare linen replacement costs are projected to reach USD 1 billion in 2026 as hospitals adopt durable antimicrobial textiles that withstand frequent laundering, aligning with infection-control protocols that now influence cross-category specifications in the United States bed and bath linen market.
Sustainability Certification-Led Premiumization (GOTS, OEKO-TEX)
In 2024 and 2025, OEKO-TEX issued a substantial number of certificates and labels, and starting in April 2025, tightened its Standard 100 rules. Now, for any claims of organic or GMO-free cotton, a separate OEKO-TEX organic cotton certification is mandatory. According to the annual report from the standard owner, global organic textile standard certifications made further strides in 2024, bolstering buyer trust in certified organic fibers and their transparent processing. In 2024, organic textile sales in the United States, covering products like sheets and towels, reached USD 2.5 billion, marking a 7.4% increase from the previous year. Over the past decade, these sales have seen significant growth, driven by consumers linking certified claims to health and environmental advantages. WestPoint Home debuted the Martex green towel collection, which fuses certified organic cotton with recycled polyester and utilizes OEKO-TEX certified processing. Meanwhile, 1888 Mills teamed up with Cotton Incorporated, introducing a 100% cotton bath and bedding line at competitive price points, catering to budget-conscious shoppers. Such developments widen access to certified products and emphasize the United States' bed and bath linen market's readiness to invest in verified safety and sustainability.
Restraints Impact Analysis*
| Restraint | (~) % Impact on CAGR Forecast | Geographic Relevance | Impact Timeline |
|---|---|---|---|
| Intense price competition and private-label penetration are compressing margins | -1.1% | National, most acute in mass merchandiser and big-box channels | Short term (≤ 2 years) |
| Softening hotel RevPAR/occupancy in the near term | -0.6% | National, more pronounced in select-service and economy tiers | Short term (≤ 2 years) |
| Supply chain disruptions and import tariff exposure are impacting sourcing costs | -0.8% | National, acute for manufacturers sourcing from Asia | Medium term (2-4 years) |
| Slower population growth and immigration headwinds | -0.4% | National, particularly impacting coastal gateway cities | Long term (≥ 4 years) |
| Source: Mordor Intelligence | |||
Intense Price Competition and Private-Label Penetration Compressing Margins
Price competition is heightened in mass and big-box channels as retailers scale proprietary lines and negotiate volume-based pricing that constrains national brand pricing power. Offline distribution remains large and tactile, yet the online share at 28.38% with a projected 5.98% CAGR intensifies transparency as shoppers compare SKUs and reviews in seconds, prompting frequent promotions that weigh on margins. Large retailers are also investing in upstream capabilities and innovation, such as Walmart’s Home Textiles Innovation Lab with the Fashion Institute of Technology, which signals an intent to raise the quality of private labels. Direct-to-consumer brands recalibrated physical footprints to preserve unit economics, with Parachute closing most stores in 2025 and pivoting to a selective blend of e-commerce, wholesale, and flagships, while Brooklinen continues to optimize a smaller set of showrooms. This environment pushes suppliers in the United States bed and bath linen market to double down on differentiated features and sustainability badges that rank well in search and on the marketplace.
Softening Hotel RevPAR/Occupancy in Near Term
Hotels face a modest 2026 RevPAR outlook of +0.6%, with occupancy expected to ease to 62.0% amid macro uncertainty, rising unemployment, and slower ADR growth, limiting revenue momentum. Select-service and economy properties carry the brunt of the softness, which encourages properties to extend linen service life or stage upgrades until fundamentals firm. Group business fell in 2025 before a late-year rebound, and booking windows shortened, which adds volatility that weighs on advance procurement decisions for textiles. Event-driven boosts will help in midyear, with the FIFA World Cup 2026 forecast to add +0.4% to the United States RevPAR and concentrate demand surges in host cities during June and July. The United States bed and bath linen market tracks these cycles as hospitality buyers balance operating cost control with the need to maintain brand standards on cleanliness, durability, and verified safety.
*Our forecasts treat driver/restraint impacts as directional, not additive. The impact forecasts reflect baseline growth, mix effects, and variable interactions.
Segment Analysis
By Product Type: Bed Linen Commands Share, Bath Linen Posts Faster Growth Amid Hospitality Push
Bed linen captured 58.21% of the United States bed and bath linen market share in 2025, supported by the steady replacement of sheets, pillowcases, and duvet covers on 18 to 24-month cycles in many households. Bath linen accounted for 41.79% and is set to grow faster at a 6.65% CAGR through 2031, aided by hotel pipeline additions and extended-stay formats that stock more towels and mats per room. Large-scale producers reinforce category stability, with Welspun reporting that every fifth towel and every seventh sheet sold domestically is manufactured by the company, which supports the rapid rollout of antimicrobial finishes when brand specifications change. Standard Textile emphasizes innovation with more than 150 patents across hospitality products and features such as EZ ID and Center-Lock Labels, which help reduce room makeup times and total housekeeping costs. These elements position bed basics as the volume anchor while lifting the cadence and specification of bath linen orders during peak travel and renovation cycles in the United States bed and bath linen market.
Bath linens’ outperformance is linked to construction and conversion dynamics, as extended-stay hotels represent a large share of the pipeline and require heavier towel inventories per occupied room to meet guest expectations for multi-day stays. Antimicrobial bath products are seeing broader use in hospitality and healthcare, supported by technologies such as 1888 Mills’ work with FUZE on a durable, water-based treatment that remains effective after more than 100 laundry cycles. The United States healthcare facilities are also on a steady replacement path, with linen replacement costs projected to reach USD 1 billion in 2026, which sustains orders for high-durability terry and performance bedding in medical and senior living settings. In the United States bed and bath linen industry, volume remains anchored by sheets and pillowcases while bathmats and shower curtains add incremental revenue during renovation cycles, particularly in urban cores where bathroom upgrades index higher. These trends underpin the medium-term mix shift toward bath textiles without displacing bed basics as the category's core.


By End User: Residential Growth Outpaces Commercial as Hybrid Work Persists
Residential end users accounted for 69.15% of the United States bed and bath linen market, and the residential market is projected to grow at a 6.48% CAGR through 2031. First-time buyers accounted for 31% of existing-home sales in January 2026, creating fresh demand for starter sets in bedrooms and bathrooms, even as total transactions remained muted. As these households prioritize health and aesthetics, certified organic cotton towels and OEKO-TEX labeled sheets earn a pricing premium that buyers accept when transparency and comfort are clear. Residential growth leans on these quality signals, while the commercial base provides predictable contract volumes in the United States bed and bath linen market.
Commercial demand remains steady, with full-bed utilization, and senior housing occupancy reached 89.4% in Q4 2025 and is expected to exceed 90% in 2026 as more baby boomers turn 80 and move into congregate settings. Active adult communities operated near 92% occupancy on average and rose to around 95% at properties open for at least 2 years, and newly built assisted living or memory care properties include larger floor plans that increase per-unit linen needs. Student housing preleasing reached 52.3% for the 2026 to 2027 academic year in January 2026, with purpose-built beds near record occupancy, and around 30,000 new beds scheduled for Fall 2026 delivery. Short-term rentals add frequent turnover, pushing higher wash and replacement cycles, even as supply growth moderates in 2026 in coastal and large-city markets. The FIFA World Cup 2026 is expected to generate a localized midyear lift in occupancy and linen utilization, even if full-year hospitality RevPAR remains generally flat.
By Distribution Channel: Offline Dominates, Online Accelerates via DTC and Platform Partnerships
Offline channels held 71.62% of the United States bed and bath linen market share in 2025, anchored by mass merchandisers, home centers, and specialty stores that offer tactile evaluation of softness, weight, and construction. Online accounted for 28.38% and is projected to grow at a 5.98% CAGR through 2031, benefiting from marketplace scale, algorithmic discovery, and direct-to-consumer models that bypass wholesale markups. The United States e-commerce accounted for 15.9% of total retail sales in 2024, up from 14.7% in 2023, drawing more home-textile shopping into digital carts year over year. The United States bed and bath linen market, therefore, sees faster channel shift online than offline, with subscription pilots and free trial windows reducing friction for replenishment purchases at home. Marketplace rules also elevate certified products in search ranks, where badges for OEKO-TEX STANDARD 100 or MADE IN GREEN help shoppers filter choices.
Channel strategies have evolved to protect profitability as traffic and acquisition costs change, with Parachute closing most stores in 2025 to focus on a hybrid of selective flagships, e-commerce, and wholesale partnerships with national retailers. Brooklinen operates a small set of showrooms while prioritizing residential e-commerce and curated programs for hospitality, and Boll & Branch scales both store locations and high-margin direct channels. On the supply side, Welspun serves 9 of the top 10 United States retailers, ensuring shelf presence across mass and digital channels for towels and bedding, while 1888 Mills and WestPoint Home drive innovation in antibacterial and sustainable lines that meet marketplace certification filters. Home centers also capture renovation-driven basket building when shoppers pair fixtures with coordinated towels and mats, while specialty stores court premium buyers with curated assortments and service. These shifts reward omnichannel balance and investment in certification within the United States bed and bath linen industry.
By Material: Cotton Holds Share via Versatility, Linen Grows Fastest on Premiumization Wave
Cotton captured 71.74% share in 2025, while the United States bed and bath linen market size for linen materials is forecast to expand at a 6.08% CAGR through 2031, outpacing cotton’s 4.12% CAGR. Cotton’s combination of breathability, absorbency, and familiarity sustains dominant share across sheets and terry, while durable polyester blends retain appeal in hospitality for quick-dry performance and lower energy use in laundry cycles. Linen’s natural texture and moisture-wicking capability earn 30% to 50% price premiums in many premium collections, as buyers weigh longevity and a natural look when refreshing bedrooms and bathrooms. Certification momentum aligns with these choices, as consumers favor GOTS and OEKO-TEX labeled options, while organic fiber sales in the United States grew in 2024 and are gaining share in bed and bath categories. The United States bed and bath linen market is therefore splitting across good-better-best tiers with cotton as the anchor, blends as value workhorses, and linen as a premium choice.
Value-positioned cotton gained added support when 1888 Mills partnered with Cotton Incorporated on a 100% cotton bath and bedding range at opening price points, leveraging the Seal of Cotton that 79% of consumers associate with trust. Premium brands such as Boll & Branch use GOTS-certified organic cotton as a core material and offer linen collections to meet seasonal and aesthetic preferences for higher-end buyers. Large suppliers with vertical integration hedge cost volatility and speed innovation across treatments like antimicrobial coatings or moisture-wicking finishes when retailers update specifications. Polyester and cotton-poly blends remain essential for high-turnover hospitality items, where durability and energy savings in laundry take precedence over hand feel. These material dynamics should hold as certification demand and tiered positioning advance within the United States bed and bath linen industry.
Geography Analysis
Regional patterns split between volume leadership in the South and growth leadership in the West, with steady institutional and renovation cues in the Northeast and Midwest. The South commanded a 27.54% share in 2025 and added significant hotel capacity in 2026 across Dallas, Orlando, Miami, and other destinations, which supported bath linen stocking in properties aligned to extended-stay formats. Dallas recorded the nation’s largest hotel project pipeline in late 2025, with Atlanta and Phoenix next, mapping to near-term bed and bath ordering around openings and conversions. The share of first-time buyers improved in January 2026, supporting residential replenishment as households furnish bedrooms and bathrooms. Texas’s breadth of nursing and assisted living facilities also ensures predictable replacement cycles, even as new facility construction slows. University expansions, such as recent bed additions at Tennessee, sustain dormitory demand that aligns with the late summer and early fall intake cycle in the United States bed and bath linen market.
The West holds approximately a 22% share and is forecast to grow at a 5.82% CAGR through 2031, propelled by domestic migration, affluent coastal spending, and robust short-term rental ecosystems in Mountain and Lake markets. Phoenix added a large tranche of new rooms in 2026, while Las Vegas is on track for strong RevPAR and occupancy, driven by big events and moderated supply, which translates to linen ordering across bath terry, bedding, and back-up inventory. Coastal markets are set to increase short-term rental supply in 2026, and operators stock multiple sets per unit to meet tight guest turns and protect ratings, which adds recurring linen cycles. Many West Coast metros exhibit high e-commerce adoption, which supports direct-to-consumer brands that sell premium organic cotton and linen collections to households prioritizing comfort and verified safety. This mix of hospitality openings, online propensity, and household formation keeps the United States bed and bath linen market on a higher-growth trajectory in the region.
The Northeast and Midwest deliver balanced demand through urban renovation cycles, dense senior living, and steady university pipelines. New York City added the nation’s largest number of new rooms in 2026, underscoring hospitality's staffing needs, even as RevPAR normalization remains a work in progress. Bathroom remodel incidence is higher in urban households than in non-urban ones, which favors premium towel and mat purchases when owners coordinate with fixtures and tile updates. Senior housing occupancy in Northeast markets such as Boston topped the national average in late 2025, underscoring the value of higher-quality bedding as a competitive amenity. The Midwest is growing steadily, supported by suburban renovations and active university projects, such as new residence hall plans at Kansas and Virginia Tech, that set a procurement runway into late 2026 and beyond. Together, these patterns smooth the demand profile for essentials and selective upgraded collections in the United States bed and bath linen market.
Competitive Landscape
The United States bed and bath linen market is moderately fragmented, with the top five players accounting for less than half of revenue and a long tail of regional specialists, private-label programs, and direct-to-consumer brands. Welspun supplies 9 of the top 10 United States. retailers and reports manufacturing every fifth towel and every seventh sheet sold domestically, which delivers scale for fast adoption of antimicrobial and sustainability treatments. The firm invested USD 50 million in an Ohio greenfield pillow plant commissioned in September 2024 and added a USD 12.5 million Grove City manufacturing facility that creates 70 jobs and expands production of pillows, mattress pads, and comforters. Standard Textile differentiates on innovation, holds more than 150 patents, and serves more than 1 million guest rooms with hospitality-tough fabrics and systems that reduce room makeup time and total laundry cost. These capabilities help incumbent leaders defend share as value-focused imports, private labels, and online-first brands expand choice for United States buyers.
Challenger brands and specialty manufacturers are reshaping distribution and product strategy. Parachute pivoted in 2025 to emphasize e-commerce, wholesale, and selective flagships after closing most stores, and also launched a national collaboration with Target to reach mass-market price points under USD 200. Brooklinen has optimized its showroom footprint while keeping residential e-commerce at the core, and Boll & Branch blends 15 stores with direct channels to reach premium buyers who prefer organic cotton and linen collections. WestPoint Home expanded its certified assortment with the Martex Green Towel Collection, which blends certified organic cotton with recycled polyester and uses OEKO-TEX-verified processing, while 1888 Mills partnered with Cotton Incorporated to deliver opening-price-point cotton at scale. As marketplace filters elevate verified labels, suppliers that invest in OEKO-TEX and GOTS audits gain an advantage in platform discovery and institutional RFPs.
Emerging opportunities center on antimicrobial performance, subscription-style institutional procurement, and compliance with brand standards. 1888 Mills promotes FUZE F1, a water-based antimicrobial treatment tested for durability across extended wash cycles, which aligns with hospital protocols and hospitality cleanliness standards. Amazon’s Climate Pledge Friendly framework recognizes OEKO-TEX STANDARD 100 and MADE IN GREEN, lifting visibility for verified products in marketplace search and category discovery. In hospitality, brand conversions reached record levels in 2025 and require linen refreshes to meet updated specifications, favoring partners that can deliver at scale with consistent quality. Nearshoring is another lever for responsiveness and risk management, as seen in Welspun’s Ohio investments, which reduce tariff exposure and accelerate just-in-time availability for openings. These moves reinforce a competitive rhythm that balances price with verifiable quality, speed, and reliability in the United States bed and bath linen market.
United States Bed And Bath Linen Industry Leaders
Welspun USA (Welspun Living)
WestPoint Home (Martex)
Standard Textile
Trident Group
1888 Mills
- *Disclaimer: Major Players sorted in no particular order

Recent Industry Developments
- October 2025: 1888 Mills partnered with Cotton Incorporated to unveil a 100% cotton bath and bedding collection at opening price points, targeting value-conscious consumers with a natural-fiber alternative that competes on cost with synthetics. The line bears the Seal of Cotton trademark, which 79% of consumers associate with trustworthiness, and addresses microplastic concerns by offering a biodegradable option.
- April 2025: Parachute Home launched an exclusive home textiles collaboration with Target, featuring products under USD 200, a wholesale partnership enabling the direct-to-consumer brand to access mass-market distribution without maintaining extensive physical retail infrastructure.
- August 2024: Welspun expanded its United States operations with a USD 12.5 million manufacturing facility in Grove City, Ohio, and retrofitted an existing distribution center to add production capabilities for towels, rugs, and bedding. The facility creates 70 new jobs and produces sleep pillows, pillow covers, mattress pads, comforters, and blankets for retail, omni, institutional, hospitality, and e-commerce channels, leveraging onshore manufacturing to reduce lead times and tariff exposure.
- May 2024: Welspun Living commissioned a USD 50 million Ohio greenfield pillow plant, targeting the United States pillow market with an initial capacity of 6.7 million units. The investment aims to penetrate the pillow category through nearshoring opportunities, bringing production closer to a significant North American customer base and enabling faster response to retail partner demands.


United States Bed And Bath Linen Market Report Scope
The United States bed and bath linens market is defined as the industry involved in the production, distribution, and sale of textiles specifically designed for use in bedrooms and bathrooms. This market includes products such as bed sheets, pillowcases, duvet cases, blankets, bath towels, hand towels, washcloths, and bath mats.
The United States bed and bath linens market is segmented by type, distribution channel, and end user. By type, the market is segmented into bed linen (sheets, pillowcases, duvet cases, and other bed linen) and bath linen (towels, bath robes, and other bath linen). By end user, the market is segmented into residential and commercial. By distribution channel, the market is segmented into supermarkets and hypermarkets, specialty stores, e-commerce, and other distribution channels. The report offers market sizes and forecasts in terms of value (USD) for all the above segments.
By Product Type
| Bed Linen | Sheets |
| Pillows | |
| Pillow Covers | |
| Duvet Cases | |
| Blankets | |
| Comforters | |
| Mattress Protectors | |
| Bath Linen | Towels |
| Bathrobes | |
| Bathmats | |
| Shower Curtains |
By End User
| Residential |
| Commercial |
By Distribution Channel
| Offline | Mass Merchandisers (Hypermarkets/Supermarkets) |
| Home Centers | |
| Specialty Stores | |
| Other Distribution Channels | |
| Online |
By Material
| Cotton |
| Linen |
| Others |
By Geography
| Northeast |
| Midwest |
| South |
| West |
| By Product Type | Bed Linen | Sheets |
| Pillows | ||
| Pillow Covers | ||
| Duvet Cases | ||
| Blankets | ||
| Comforters | ||
| Mattress Protectors | ||
| Bath Linen | Towels | |
| Bathrobes | ||
| Bathmats | ||
| Shower Curtains | ||
| By End User | Residential | |
| Commercial | ||
| By Distribution Channel | Offline | Mass Merchandisers (Hypermarkets/Supermarkets) |
| Home Centers | ||
| Specialty Stores | ||
| Other Distribution Channels | ||
| Online | ||
| By Material | Cotton | |
| Linen | ||
| Others | ||
| By Geography | Northeast | |
| Midwest | ||
| South | ||
| West | ||


Key Questions Answered in the Report
What is the size and growth outlook for the United States bed and bath linen market to 2031?
The United States bed and bath linen market size is USD 23.36 billion in 2026 and is projected to reach USD 29.47 billion by 2031 at a 4.76% CAGR.
Which product categories are leading and which are growing fastest in the United States bed and bath linen space?
Bed linen leads with 58.21% share in 2025, while bath linen is projected to grow faster at a 6.65% CAGR through 2031 due to extended-stay hotel openings and higher turnover in hospitality.
How is channel shift influencing purchases in the United States bed and bath linen market?
Offline holds a 71.62% share, but online at 28.38% with a 5.98% projected CAGR, is gaining ground on convenience, marketplace discovery, and direct-to-consumer models, supported by rising e-commerce penetration.
Which regions contribute most to demand in the United States bed and bath linen market?
The South leads with a 27.54% share in 2025 in population and institutional density, while the West is projected to grow fastest at a 5.82% CAGR driven by migration, affluent coastal spending, and active short-term rentals.
What factors could restrain near-term growth for the United States bed and bath linen market?
The largest headwinds are price competition from private labels and soft 2026 hotel RevPAR and occupancy, which can delay hospitality linen upgrades until demand stabilizes.
How do sustainability certifications affect purchasing in the United States bed and bath linen market?
Buyers and marketplaces increasingly use OEKO-TEX and GOTS certifications to validate safety and fiber claims, and the United States organic textile sales reached USD 2.5 billion in 2024, signaling willingness to pay for verified attributes.
Page last updated on:


