United States Bean Bags Market Size and Share
Market Overview
| Study Period | 2020 - 2031 |
|---|---|
| Forecast Data Period | 2026 - 2031 |
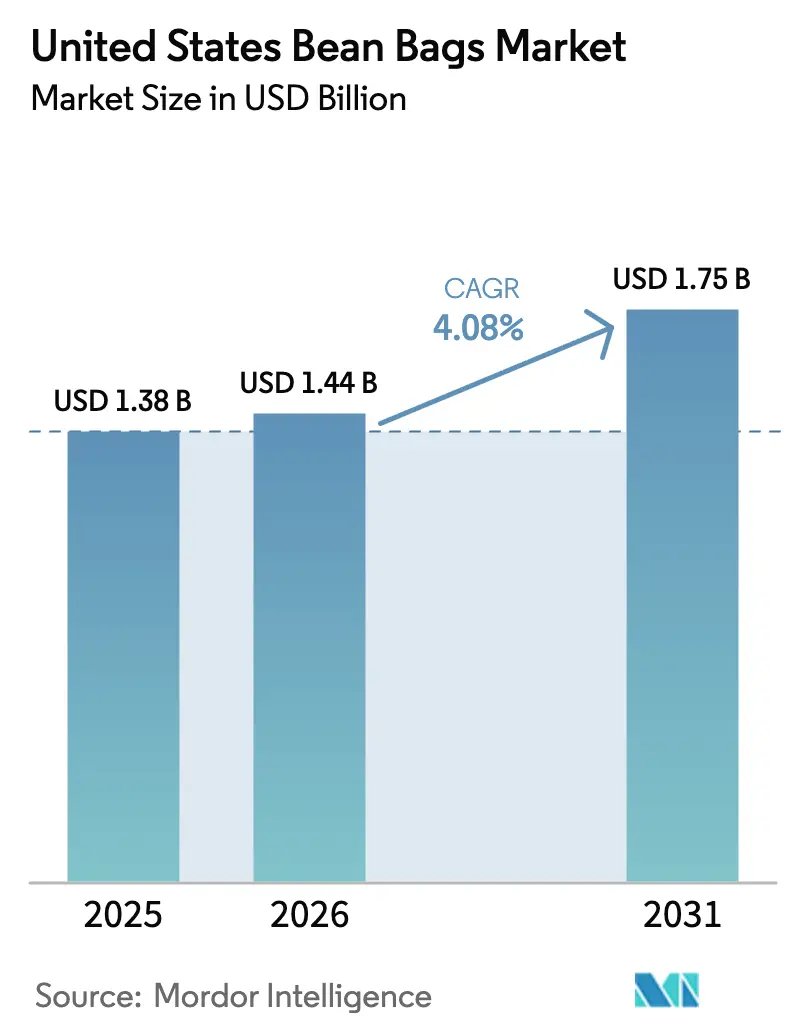
| Base Year Market Size (2025) | USD 1.38 Billion |
| Market Size (2026) | USD 1.44 Billion |
| Market Size (2031) | USD 1.75 Billion |
| Growth Rate (2026 - 2031) | 4.08% CAGR |
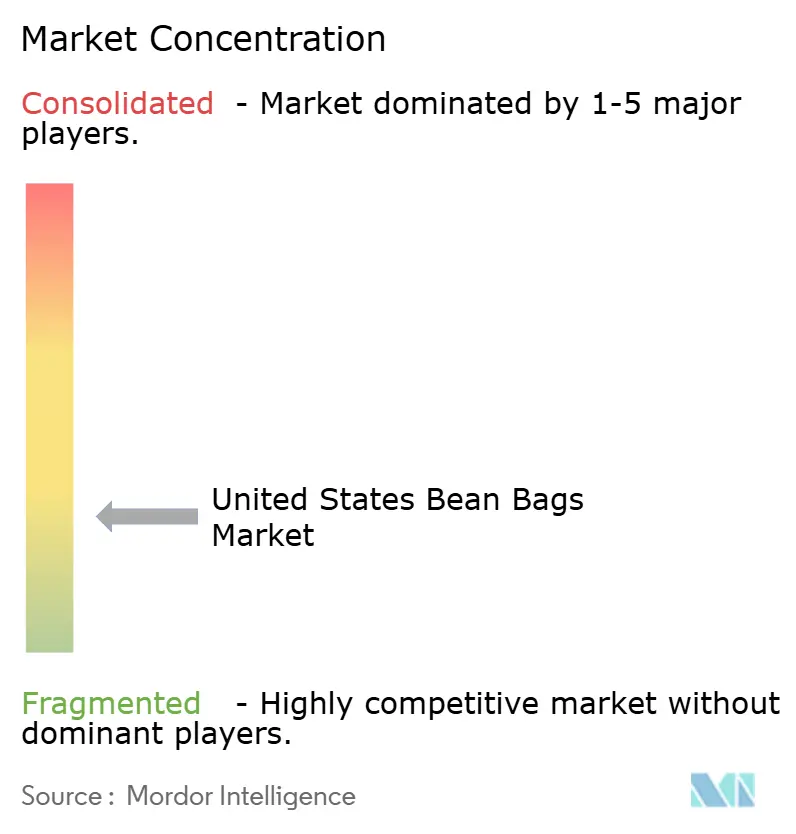
| Market Concentration | Low |
Major Players *Disclaimer: Major Players sorted in no particular order Image © Mordor Intelligence. Reuse requires attribution under CC BY 4.0. | |
United States Bean Bags Market Analysis by Mordor Intelligence
The United States bean bags market size is expected to grow from USD 1.38 billion in 2025 to USD 1.44 billion in 2026 and is forecast to reach USD 1.75 billion by 2031 at 4.08% CAGR over 2026-2031. Rising hybrid-work lifestyles, strong renovation activity, and a clear preference for casual, re-configurable seating continue to insulate demand from the broader slowdown hitting conventional furniture categories. Premium lines gain traction as consumers justify higher outlays for products that blend ergonomic support, modularity, and sustainability. Supply chains have stabilized after the pandemic, yet cost pressures linked to flame-retardant compliance and freight remain key pricing variables. Competitive intensity is sharpening around technology-enabled customization and recycled inputs, while regulatory leadership from California effectively sets the national baseline for flammability and chemical safety.
Key Report Takeaways
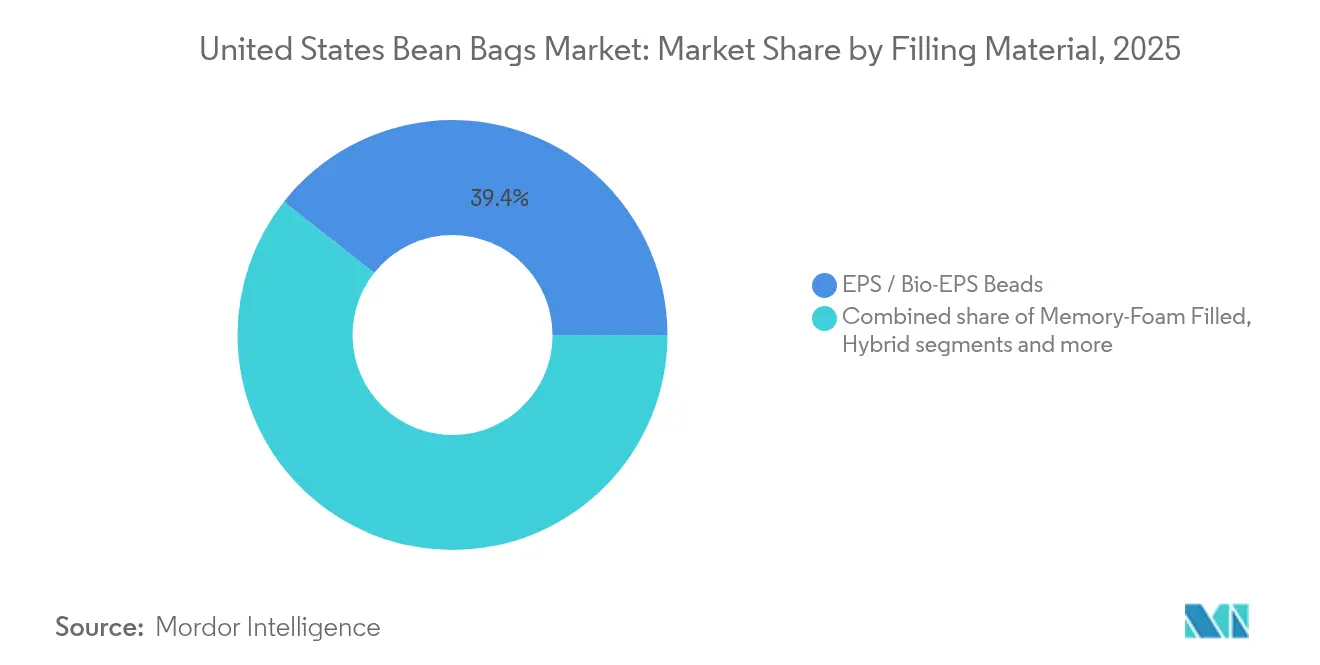
- By filling material, EPS/Bio-EPS beads commanded 39.35% share of the United States bean bags market size in 2025; natural and recycled fills are forecast to expand at 5.85% CAGR to 2031.
- By outer material, leather led with 54.35% revenue share in 2025; cotton is expected to register the highest 5.22% CAGR through 2031.
- By application, indoor products accounted for 69.20% of the United States bean bags market size in 2025; outdoor applications are projected to grow at 5.55% CAGR over 2026-2031.
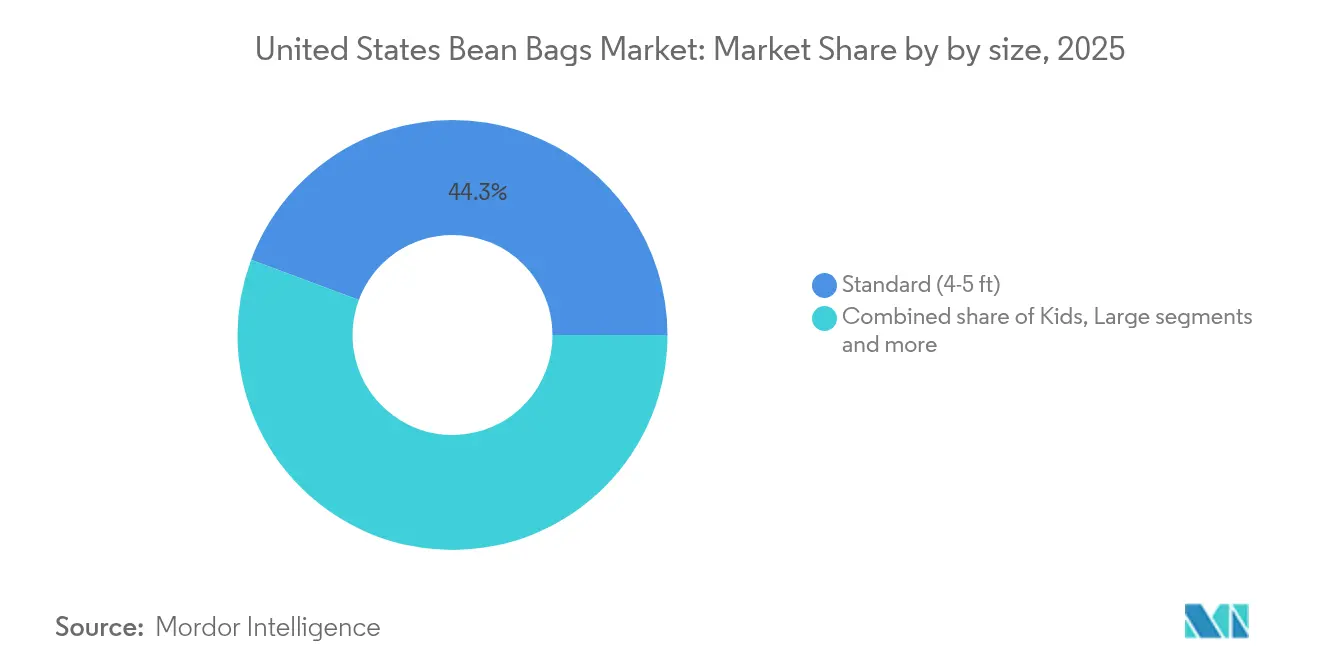
- By product size, standard 4–5 ft models held 44.30% share in 2025, whereas jumbo (≥ 8 ft) units are set to expand at 4.95% CAGR.
- By price band, the mid-range segment made up 49.10% of 2025 revenue; premium lines are poised for a 4.72% CAGR to 2031.
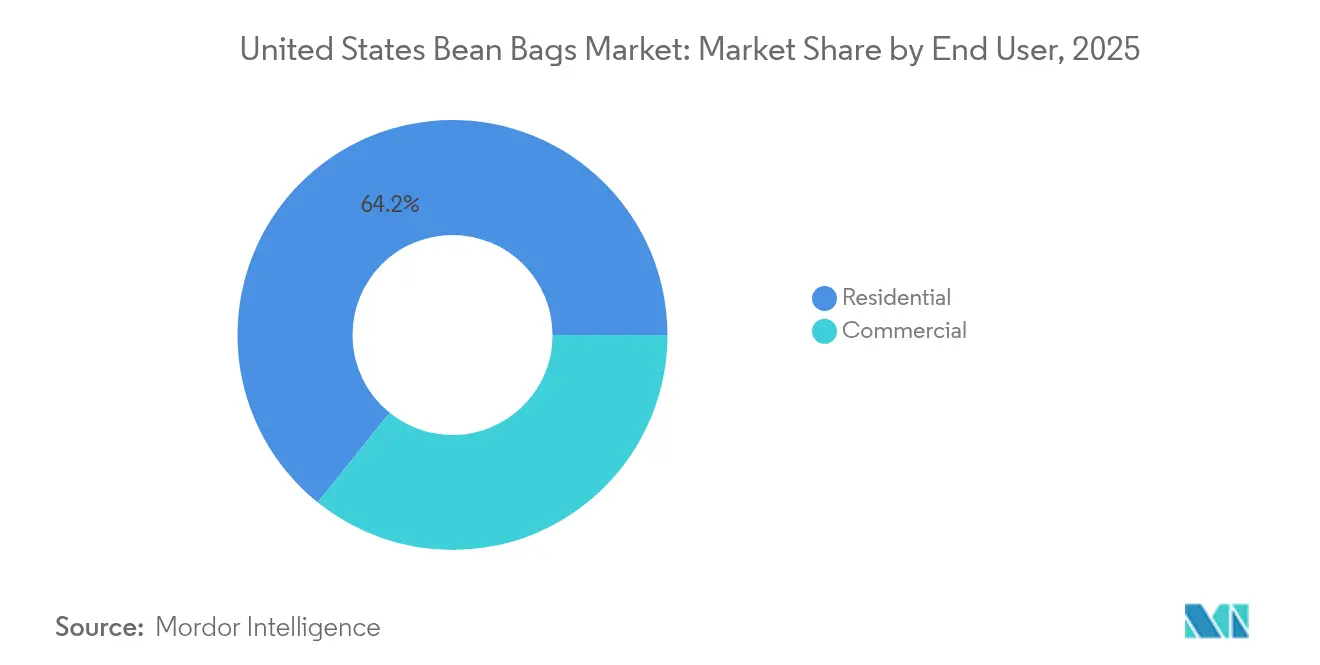
- By end-user, residential buyers formed 64.20% of the 2025 demand, while commercial uptake is forecast to accelerate at a 5.05% CAGR.
- By distribution, B2C channels represented 77.10% of total sales in 2025; B2B project sales are projected to rise at a 5.72% CAGR.
- By geography, the West captured 24.60% of the United States bean bags market share in 2025; the Northeast is on track to post the fastest 4.55% CAGR through 2031.
Note: Market size and forecast figures in this report are generated using Mordor Intelligence’s proprietary estimation framework, updated with the latest available data and insights as of 2026.
United States Bean Bags Market Trends and Insights
Drivers Impact Analysis*
| Driver | (~) % Impact on CAGR Forecast | Geographic Relevance | Impact Timeline |
|---|---|---|---|
| Ergonomic Home-Office Adoption Fueling Premium Bean Bag Demand | +1.2% | West Coast, Northeast urban centers | Medium term (2-4 years) |
| Surge in Demand for Comfortable and Customizable Furniture | +0.9% | National, high-income metros | Long term (≥ 4 years) |
| Eco-Friendly Fill Materials (Bio-EPS & Recycled Foam) Driving Product Switch | +0.8% | California, Pacific Northwest, Northeast | Long term (≥ 4 years) |
| Rapid Expansion of Boutique Hospitality & Glamping Sites Using Casual Seating | +0.6% | West Coast, Southeast tourism corridors | Medium term (2-4 years) |
| Rise of “Soft Seating” Décor Trends Boosting Impulse Purchases | +0.4% | National, millennial-dense markets | Short term (≤ 2 years) |
| Source: Mordor Intelligence | |||
Ergonomic Home-Office Adoption Fueling Premium Bean Bag Demand
The pivot to hybrid work has pushed ergonomic concerns from the corporate office into living rooms. Hybrid work has become the new norm in U.S. white-collar employment. An online survey of full- and part-time workers shows that the share of employees splitting their time between home and the office jumped from 8% in 2019 to 54% by Q1 2024 and has held above 53% since early 2023 [1]Gallup Staff, “Indicator: Hybrid Work,” Gallup, gallup.com. Employers view the model as a practical way to support well-being, sustain productivity, and curb office overhead, signalling that flexible arrangements will remain a structural feature of the labor market. Brands now embed segmented lumbar panels, gel-infused memory foam, and adjustable headrests that let remote workers alternate between task-oriented posture and leisure modes. West-coast tech hubs provide early-adopter momentum, and premium models gain the most as buyers see them as dual-use furniture.
Surge in Demand for Comfortable and Customizable Furniture
Personalization is no longer a novelty. Interchangeable covers, modular footstools, and online fabric configurators allow shoppers to match evolving décor without replacing the core seat. Direct-to-consumer brands report that customized variants command high price premiums and lower return rates because buyers feel ownership over the design. Embedded 3D room-planning tools further accelerate online conversion.
Eco-Friendly Fill Materials (Bio-EPS & Recycled Foam) Driving Product Switch
Environmental stewardship is now a core purchase driver. Bio-EPS derived from corn or sugarcane and blends of recycled foam chips provide near-identical comfort while shrinking carbon footprints. Research institutes such as Fraunhofer WKI have pioneered formaldehyde-free binders and bio-based flame retardants, making large-scale substitution viable[2]Fraunhofer WKI, “Bio-Based Flame Retardants for Upholstery,” wki.fraunhofer.de. California’s de facto national fire standard implicitly favors these low-emission alternatives and helps justify marginal cost premiums at retail.
Rapid Expansion of Boutique Hospitality & Glamping Sites Using Casual Seating
Experience-driven travel has created fresh B2B demand. Boutique hotels specify oversized bean bags for rooftop lounges, while glamping operators use weather-proof sacks to furnish open decks. The ability to move seats quickly for events, plus the social-media appeal of relaxed visuals, underpins project orders in the Southeast’s tourism corridors. Commercial buyers also appreciate that foam-based seating meets many accessibility guidelines once height and firmness are tuned.
Restraints Impact Analysis*
| Restraint | (~) % Impact on CAGR Forecast | Geographic Relevance | Impact Timeline |
|---|---|---|---|
| Fire-Safety Regulation Variability Across States Raising Compliance Costs | -0.7% | National, highest impact in California, Massachusetts, and New York | Long term (≥ 4 years) |
| Perceived Lack of Postural Support Limiting Adoption in Senior Living | -0.5% | National, concentrated in Florida, Arizona, and aging population centers | Medium term (2-4 years) |
| Supply-Chain Carbon Footprint Scrutiny Hindering Imports of PU-Coated Fabrics | -0.4% | West Coast ports, Northeast import hubs, California regulatory zones | Medium term (2-4 years) |
| Source: Mordor Intelligence | |||
Fire-Safety Regulation Variability Across States Raising Compliance Costs
California’s Technical Bulletin 117-2013 and the CPSC’s 16 CFR Part 1640 set stringent smolder-resistance benchmarks. Yet states such as Massachusetts layer additional chemical-labeling rules, creating a fragmented compliance map. Manufacturers therefore design to the toughest rule set and absorb higher testing, documentation, and flame-retardant material costs[3]Consumer Product Safety Commission, “16 CFR Part 1640 Upholstered Furniture Flammability,” cpsc.gov . Smaller firms with limited capital struggle to amortize certification fees, nudging consolidation.
Perceived Lack of Postural Support Limiting Adoption in Senior Living
Occupational therapists frequently advise older adults to avoid low-slung seating that requires core strength to exit. Consequently, senior-living operators specify rigid-frame chairs over bean bags despite the latter’s pressure-relief advantages. Until brands introduce elevated bases or assistive grips that satisfy mobility criteria, the category’s reach into the 65+ demographic will stay muted even as this cohort expands rapidly.
*Our forecasts treat driver/restraint impacts as directional, not additive. The impact forecasts reflect baseline growth, mix effects, and variable interactions.
Segment Analysis
By Filling Material: Sustainability Steers Innovation
EPS and emerging Bio-EPS beads held 39.35% of the United States bean bags market share in 2025 because they combine low cost with moldability. Natural and recycled alternatives, though only a minor slice today, are set to outpace the core at 5.85% CAGR, reflecting the regulatory nudge toward reduced volatile organic compounds. Premium labels highlight coconut fiber or cork blends to reinforce eco narratives and justify higher tickets. Supply chains for petro-based beads remain deeper, but investments in agricultural waste streams improve scale for bio-fills, promising margin parity by the forecast horizon.
The United States bean bags market increasingly differentiates product tiers by fill chemistry rather than outer fabric alone. Memory-foam variants fetch the top pricing by delivering orthopedic benefits, yet foam recycling technologies are still maturing. Hybrid bead-foam mixes emerge as middle-ground solutions that temper cost while lifting comfort scores. Niche fills like buckwheat hulls now find traction in wellness-oriented boutiques, signaling an expanding palette of natural inputs.


By Outer Material: Leather Longevity Under Environmental Scrutiny
Leather retained a commanding 54.35% share in 2025 thanks to its abrasion resistance and perceived prestige. However, cotton covers are scaling fastest at 5.22% CAGR as consumers pivot to breathable, machine-washable fabrics that align with casual interiors. Velvet and specialty synthetics occupy aesthetic niches, catering to statement pieces in entertainment zones or hospitality lobbies.
Brands marketing leather pieces now spotlight traceable hides and vegetable-tanned processes to deflect environmental critique. Conversely, cotton producers tout GOTS certification and recycled-poly blends that bolster circularity claims. The durability versus sustainability debate will shape margin structures; leather holds longevity advantages, while cotton wins on care convenience and seasonal refresh appeal within the United States bean bags market.
By Application: Outdoor Momentum Builds
Indoor use dominated 69.20% of the United States bean bags market size in 2025, rooted in year-round relevance and integration with family rooms and gaming setups. Outdoor-specific models, fortified with UV-stable yarns and mildew-proof inserts, are projected to rise at 5.55% CAGR as homeowners extend living spaces to patios and rooftops. Post-pandemic home renovation cycles allocated bigger budgets to alfresco lounges, directly lifting demand for weather-proof sacks.
While indoor models prioritize tactile comfort and styling breadth, outdoor lines concentrate on fade resistance and quick-dry foam. Retail assortments therefore differ by season; big-box chains front-load patio collections in spring, whereas specialty e-commerce stores carry evergreen SKUs to capture sun-belt demand. The dual-season strategy lets suppliers smooth production schedules and hedge against weather volatility.
By Size: Bigger Pieces Make a Statement
Standard 4–5 ft units represented 44.30% of 2025 revenue because they strike a balance between seating comfort and spatial flexibility in apartments. Jumbo sacks of 8 ft or more are logging the quickest 4.95% CAGR, mirroring the popularity of open-plan basements and media rooms where a single piece can seat multiple viewers. Children-specific ≤ 3 ft models retain a safety-oriented niche that drives steady volume but lower average selling prices.
Shipping economics weigh heavily on size segmentation. Oversized units incur dimensional weight surcharges, pushing vendors toward compressed-foam packaging or on-site fill kits. Nevertheless, social-media-friendly jumbo pieces generate disproportionate engagement, making them effective attention grabbers in omnichannel campaigns across the United States bean bags market.
By Price Range: Premiumization Gains Momentum
Mid-range SKUs captured 49.10% of 2025 revenue as cost-conscious homeowners balanced durability with budget. The premium tier is slated for a 4.72% CAGR, powered by recycled materials, proprietary foam blends, and digital configurators that resonate with sustainability-minded shoppers. Economy lines face erosion from raw-material inflation and rebate-driven price wars at mass merchants.
Warranty terms provide a key separator: lifetime or 10-year guarantees prevalent in premium offers reinforce value perception and underpin higher margins. Retailers, in turn, use tiered financing plans to bridge the affordability gap, broadening the reachable audience for premium upgrades within the United States bean bags market.
By End-user: Commercial Channels Accelerate
Residential purchases still accounted for 64.20% of sales in 2025, yet commercial uptake now advances at 5.05% CAGR. Offices adopting casual break-out zones, boutique hotels chasing Instagram-friendly décor, and tertiary-education campuses refreshing student lounges all drive volume. Commercial buyers stipulate tougher fire codes and seam-strength tests, prompting vendors to develop distinct SKUs and documentation packs.
Conversion success hinges on consultative selling that bundles layout planning and replacement-cycle analytics. Vendors who certify products under ANSI/BIFMA standards gain an edge with facility managers who prioritize durability and maintenance budgets.
By Distribution Channel: Digital Convenience Meets B2B Projects
B2C outlets, including omnichannel retailers and pure-play e-commerce platforms, retained 77.10% share in 2025 thanks to broad assortments and free-shipping thresholds. B2B project work, though smaller, is rising at 5.72% CAGR as hospitality, office, and education remodels specify casual seating. Interactive 3D configurators powered by 3D Cloud now underpin many digital showrooms, allowing size, color, and fabric swaps in real time—features that shorten decision cycles and lower return rates.
Manufacturers balance channel conflict by offering exclusive fabrics or expedited lead times to trade customers, while keeping mass-market collections distinct. Drop-ship logistics remain standard for online consumer deliveries, whereas project clients favor consolidated freight shipments with on-site assembly options.
Geography Analysis
The West region accounted for 24.60% of the United States bean bags market revenue in 2025, supported by high-income households, tech-centric employment, and legislation that often becomes the default national benchmark. California’s flammability rules oblige suppliers to prioritize low-emission, smolder-resistant materials, giving early advantage to firms already invested in sustainable chemistry. The region’s outdoor lifestyle also lifts demand for UV-proof fabrics suited to pool decks and coastal retreats.
The Northeast is forecast to be the fastest-growing region, advancing at a 4.55% CAGR through 2031. Dense urban living and smaller residential footprints magnify the appeal of flexible seating that can tuck away or double as guest beds. The concentration of colleges drives commercial orders for dormitories and student centers, while premium incomes in metropolitan corridors support higher price ladders across the United States bean bags market.
The Southeast, Midwest, and Southwest together present a diversified demand base. Tourism-heavy Southeast states embed bean bags into resort patios and vacation rentals to enhance a casual ambiance for picture-driven marketing. Midwestern family rooms emphasize stain-resistant covers and kid-safe zipper locks. The arid Southwest prizes fade-proof fabrics that withstand intense solar exposure year-round. Regional distributors fine-tune assortments accordingly, aligning fabric palettes with local color trends and climate considerations.
Competitive Landscape
The United States bean bag market remains fragmented, though scale leaders such as Lovesac maintain share through direct-to-consumer distribution, showroom expansion, and circular-economy messaging. Lovesac’s pledge to repurpose 1 billion plastic bottles by 2040, alongside its modular configuration patents, exemplifies brand-led differentiation. Mid-tier rivals diversify via limited-edition fabric drops and retailer exclusives, while smaller artisans carve out niches with heritage textiles or region-specific designs.
Digital investment represents a critical battleground. Leading firms deploy augmented-reality apps that let shoppers visualize products in real space, cutting return rates and boosting the upsell of accessories like ottomans and headrests. Compliance capabilities also shape competitive dynamics. Larger entities spread third-party lab fees across higher volumes, whereas micro-brands either outsource certification or restrict sales to states with lenient fire codes, inadvertently ceding nationwide e-commerce ground.
Supply-chain strategies are bifurcating. Some brands near-shore filling and sewing to mitigate tariff exposure and shorten lead times, while others deepen partnerships in Vietnam and Mexico to lower labor costs. Private-label programs at big-box chains intensify price pressure on entry-level SKUs, but also open volume channels for OEM manufacturers comfortable working behind the scenes.
United States Bean Bags Industry Leaders
Lovesac Company
Big Joe (Comfort Research)
Yogibo LLC
Fatboy USA
Sumo Lounge International
- *Disclaimer: Major Players sorted in no particular order

Recent Industry Developments
- April 2025: Lovesac reported Q4 2025 revenue of USD 241.5 million, expanded its showroom network to 257 locations, and improved gross margin to 60.4% through freight optimization.
- December 2024: South Bay International unveiled the Enfinity Lounge and HealthyAir Monitor at Las Vegas Market, focusing on comfort and wellness.
- November 2024: Furniture Marketing Group chose Intiaro to furnish 3D and AR visualization tools for 100+ retailers, targeting a sales uplift of up to 30%.
- September 2024: Best Home Furnishings integrated 3D Cloud visualization across 300 SKUs to enhance its e-commerce experience.


United States Bean Bags Market Report Scope
Bean bags are typically sealed bags filled with a variety of materials, including dried beans, PVC pellets, expanded polystyrene, or expanded polypropylene.
The US bean bag market is segmented by product type, application, size, and distribution channel. By product type, the market is segmented into indoor and outdoor. By application, the market is segmented into residential and commercial. By size, the market is segmented into small, medium, and large. By distribution channel, the market is segmented offline and online. The report offers market sizing and forecasts in value (USD) for all the above segments.
| EPS / Bio-EPS Beads |
| Memory-Foam Filled |
| Hybrid (Foam + Bead) |
| Natural & Recycled Fill (Buckwheat, Cork, Textile Shred) |
| Others |
| Cotton |
| Leather |
| Velvet |
| Other Materials |
| Indoor |
| Outdoor |
| Kids (≤3 ft) |
| Standard (4-5 ft) |
| Large (6-7 ft) |
| Jumbo (≥8 ft) |
| Economy |
| Mid-Range |
| Premium |
| Residential |
| Commercial |
| B2C/Retail | Home Centers |
| Specialty Furniture Stores | |
| Online | |
| Other Distribution Channels | |
| B2B /Project |
| Northeast |
| Southeast |
| Midwest |
| Southwest |
| West |
| By Filling Material | EPS / Bio-EPS Beads | |
| Memory-Foam Filled | ||
| Hybrid (Foam + Bead) | ||
| Natural & Recycled Fill (Buckwheat, Cork, Textile Shred) | ||
| Others | ||
| By Outer Material | Cotton | |
| Leather | ||
| Velvet | ||
| Other Materials | ||
| By Application | Indoor | |
| Outdoor | ||
| By Size | Kids (≤3 ft) | |
| Standard (4-5 ft) | ||
| Large (6-7 ft) | ||
| Jumbo (≥8 ft) | ||
| By Price Range | Economy | |
| Mid-Range | ||
| Premium | ||
| By End-user | Residential | |
| Commercial | ||
| By Distribution Channel | B2C/Retail | Home Centers |
| Specialty Furniture Stores | ||
| Online | ||
| Other Distribution Channels | ||
| B2B /Project | ||
| By Geography | Northeast | |
| Southeast | ||
| Midwest | ||
| Southwest | ||
| West | ||


Key Questions Answered in the Report
What is the current size of the United States bean bags market?
The market reached USD 1.44 billion in 2026 and continues to expand as casual seating gains popularity.
What growth rate is expected for the United States bean bags market through 2031?
Industry revenues are forecast to rise at a 4.08% CAGR, pushing the market to roughly USD 1.75 billion by 2031 over 2026-2031.
Which U.S. region holds the largest share of bean bag sales, and which is expanding the fastest?
The West commands about 24.60% of 2025 sales, while the Northeast is projected to record the quickest 4.55% CAGR through 2031.
Which filling materials lead the market, and what is the fastest-growing alternative?
EPS/Bio-EPS beads dominate with a 39.35% share, whereas natural and recycled fills are growing fastest at a 5.85% CAGR thanks to rising eco-consciousness.
How is the shift to hybrid work influencing bean bag demand?
Remote workers are investing in premium, ergonomically enhanced bean bags that serve dual roles for both professional tasks and leisure, lifting the higher-priced segment.
What role does sustainability play in new bean bag product development?
Brands are adopting bio-based EPS, recycled foams, and organic fabrics to meet consumer demand for low-emission, recyclable seating without sacrificing comfort or durability.
Page last updated on:


