United States Amusement And Theme Park Industry Size and Share
Market Overview
| Study Period | 2021 - 2031 |
|---|---|
| Forecast Data Period | 2026 - 2031 |
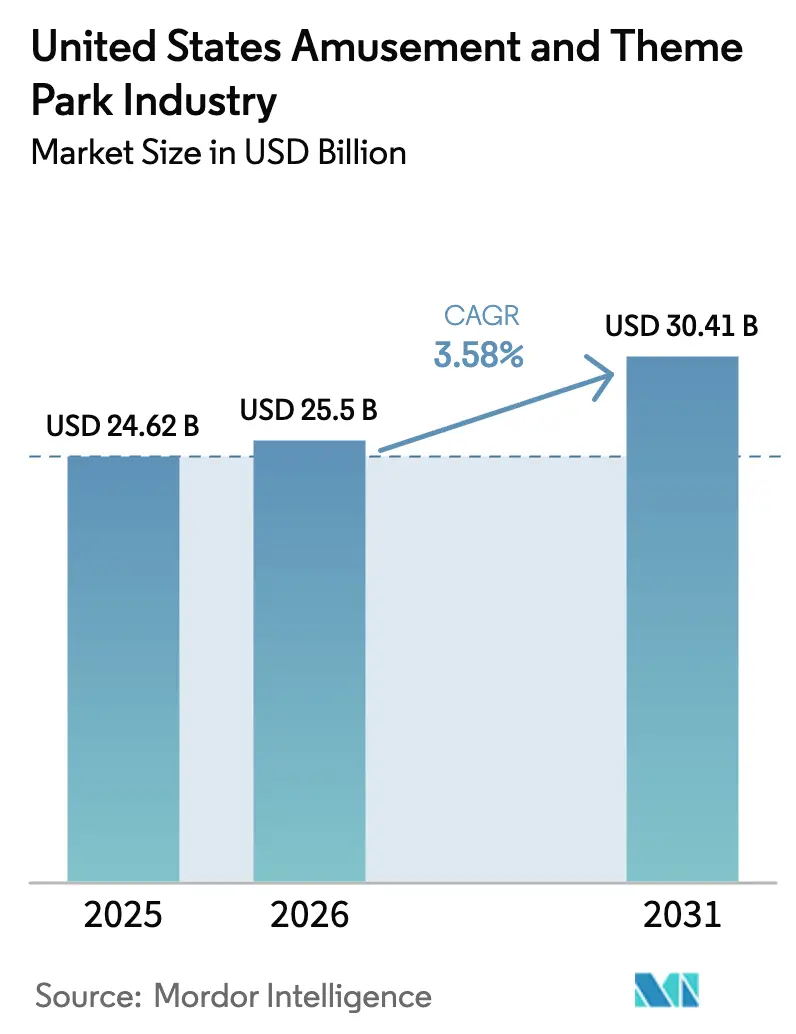
| Base Year Market Size (2025) | USD 24.62 Billion |
| Market Size (2026) | USD 25.5 Billion |
| Market Size (2031) | USD 30.41 Billion |
| Growth Rate (2026 - 2031) | 3.58% CAGR |
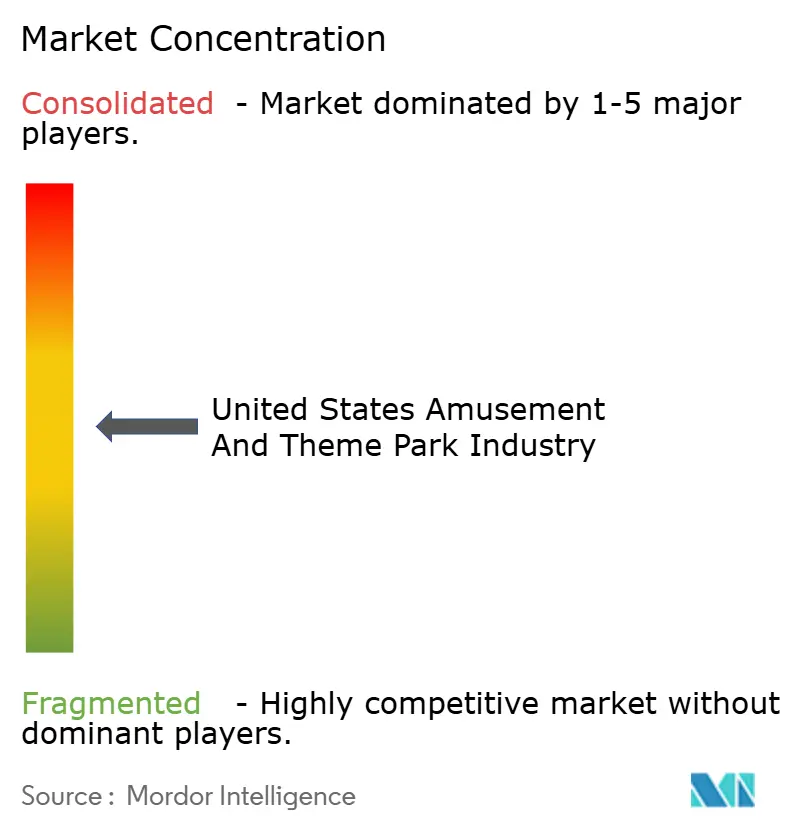
| Market Concentration | Medium |
Major Players *Disclaimer: Major Players sorted in no particular order Image © Mordor Intelligence. Reuse requires attribution under CC BY 4.0. | |
United States Amusement And Theme Park Industry Analysis by Mordor Intelligence
The United States Amusement And Theme Park Industry size was valued at USD 24.62 billion in 2025 and is estimated to grow from USD 25.5 billion in 2026 to reach USD 30.41 billion by 2031, at a CAGR of 3.58% during the forecast period (2026-2031).
Operators balance persistent cost pressures from labor and safety compliance with resilient demand for branded experiences and destination travel. Investment in new intellectual property and premium experiences shows clear upside, evidenced by a major new gate in Orlando that lifted segment revenue in its first peak summer. Consolidation is reshaping competitive dynamics and enabling scale benefits in pricing, procurement, and technology rollouts. Operators continue to deploy frictionless technologies that compress queue time and simplify transactions, which supports per-guest spending alongside dynamic product packaging.
Key Report Takeaways
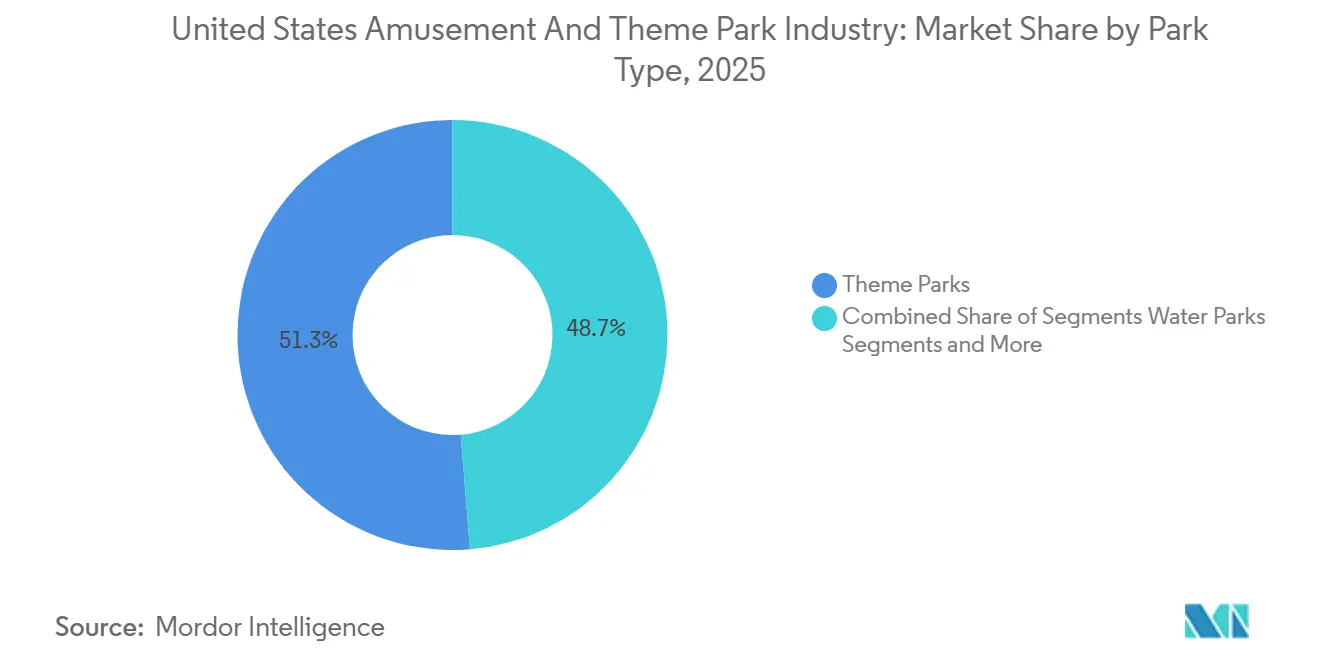
- By park type, theme parks captured 51.24% of the United States amusement and theme park market share in 2025, while indoor entertainment centers are projected to expand at a 6.36% CAGR through 2031.
- By ride type, land rides accounted for 58.74% of the United States amusement and theme park market share in 2025, while hybrid and dark rides are forecast to grow at a 5.84% CAGR through 2031.
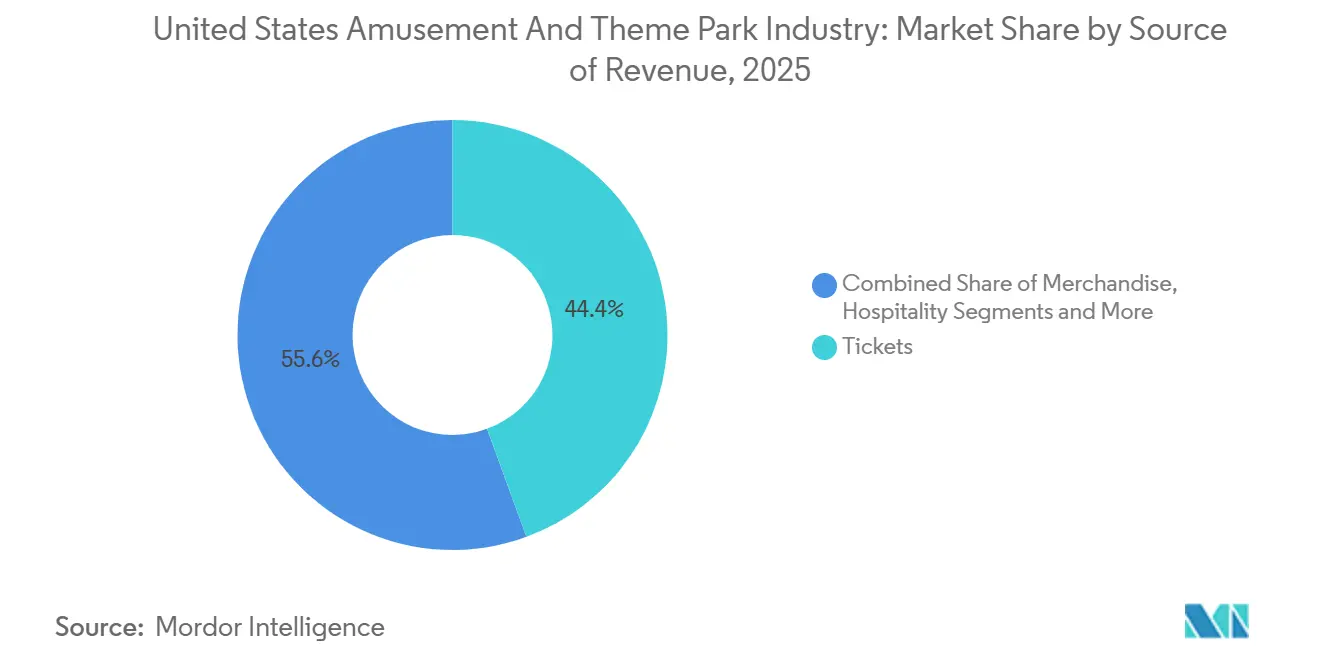
- By source of revenue, tickets commanded 44.36% of the United States amusement and theme park market share in 2025, while merchandise is projected to expand at a 6.24% CAGR through 2031.
- By geography, the Southeast held 27.24% of the United States amusement and theme park market share in 2025, while the West is expected to grow at a 7.65% CAGR through 2031.
Note: Market size and forecast figures in this report are generated using Mordor Intelligence’s proprietary estimation framework, updated with the latest available data and insights as of January 2026.
United States Amusement And Theme Park Industry Trends and Insights
Drivers Impact Analysis*
| Drivers | (~) % Impact on CAGR Forecast | Geographic Relevance | Impact Timeline |
|---|---|---|---|
| Growth in consumer spending and disposable income | +0.8% | National, strongest in Southeast and West urban centers | Medium term (2-4 years) |
| Surge in season-pass and subscription program adoption stabilizing year-round gate traffic | +0.6% | National, with highest penetration in Midwest and Northeast regional chains | Short term (≤ 2 years) |
| Flagship IP integrations widening demographic appeal and boosting per-capita spend | +0.9% | Southeast, West | Medium term (2-4 years) |
| Record pipeline of new high-thrill coaster installations | +0.7% | National, concentrated in Southeast, Southwest, Midwest | Short term (≤ 2 years) |
| Resort-style park expansions capturing multi-day guest spend | +0.5% | Southeast, select West markets | Long term (≥ 4 years) |
| Increase in domestic and international tourism | +0.9% | National, particularly Southeast gateway destinations | Medium term (2-4 years) |
| Source: Mordor Intelligence | |||
Growth in Consumer Spending & Disposable Income
Central Florida recorded USD 59.9 billion in direct visitor spending in 2024, with 75.3 million visitors supporting the region’s role as the core United States destination for theme and resort stays. The Walt Disney Company reported higher per capita guest spending at domestic parks in fiscal 2024 as pricing and product mix offset flat-to-slightly lower attendance [1]The Walt Disney Company, “Fiscal Year 2024 Annual Financial Report,” thewaltdisneycompany.com . United Parks & Resorts posted a record in-park per capita spending of USD 36.46 and continued to demonstrate pricing power despite weather disruptions during peak periods. In contrast, the combined Six Flags entity recorded a 9% attendance decline versus the prior-year combined baseline during Q2 2025, which reflected weather and pricing sensitivities among value-oriented day guests. International inbound travel adds incremental upside, with United States arrivals projected to surpass pre-2020 levels in 2026 and amusement parks capturing a substantial share of overseas visitor itineraries.
Surge in Season-Pass and Subscription Program Adoption Stabilizing Year-Round Gate Traffic
The combined Six Flags Entertainment Corporation reported an active pass base of 6.7 million units as of mid-2025, which anchors recurring revenue and helps smooth attendance variability within the United States amusement and theme park market. Portfolio integration following the 2024 merger created cross-park benefits and supports the rollout of standardized premium add-ons that lift per-passholder spend over time within the United States amusement and theme park market. United Parks & Resorts noted strong forward-booking trends heading into 2026 for Discovery Cove and group sales, signaling a sustained commitment to advance-purchase products through changing weather and macro conditions [2]United Parks & Resorts Inc., “United Parks & Resorts Inc. Reports Fourth Quarter and Fiscal 2024 Results,” unitedparksinvestors.com . Season passholders visit more often than single-ticket guests and support predictable cash flow and higher lifetime value when bundled with food and line-skipping programs, which operators scale across larger networks. The strategic risk is over-discounting that habituates consumers to lower thresholds, a dynamic that appears in periods of weak weather and tighter household budgets and is closely managed through data-driven revenue optimization.
Flagship IP Integrations Widening Demographic Appeal and Boosting Per-Capita Spend
Universal Destinations & Experiences’ new Orlando gate opened in May 2025 and delivered a 19% revenue increase in the theme parks segment in Q3 2025, demonstrating how a single high-profile launch can lift spending across a destination portfolio within the United States amusement and theme park market [3]Comcast Corporation, “3rd Quarter 2025 Results,” cmcsa.com . The operator also highlighted the project’s sustainability credentials and destination-scale economic footprint, underscoring the value of long-lived IP investments. Disney’s experiences segment reported 6% revenue growth to USD 36.2 billion in fiscal 2025, supported by new attraction content and product optimization that elevated guest spend per visit. The Themed Entertainment Association’s 2024 Global Experience Index showed Disney parks growing global attendance while the market stabilized, reflecting durable demand for branded worlds and premium experiences within the United States amusement and theme park market. The pace of high-impact IP deployment differentiates destination resorts from regional chains that compete more heavily on hardware alone, which constrains margin expansion without significant media tie-ins.
Record Pipeline of New High-Thrill Coaster Installations (2024–2026) Driving First-Time and Repeat Visitation
Operators elevated capital deployment for new coaster hardware before and during 2025 to differentiate core properties and re-energize local bases in the United States amusement and theme park market [4]Six Flags Entertainment Corporation, “FORM 10-Q for the Quarterly Period Ended June 29, 2025,” sec.gov . The strategy is to create near-term demand spikes and social reach while building longer-run passholder value when new rides are paired with premium access and media narratives. Yet rising equipment and component costs, including tariff overlays on select imported systems, compress return timelines unless attendance lifts persist through multiple seasons. United Parks & Resorts moderated total capital expenditures to USD 248.4 million in 2024, signaling that chains balance marquee investments with disciplined maintenance and ROI screens as they prioritize projects with resilient demand appeal. Markets with strong drive-time populations and year-round operations adapt faster because they can spread project costs over longer operating calendars and capture multi-day spending associated with resort packages.
Restraints Impact Analysis*
| Restraint | (~) Impact of CAGR Forecast | Geographical Relevance | Impact Timeline |
|---|---|---|---|
| Rising wage inflation and persistent frontline labor shortages escalating operating costs | -0.6% | National, acute in California and New York metro, moderate in Southeast | Short term (≤ 2 years) |
| Escalating cap-ex requirements for ride refurbishment and ASTM or OSHA safety compliance | -0.4% | West and Northeast United States | Long term (≥ 4 years) |
| Ticket-price growth outpacing CPI, limiting accessibility for middle-income families | -0.3% | National, pronounced in high-admission West Coast destinations | Medium term (2-4 years) |
| Increasing frequency of weather-related closures disrupting peak-season operations | -0.5% | Southeast hurricanes, Midwest extreme heat and storms | Short term (≤ 2 years) |
| Source: Mordor Intelligence | |||
Rising Wage Inflation and Persistent Frontline Labor Shortages Escalating Operating Costs
Domestic parks incurred higher operating labor expenses in fiscal 2025 due to inflation and staffing needs around new attractions, which pressured segment income even as revenue expanded. United Parks & Resorts highlighted wage inflation and benefit costs among its forward-looking risk factors, underscoring the persistence of cost pressures across key markets within the United States amusement and theme park market. Regional parks feel these increases more acutely because they lack resort lodging to diversify revenue and cannot always pass higher costs through gate pricing without suppressing demand. Operators continue to test self-service ordering, mobile pickup, and targeted staffing across peak windows to maintain service levels with fewer hours per transaction. The net effect is a search for automation that improves throughput while preserving guest satisfaction in the United States amusement and theme park market.
Escalating Cap-Ex Requirements for Ride Refurbishment and ASTM or OSHA Safety Compliance
The ASTM F24 committee advanced multiple standard updates across design, manufacturing, auditing, and quality domains in 2024 and 2025 meeting cycles, signaling a steady compliance cadence for new and modified attractions. IAAPA guidance reinforces the widespread adoption of ASTM ride safety standards across United States jurisdictions, which embeds recurring capital needs for refurbishment and inspection in the United States amusement and theme park market. Maintaining a strong safety record requires consistent investment in preventive maintenance, training, and documentation, all of which scale with ride inventory and operational complexity. United Parks & Resorts allocated USD 177.7 million to core capital expenditures in 2024 and separately funded expansion projects, highlighting the baseline investment needed to sustain compliance and guest safety. Tariff and component pricing dynamics present additional uncertainty on imported subsystems and parts, which operators manage through vendor relationships and multi-year planning.
*Our forecasts treat driver/restraint impacts as directional, not additive. The impact forecasts reflect baseline growth, mix effects, and variable interactions.
Segment Analysis
By Park Type: Indoor Entertainment Centers Surge as Suburban Mixed-Use Anchors
Theme parks held 51.24% in 2025, reflecting the largest slice of the format mix in the United States amusement and theme park market. Destination parks combine hotels, premium dining, and proprietary IP to justify multi-day visits and maintain a steady cadence of capital refresh. In the same period, indoor entertainment centers posted the fastest trajectory, with a 6.36% forecast CAGR through 2031, which aligns with the shift to shorter outings clustered around suburban mixed-use nodes. The United States amusement and theme park market benefits when compact indoor venues draw local families for two to three hours and then connect foot traffic to adjacent retail. Weather insulation and smaller footprint economics make indoor venues attractive for developers, while their digital-first operations simplify pricing, redemption, and loyalty.
Indoor growth does not diminish the role of destination parks in the United States amusement and theme park market. The flow of inbound visitors and a broad on-site product stack keep destination parks central to family travel plans. Water parks and animal or marine parks add variety but rely on careful event and holiday programming to sustain repeat local visits. The Themed Entertainment Association recorded changes across top properties and confirmed that attraction mix and storytelling drive repeat intent as much as raw ride scale. The United States amusement and theme park market size spans both destination and neighborhood formats as households balance budget, time, and novelty needs across the year.


By Ride Type: Hybrid and Dark Rides Redefine Attraction Economics
Land rides commanded 58.74% of 2025 revenue, reflecting the backbone of operational throughput for most properties in the United States amusement and theme park market. Steel coasters and high-capacity flat rides create headline appeal and social buzz that anchor seasonal campaigns. The fastest growth sits with hybrid and dark rides at a 5.84% forecast CAGR through 2031, where programmable content and trackless systems enable efficient refresh cycles. This ride family can be rethemed faster than ground-up coaster builds, which suits portfolio operators that want recurring novelty without extensive land use. Operators pair these rides with premium access and pay-per-experience add-ons that lift per-guest yield inside the United States amusement and theme park market.
Programmatic content also diversifies appeal across age cohorts and supports multi-visit behavior with score-based or narrative variations from trip to trip. Maintenance profiles and climate resilience matter as well, since indoor hybrid rides mitigate weather risk and help operators sustain baseline throughput on hot or stormy days. Standards bodies continue to update ride design and auditing practices, reinforcing safety and documentation across new formats and retrofits. Compliance strengthens confidence in new technologies and supports broader adoption across chains in the United States amusement and theme park market. The United States amusement and theme park market size benefits when operators can refresh marquee experiences through content updates without disrupting entire land plans.
By Source of Revenue: Merchandise Overtakes Tickets in Growth Velocity
Tickets maintained a 44.36% share in 2025 and remain the primary entry product in the United States amusement and theme park market. Operators have shifted focus to in-park monetization to finance rising labor and capex, which places greater importance on premium access, merchandising, and food. Merchandise leads growth with a 6.24% forecast CAGR through 2031 as exclusive collaborations and mobile ordering convert dwell time into transactions. Disney reported higher per capita guest spending in 2024 and 2025 as product optimization delivered yield in domestic parks even through uneven attendance. United Parks & Resorts reached a record in-park per capita spend in 2024, which highlights pricing power when product curation and convenience meet guest expectations.
Food and beverage is an anchor to this out-of-gate strategy in the United States amusement and theme park market. Premium line access remains an important high-margin layer because guests will trade time for money on peak days. Pricing must track value perception since families weigh total trip budgets and may opt for shorter stays or fewer add-ons when prices rise faster than wages. The United States amusement and theme park market size grows when operators align ticket structures with merchandising and dining plans that encourage balanced spending across categories. Chains that integrate frictionless payments and mobile fulfillment have a clearer path to protect margins in variable weather and attendance conditions.
Geography Analysis
The Southeast carried a 27.24% share in 2025, supported by Orlando’s year-round calendar and the largest concentration of destination parks in the United States amusement and theme park market. A transformative new gate launched in May 2025 and lifted Comcast’s theme parks segment revenue by 19% in Q3 2025, which helped drive multi-park performance across the destination. Central Florida recorded 75.3 million visitors in 2024 and USD 94.5 billion in total economic impact, which reinforced the durability of the region's tourism base. TEA’s 2024 index confirmed Magic Kingdom retained the top global attendance rank as destination leaders leveraged content refreshes and product optimization within the United States amusement and theme park market. Weather risk remains a factor in the Southeast, as hurricanes weighed on attendance and financial results for multiple operators in 2024 and early 2025.
The West is the fastest-growing region with a 7.65% forecast CAGR through 2031, driven by Southern California’s dual anchor resorts and ongoing enhancements within the United States amusement and theme park market. TEA reported Disneyland Park and Disney California Adventure combined for more than 27 million visits in 2024 as the market stabilized after lengthy pandemic-era disruptions. Universal Studios Hollywood recorded lower attendance in 2024 as on-site constraints and competitive intensity shaped the recovery curve in Greater Los Angeles. Operators in California face wage and cost inflation that encourages accelerated tech adoption for mobile ordering and queue management within the United States amusement and theme park market. The region’s large drive-time populations sustain shoulder-season programs and special events that add revenue days beyond peak summer calendars.
The Southwest, Midwest, and Northeast make up the balance of the regional footprint in the United States amusement and theme park market. The Southwest benefits from population growth in Texas and Arizona, but must manage extreme heat during peak summer weeks that suppresses attendance and raises operating costs. Midwest and Northeast properties compress much of their revenue into late spring through early fall, which increases the sensitivity to adverse weather on weekends and holidays. Pass programs and festivals expand calendars with Halloween and winter overlays that capture local demand, even with shorter operating seasons in the United States amusement and theme park market. Technology improvements like mobile preordering and virtual queuing support throughput in variable conditions and preserve guest spend during high-heat or rain windows. The United States amusement and theme park market size grows fastest where companies pair destination content with flexible pricing and indoor capacity that reduces weather exposure.
Competitive Landscape
Consolidation is remapping the landscape of the United States amusement and theme park market. The Six Flags and Cedar Fair merger created a 42-park platform across North America to scale procurement, analytics, and product harmonization, with a synergy roadmap focused on cost savings and revenue lifts from improved food and beverage execution and passholder frequency. Destination leaders deploy high-impact IP and resort capacity to support premium pricing and longer lengths of stay, which drives the mix shift from admissions to in-park categories. Regional operators emphasize pass volume and targeted upsells to protect share in price-sensitive corridors within the United States amusement and theme park market. The gap between integrated resorts and day-visit parks will widen where labor and weather volatility are most persistent.
Strategic moves during 2025 underline diverging playbooks in the United States amusement and theme park market. Comcast’s Orlando launch delivered a 19% revenue increase in Q3 and advanced a multi-year resort strategy that reinforces the city’s role as a multi-park hub. Disney raised segment capital expenditures toward USD 9 billion in fiscal 2026 and continued to invest in fleet expansion and new attractions that strengthen experience ecosystems across parks and cruises. The combined Six Flags organization pursued cost actions and evaluated portfolio moves in response to weather impacts and attendance variability while integrating technology platforms across the new network. These strategies reflect a broader push to stabilize throughput and yield across seasonal volatility.
Safety, standards, and public reporting reinforce the competitive moat of scaled operators in the United States amusement and theme park market. IAAPA’s safety research underscores the very low incidence of serious injuries and the importance of continued investment in inspections, training, and refurbishment to sustain that record. CPSC’s documentation of ASTM F24 activity shows active updates across multiple safety standards that affect capital planning and audit practices. United Parks & Resorts advanced balance-sheet flexibility and emphasized forward bookings in premium products while weathering event-driven attendance pressure. Comcast extended its brand beyond gate-based parks with the Las Vegas opening of a year-round horror experience that broadens its reach into urban entertainment. Competitive intensity will remain elevated as integrated resorts scale attractions and regional platforms optimize portfolios and pricing within the United States amusement and theme park market.
United States Amusement And Theme Park Market Leaders
Disney Parks, Experiences and Products
Universal Destinations & Experiences
Six Flags Entertainment Corporation
Cedar Fair L.P.
SeaWorld Parks & Entertainment, Inc.
- *Disclaimer: Major Players sorted in no particular order

Recent Industry Developments
- November 2025: Legoland California and Florida planned a huge expansion with an entirely new space-themed land, pushing the parks into outer space themes.
- November 2025: Dollywood's parent company, Herschend, expanded its theme park empire into the Northwest through a major acquisition, further strengthening its regional presence after earlier mergers.
- July 2025: Herschend sold Raging Waters Los Angeles, Castle Park, and Wet 'n Wild Emerald Pointe to Lucky Strike Entertainment, a bowling alley company, as part of portfolio adjustments following recent acquisitions.
- May 2025: Universal Epic Universe launched the new dark ride in the Wizarding World, set after the Harry Potter films, involving chaos in the British Ministry of Magic.


Research Methodology Framework and Report Scope
Market Definitions and Key Coverage
Our study defines the United States amusement and theme park market as all fixed-site facilities that operate permanent mechanical, water, hybrid, and experiential rides alongside themed shows, food, retail, and on-site events. A theme park is treated as a subset that organizes the guest journey around a unifying intellectual property, story line, or cultural motif, while general amusement parks offer mixed attractions without a central theme. According to Mordor Intelligence, the market generates revenue only when the spend occurs inside the gated park perimeter or its directly managed digital channels.
Scope exclusion: Travelling carnivals, single-ride attractions, independent family entertainment centers, and hotel revenue booked outside park ownership are not counted.
Segmentation Overview
- By Park Type
- Theme Parks
- Water Parks
- Adventure Parks / Thrill Parks
- Animal & Marine Parks
- Indoor Entertainment Centers
- By Ride Type
- Land Rides
- Water Rides
- Hybrid / Dark Rides
- Other Rides
- By Source of Revenue
- Tickets
- Food & Beverages
- Merchandise
- Hospitality (Lodging & Events)
- Ancillary Services (Parking, Photos, Fast-Pass, etc.)
- By Region
- Northeast
- Southeast
- Southwest
- West
- Midwest
Detailed Research Methodology and Data Validation
Primary Research
Mordor analysts maintain rolling interviews with park finance managers, ride OEM sales heads, food-service concessionaires, state tourism officials, and insurance underwriters across Florida, California, Ohio, and Texas. These conversations test preliminary assumptions on gate price strategy, attendance elasticity, and downtime patterns, and they fill gaps that published statistics leave unanswered.
Desk Research
We start with federal and industry-body data such as the U.S. Bureau of Labor Statistics QCEW establishment counts, Bureau of Economic Analysis recreation output tables, and U.S. Travel Association leisure spend trends, which ground visitation and spend ceilings. Attendance audits from the Themed Entertainment Association, accident and inspection filings from state safety regulators, and patent activity on ride systems accessed via Questel help us gauge installed ride base and pipeline. Public company filings mined through D&B Hoovers, plus earnings call transcripts retrieved on Dow Jones Factiva, supply park-level revenue splits. These sources set boundary conditions before primary inputs are layered. The sources mentioned illustrate our approach and are not an exhaustive list of references used.
Market-Sizing & Forecasting
A top-down construct ties historical attendance, average ticket, food, and merchandise spends to produce the 2024 base, which is then bridged to 2025. Results are corroborated with bottom-up checks using sampled operator revenues and ride-cycle throughput models. Key variables include per-capita disposable income, domestic leisure trip volume, announced new-ride capacity, inflation-adjusted gate pricing, and seasonal weather disruption days; each is forecast through multivariate regression and ARIMA routines that capture near-term shocks and longer consumer trends. Gaps in smaller operator data are filled through attendance proxies derived from mobile location analytics shared by regional tourism boards.
Data Validation & Update Cycle
Outputs pass three analyst reviews, where variances above preset thresholds trigger re-contact of interviewees and source rechecks. Models are refreshed every twelve months, with interim revisions when mergers, regulation, or extreme weather materially shift demand. A final pre-publication sweep ensures clients receive the latest calibrated numbers.
Why Our United States Amusement And Theme Park Industry Size & Share Analysis Baseline Commands Reliability
Published figures vary because firms adopt different inclusion rules, exchange-rate dates, and refresh cadences.
We acknowledge these gaps upfront and explain them so decision-makers can anchor confidently.
Benchmark comparison
| Market Size | Anonymized source | Primary gap driver |
|---|---|---|
| USD 24.6 B (2025) | Mordor Intelligence | - |
| USD 28.4 B (2024) | Regional Consultancy A | Counts resort lodging and indoor FECs not within our scope |
| USD 34.1 B (2024) | Industry Journal B | Uses NAICS 71311 data that bundles arcades and county fairs |
| USD 36.9 B (2030) | Global Consultancy C | Applies forward CAGR to a broader 2024 base that already included ancillary hotel revenue |
The comparison shows how scope creep, older baselines, or optimistic growth multipliers inflate totals. By selecting only in-park revenue streams, validating prices with operators, and updating every year, Mordor Intelligence delivers a balanced, transparent baseline that planners can trace back to clear variables and repeatable steps.


Key Questions Answered in the Report
What is the size and growth outlook for the United States amusement and theme park market through 2031?
The United States amusement and theme park market size is USD 25.50 billion in 2026 and is projected to reach USD 30.41 billion by 2031 at a 3.58% CAGR.
Which formats are growing fastest within the United States amusement and theme park market?
Indoor entertainment centers lead with a 6.36% forecast CAGR through 2031, and hybrid or dark rides are the fastest-growing ride category at a 5.84% forecast CAGR through 2031.
Which region leads the United States amusement and theme park market and which region grows fastest?
The Southeast leads with a 27.24% share in 2025, while the West posts the fastest growth at a 7.65% forecast CAGR through 2031.
How are operators responding to cost pressures in the United States amusement and theme park market?
Operators are scaling mobile ordering, premium access, and merchandising ecosystems to lift per-guest spending while optimizing labor and maintenance costs.
What role does IP play in the growth of the United States amusement and theme park market?
New IP gates and attractions elevate demand and per-guest spend and help destination parks support multi-day stays, as seen with the strong Orlando performance in 2025.
How are weather and seasonality shaping strategies in the United States amusement and theme park market?
Operators diversify calendars with festivals, invest in indoor capacity and resilience, and use dynamic products to protect throughput during extreme weather periods.
Page last updated on:


