Market Overview
| Study Period | 2021 - 2031 |
|---|---|
| Forecast Data Period | 2026 - 2031 |
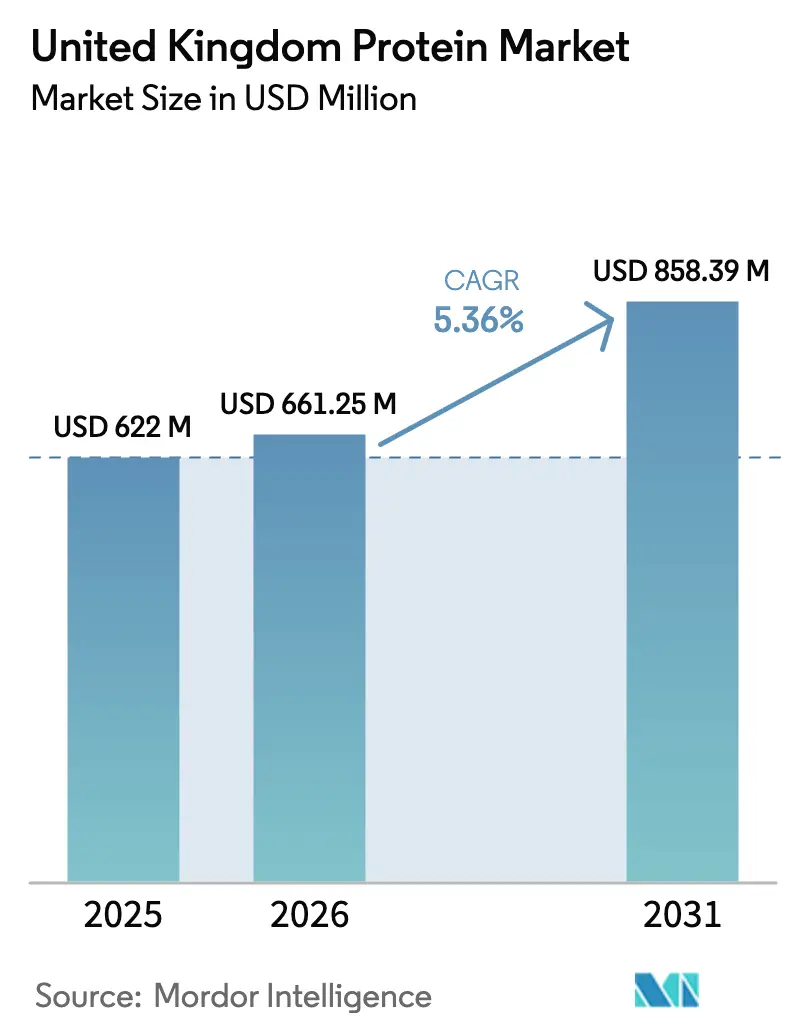
| Base Year Market Size (2025) | USD 622 Million |
| Market Size (2026) | USD 661.25 Million |
| Market Size (2031) | USD 858.39 Million |
| Growth Rate (2026 - 2031) | 5.36% CAGR |
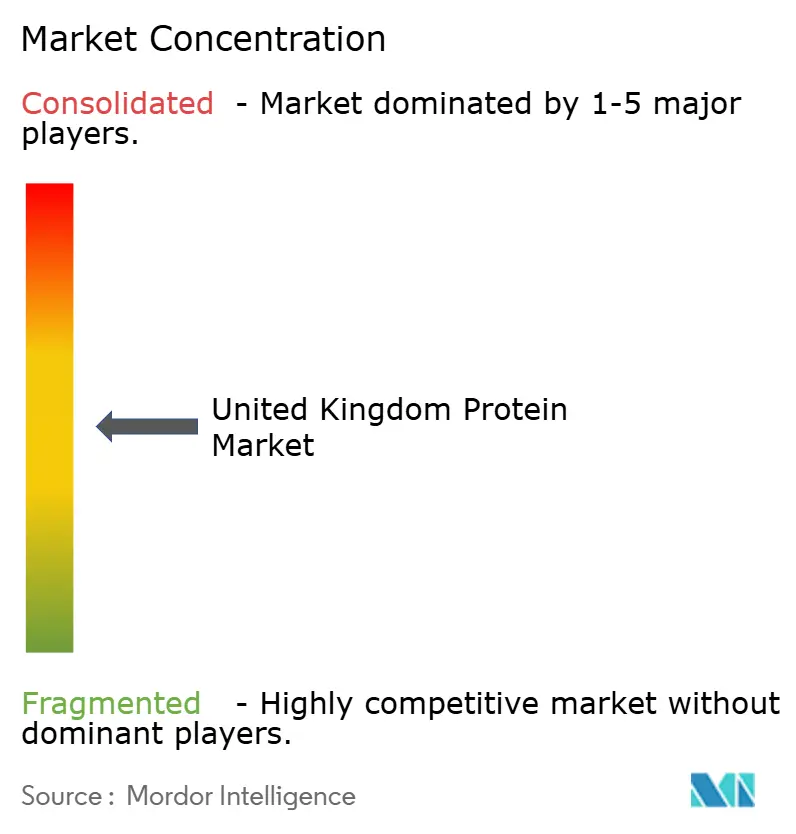
| Market Concentration | Medium |
Major Players*Disclaimer: Major Players sorted in no particular order Image © Mordor Intelligence. Reuse requires attribution under CC BY 4.0. |
|
United Kingdom Protein Market Analysis by Mordor Intelligence
The United Kingdom Protein Market size is expected to grow from USD 622 million in 2025 to USD 661.25 million in 2026 and is forecast to reach USD 858.39 million by 2031 at 5.36% CAGR over 2026-2031. Consumer preferences are shifting from traditional animal proteins to premium options, particularly plant-based, functional, and specialty proteins. This transition is driven by Gen-Z's inclination toward social-media-inspired snacking and the growing acceptance of sports nutrition. Factors such as flexitarian diets, post-Brexit supply chain disruptions, and dairy price volatility are shaping purchasing behaviors. Simultaneously, advancements in extraction, filtration, and precision fermentation are enabling cleaner flavors and higher protein concentrations. Retailers are dedicating more shelf space to protein-enriched snacks, cereals, and ready-to-drink beverages. Ingredient suppliers are also expanding their formulation support, focusing on collagen, whey isolate, and innovative insect applications. The competitive landscape remains moderately intense, with multinationals consolidating high-margin assets and start-ups exploring opportunities in microbial and insect proteins.
Key Report Takeaways
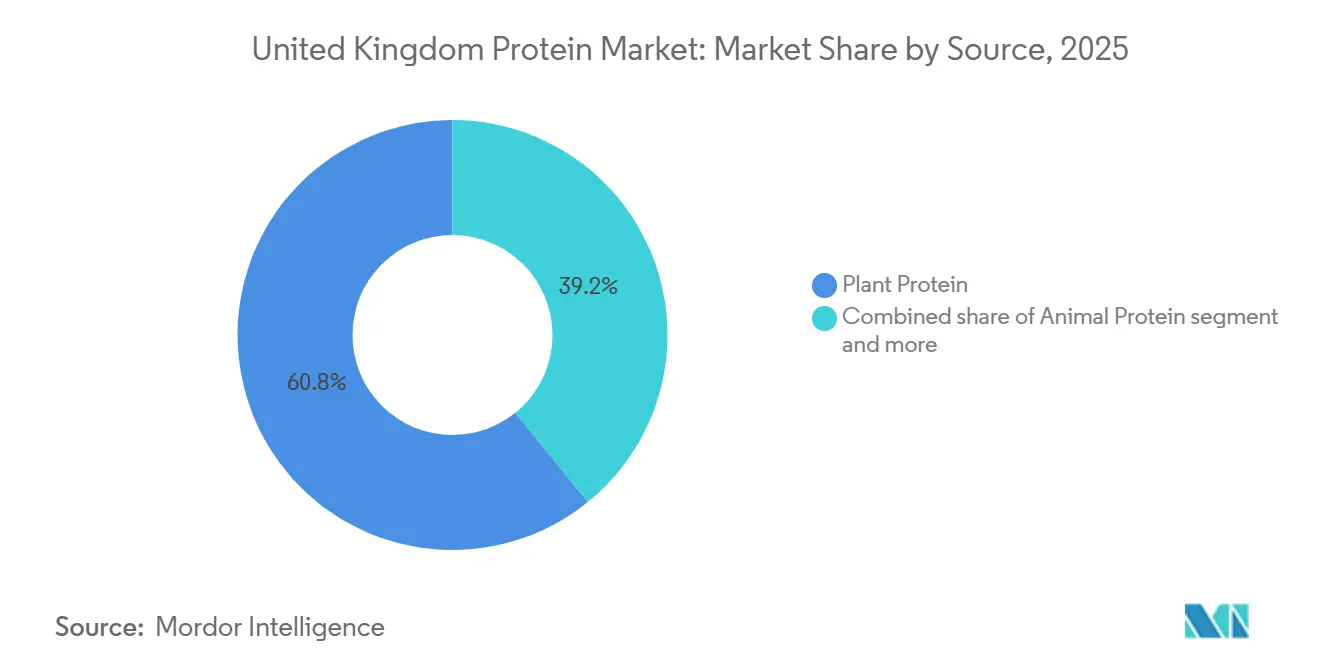
- By source, plant protein led with 60.84% of the United Kingdom protein market share in 2025, while animal protein is forecast to advance at a 6.32% CAGR through 2031.
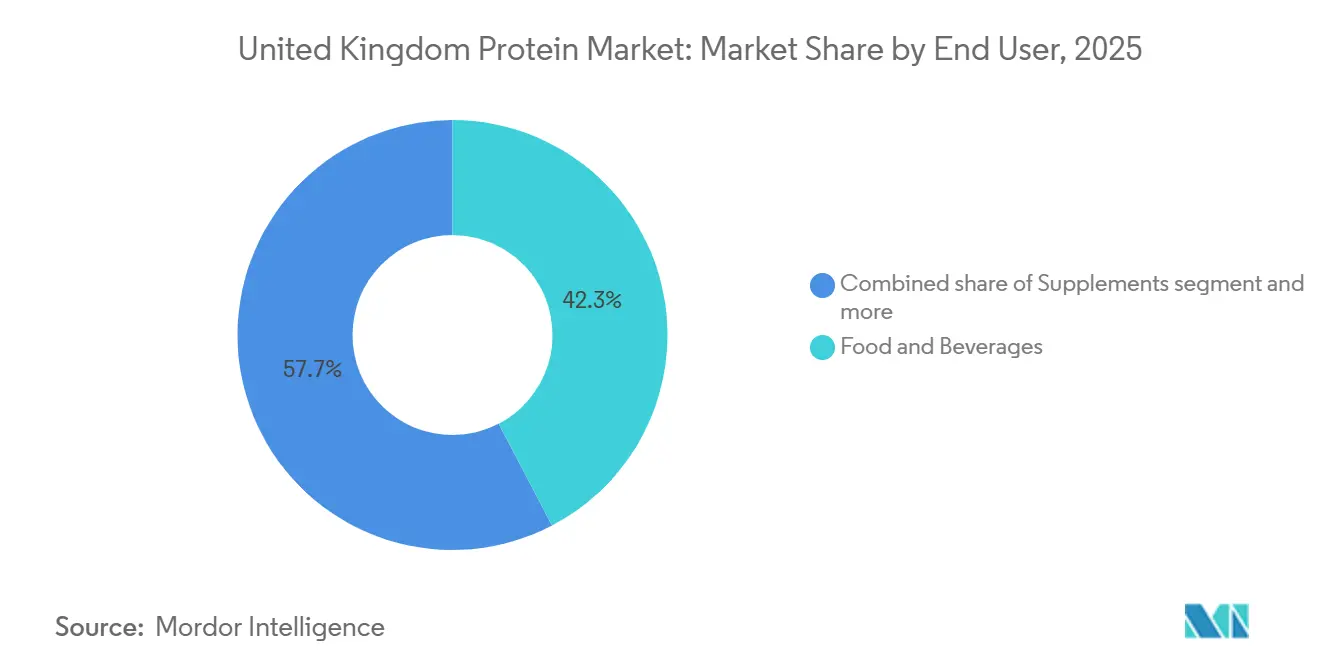
- By end user, food and beverages held a 42.34% share of the United Kingdom protein market size in 2025, whereas supplements are projected to expand at a 6.47% CAGR to 2031.
Note: Market size and forecast figures in this report are generated using Mordor Intelligence’s proprietary estimation framework, updated with the latest available data and insights as of January 2026.
United Kingdom Protein Market Trends and Insights
Drivers Impact Analysis*
| Driver | (~) % Impact on CAGR Forecast | Geographic Relevance | Impact Timeline |
|---|---|---|---|
| High-protein snacking trend among Gen-Z consumers | +0.9% | National, with concentration in urban centers (London, Manchester, Birmingham) | Short term (≤ 2 years) |
| Growth in sports-nutrition and active-lifestyle adoption | +0.8% | National, with stronger penetration in England and Scotland | Medium term (2-4 years) |
| Technological advancements in protein extraction, processing, and formulation | +0.7% | National, with research hubs in Southeast England and Yorkshire | Long term (≥ 4 years) |
| Surge in vegan, vegetarian, and plant-based lifestyles boosting alternative proteins | +1.1% | National, with highest adoption in London, Northeast, Southwest | Medium term (2-4 years) |
| Expansion of protein-fortified foods, snacks, cereals, and meat alternatives | +0.9% | National retail and foodservice channels | Medium term (2-4 years) |
| Innovations in functional proteins for recovery, satiety, and vitality | +0.6% | National, with early gains in sports nutrition and elderly care segments | Long term (≥ 4 years) |
| Source: Mordor Intelligence | |||


High-protein snacking trend among gen-z consumers
In 2024, the Office for National Statistics (United Kingdom) reported that the Gen-Z population in the United Kingdom stood at 12,697,983 [1]Source: Office for National Statistics, "UK population estimates 1838-2024 edition", ons.gov. This demographic, heavily influenced by social media trends, is transforming protein consumption patterns by prioritizing convenience, appealing taste profiles, and clear macronutrient information. Gen-Z consumers show a strong preference for single-serve products that prominently display protein content and feature clean-label ingredient lists. They are increasingly replacing traditional meal structures with snacking occasions, particularly during mid-morning and afternoon hours. To cater to this demand, retailers have expanded their chilled protein snack sections. Additionally, brands like Biotiful have responded by launching innovative products such as Kefir Protein drinks in August 2024, which provide 20 grams of protein per 330-milliliter serving. The sustainability of this trend depends on consistent influencer engagement and the industry's ability to deliver products that match the taste appeal of indulgent alternatives. This remains a significant challenge, as the limited penetration of high-protein confectionery has historically been attributed to taste-related constraints.
Growth in sports-nutrition and active-lifestyle adoption
In the United Kingdom, the protein market is experiencing significant growth, driven by the increasing adoption of active lifestyles and the rising popularity of sports nutrition. Protein, which was once regarded as a niche supplement for performance enhancement, has now evolved into a mainstream nutrient essential for recovery, weight management, and overall health and vitality. This transformation has resulted in a structural increase in demand across various protein sources, including animal-based, plant-based, and novel proteins. The growing number of individuals participating in sports and joining fitness clubs highlights the expansion of the active-lifestyle demographic. This shift has created a steady and recurring demand for protein products designed to support recovery and enhance performance. For example, Sport England reported that in 2024, 2,222,500 people in England actively participated in football [2]Source: Sport England, "Active Lives Adult Survey", sportengland.org. Additionally, sports nutrition products, which were previously limited to specialty retail channels, have now penetrated mainstream grocery stores. This shift is largely attributed to their active-lifestyle positioning, which appeals to a broader consumer base beyond just competitive athletes.
Technological advancements in protein extraction, processing, and formulation
Precision fermentation and enzymatic hydrolysis are now unlocking advanced protein functionalities that were previously unattainable through mechanical extraction methods. In 2024, the United Kingdom government's Alternative Proteins Roadmap emphasized microbial fermentation as a transformative approach to producing animal-identical proteins without the need for livestock. The roadmap highlighted Quorn's mycoprotein platform, which leverages Fusarium venenatum fermentation, as a well-established and commercially successful model. Additionally, enzyme-assisted extraction techniques for pea and soy proteins significantly reduce undesirable off-flavors while improving solubility. These advancements effectively address the long-standing taste and texture challenges that have limited the widespread adoption of plant-based proteins. By incorporating these innovative processes, formulators can achieve desired protein content without compromising on sensory attributes. This development is particularly critical as consumers increasingly reject the chalky texture and beany flavors associated with earlier generations of plant-based proteins.
Surge in vegan, vegetarian, and plant-based lifestyles boosting alternative proteins
The United Kingdom protein market is undergoing a transformation as vegan, vegetarian, and plant-based lifestyles gain traction. Demand is shifting from traditional animal proteins to alternative plant and microbial sources, leading to a structural expansion of total protein demand rather than merely replacing meat and dairy. Health, ethical, and environmental concerns are driving this change, creating opportunities for higher-value applications of alternative proteins across food, beverage, and supplement sectors. Many consumers now associate reducing meat consumption with improved health and environmental benefits, increasing the demand for legumes, pulses, and plant-based protein concentrates and isolates. Concerns about animal welfare and the environmental impact of livestock farming are encouraging shoppers to choose plant-based meat and dairy alternatives. This trend is boosting the use of soy, pea, chickpea, fava, and mung bean proteins, along with fungi-based ingredients. As plant proteins grow faster and capture a larger share of the market compared to animal proteins, the overall protein market is becoming more diversified. Alternative proteins are not only replacing existing demand but also driving incremental growth, reflecting a significant shift in the market dynamics.
Restraints Impact Analysis*
| Restraint | (~) % Impact on CAGR Forecast | Geographic Relevance | Impact Timeline |
|---|---|---|---|
| Price volatility of dairy-based proteins | -0.6% | National, with acute impact on whey and casein processors | Short term (≤ 2 years) |
| Regulatory uncertainty for insect and cultivated proteins | -0.4% | National, affecting novel protein commercialization | Long term (≥ 4 years) |
| Allergen-related labeling liabilities | -0.3% | National, impacting all protein ingredient suppliers | Medium term (2-4 years) |
| Supply-chain fragility for pea/soy imports post-Brexit | -0.5% | National, with concentrated risk in pulse and oilseed supply | Medium term (2-4 years) |
| Source: Mordor Intelligence | |||
Price volatility of dairy-based proteins
In October 2025, farm-gate milk prices in the United Kingdom averaged 45.56 pence per liter, showing a 1.1% increase from September[3]Source: Agriculture and Horticulture Development Board, "UK Farmgate Milk Prices Overview " ahdb.org.uk. This rise was mainly driven by higher feed and energy costs, along with lower milk yields caused by unfavorable weather conditions. Glanbia reported that dairy ingredient prices fell during the first half of 2024 but recovered in the third quarter, highlighting the sector's sensitivity to short-term supply disruptions. These price fluctuations create challenges for long-term supply agreements, prompting buyers to adopt strategies such as hedging with futures contracts or transitioning to plant-based proteins. Plant proteins, supported by the scalability of global pulse production, provide more stable pricing compared to dairy ingredients. Meanwhile, smaller processors, often lacking the infrastructure for hedging, face significant working-capital pressures during periods of rising input costs. These financial constraints hinder their ability to invest in expanding production capacity or driving innovation, further reducing their competitiveness in the market.
Regulatory uncertainty for insect and cultivated proteins
The United Kingdom Food Standards Agency's novel-foods register currently includes eight insect-derived applications, such as yellow mealworm, house cricket, migratory locust, and lesser mealworm. However, the approval process for these applications spans 18 to 36 months, significantly delaying their commercialization and discouraging potential capital investments in the market. While the European Union has granted authorization for Tenebrio molitor, the United Kingdom retained this approval following Brexit. Despite this, new applications must undergo comprehensive and rigorous safety assessments, which evaluate factors such as allergenicity, toxicology, and nutritional composition. Producers of insect protein, such as Ynsect, an organization that successfully secured European Union authorization for yellow mealworm larvae and powder, face considerable challenges. These include navigating the complexities of regulatory compliance and addressing the need for consumer education. This dual burden not only slows the pace of market penetration but also increases the costs associated with acquiring customers, creating additional hurdles for market growth.
*Our forecasts treat driver/restraint impacts as directional, not additive. The impact forecasts reflect baseline growth, mix effects, and variable interactions.
Segment Analysis
By Source: Animal Proteins Reclaim Margin-Rich Applications
Animal protein is anticipated to grow at a 6.32% CAGR through 2031, surpassing the overall market, even as plant protein holds a 60.84% share in 2025. This growth underscores a shift towards premium products such as whey protein isolates, collagen peptides, and the emerging commercialization of insect protein, all of which command higher per-kilogram prices compared to standard soy or pea concentrates. Whey protein remains a key driver; Arla's acquisition of Volac's Felinfach facility in Wales, approved in November 2024, enhances its access to whey protein isolate production, fueled by increasing demand in sports nutrition and infant formulas. Casein and its derivatives cater to specialized applications in clinical nutrition and baking, leveraging their slow-digesting properties for sustained amino acid release. Collagen, sourced from bovine and marine origins, is gaining traction in personal care and supplements with claims of joint health and skin elasticity, though these claims lack consistent clinical validation.
Egg protein occupies a niche in baking and confectionery due to its emulsifying and foaming capabilities, while gelatin plays a critical role in gummy supplements and pharmaceutical capsules. Insect protein, led by yellow mealworm, is on the verge of broader commercialization. Milk protein concentrates and isolates act as a bridge between whey and casein, providing formulators with flexibility to adjust protein-to-lactose ratios in dairy beverages and nutrition bars. The "other animal protein" category highlights emerging sources like cricket powder and bovine blood plasma, both of which face regulatory and sensory challenges that limit their short-term scalability.


By End User: Supplements Outpace Food and Beverages
Supplements are anticipated to grow at a 6.47% CAGR through 2031, making them the fastest-growing end-user segment. This growth is fueled by the alignment of sports nutrition, infant formulas, and elder nutrition around high-protein, low-sugar formulations. In 2025, food and beverages accounted for a 42.34% market share, driven by protein-fortified cereals, snacks, and dairy alternatives. However, growth is decelerating as core categories like Greek yogurt and protein bars approach market saturation. In 2024, Glanbia's Optimum Nutrition and Isopure brands achieved double-digit volume growth in the United Kingdom, propelled by the popularity of ready-to-drink formats and clear whey innovations, which appeal to mainstream consumers beyond competitive athletes. Baby food and infant formulas represent a high-margin niche; whey protein isolate and hydrolyzed proteins comply with the United Kingdom's stringent regulations, ensuring they meet the required minimum protein content and amino acid profiles.
In the food and beverage sector, bakery products use wheat gluten and egg protein to achieve the desired structure and texture. Beverages, including plant-based milks and clear protein drinks, emphasize solubility and a neutral taste. Protein fortification is becoming more common in breakfast cereals; for example, Kellogg's High Protein Bites and Weetabix's Ufit cereals, with 15 grams of protein per serving, leverage the United Kingdom's 20%-energy-from-protein threshold for high-protein claims. Confectionery and condiments remain underdeveloped due to challenges with taste and texture when replacing sugar or fat with protein. Meat, seafood, and their alternatives rely on soy, pea, and mycoprotein. Quorn's Fusarium venenatum fermentation provides a chicken-like protein profile with a fibrous texture that mimics whole muscle. Ready-to-eat and ready-to-cook meals now include protein to support "balanced nutrition" positioning. Snacks, such as protein crisps and nut bars, are capitalizing on Gen-Z's mid-morning and afternoon snacking preferences.
Geography Analysis
England captures the largest value pool, driven by dense retail networks and a high concentration of fitness facilities. London leads the way in innovation with pop-up high-protein cafés and influencer-led product launches, while manufacturing clusters in the Southeast benefit from their proximity to European Union export routes. Scotland demonstrates above-average per-capita spending on sports-nutrition supplements, reflecting its active lifestyle culture and strong university sports programs.
Northern Ireland depends heavily on cross-border trade with the Republic of Ireland, but new border checks have caused transit delays, disrupting the just-in-time delivery of refrigerated protein drinks. In Wales, the Felinfach whey isolate facility provides a local supply advantage for sports-nutrition brands operating in the region. Additionally, regional governments in the Midlands and Yorkshire are offering grants to support plant-protein extrusion lines, aiming to enhance domestic capacity and reduce reliance on imports.
Consumer preferences vary across regions: vegan and vegetarian adoption peaks in London and the Southwest, prompting retailers to allocate more shelf space to plant-based products. In the Northeast, flexitarian consumers prefer hybrid burgers that combine beef and pea protein, showcasing a balanced approach to protein diversification. These regional differences offer a roadmap for targeted marketing and localized supply-chain strategies, driving the growth of the United Kingdom's protein market.
Competitive Landscape
The United Kingdom protein market is moderately fragmented. Top multinationals such as Arla Foods AmbA, Glanbia Plc, Kerry Group Plc, and DSM-Firmenich dominate dairy and plant protein inputs, reflecting a moderately concentrated market. Roquette is expanding pea protein production in France and the Netherlands, supplying U.K. snack manufacturers that value consistent functionality. Quorn Foods operates Europe’s largest mycoprotein fermentation facility in Billingham, but faces growing competition from start-ups exploring alternative fungal strains. Ynsect is advancing insect protein development but awaits regulatory approvals and increased consumer awareness.
The United Kingdom protein market is highly competitive, with major players actively pursuing innovation and expansion strategies. Companies are heavily focused on creating novel protein ingredients, particularly in the plant-based and alternative protein segments, to cater to changing consumer preferences. Key industry strategies include capacity expansions, facility upgrades, and advancements in protein processing technologies. Companies demonstrate operational flexibility by quickly responding to evolving market demands, especially the increasing preference for clean-label and sustainable protein sources. Market leaders are solidifying their positions through partnerships with research institutions and technology providers, while also investing in research and development to develop specialized protein solutions for applications across the food, beverage, and nutrition sectors.
Strategic efforts include precision-fermentation collaborations between DSM-Firmenich and U.K. biotech firms, upgrades to extrusion lines in Midlands facilities to enhance meat-alternative textures, and retailer-supplier partnerships emphasizing allergen-safe packaging. Small and mid-sized firms face challenges with high capital requirements and compliance costs under Natasha’s Law, driving consolidation. As dairy price volatility continues, integrated players mitigate risks by diversifying their protein portfolios, while niche innovators focus on areas such as collagen peptides and functional clear drinks.
United Kingdom Protein Industry Leaders
-
Archer Daniels Midland Company
-
Arla Foods AmbA
-
Darling Ingredients Inc.
-
International Flavors and Fragrances Inc.
-
Kerry Group Plc
- *Disclaimer: Major Players sorted in no particular order

Recent Industry Developments
- May 2024: Roquette introduced NUTRALYS® Fava S900M, a fava bean protein isolate, in Europe, including the United Kingdom. The company added this product to its NUTRALYS® plant protein range, marking it as the first protein isolate derived from fava beans in its lineup.
- April 2024: Arla Foods Ingredients has signed an agreement to acquire Volac's Whey Nutrition business. The acquisition involves purchasing shares in Volac Whey Nutrition Holdings Limited and its subsidiaries, Volac Whey Nutrition Limited and Volac Renewable Energy Limited. Volac, a United Kingdom-based company, specializes in processing whey into ingredients for sports nutrition, with by-products sold for food and animal nutrition.


United Kingdom Protein Market Report Scope
Proteins refer to substances derived from natural sources (animal, plant, or microbial) that have been isolated or concentrated through processing to be used as additives in other products. The United Kingdom protein market is segmented by source and end user. By source, the market is segmented into animal protein, microbial protein, and plant protein. The animal protein segment is further segmented into casein and caseinates, collagen, egg protein, gelatin, milk protein, whey protein, insect protein, and other. The plant protein segment is further segmented into soy, pea, wheat, hemp, rice, potato, and other. The microbial protein segment is further segmented into mycoprotein and algae. By end user, the market is segmented into food and beverages, animal feed, supplements, and more. The market forecasts are provided in terms of value (USD) and volume (tons) for all the abovementioned segments.
By Source
| Animal Protein | Casein and Caseinates |
| Collagen | |
| Egg Protein | |
| Gelatin | |
| Milk Protein | |
| Whey Protein | |
| Insect Protein | |
| Other Animal Protein | |
| Plant Protein | Soy Protein |
| Pea Protein | |
| Wheat Protein | |
| Hemp Protein | |
| Rice Protein | |
| Potato Protein | |
| Other Plant Protein | |
| Microbial Protein | Mycoprotein |
| Algae Protein |
By End User
| Food and Beverages | Bakery |
| Beverages | |
| Breakfast Cereals | |
| Confectionery | |
| Condiments/Sauces | |
| Dairy and Dairy Alternatives | |
| Meat/Seafood and Meat Alternatives | |
| RTE/RTC Meals | |
| Snacks | |
| Animal Feed | |
| Supplements | Sport/Performance Nutrition |
| Baby Food and Infant Formula | |
| Elderly and Medical Nutrition | |
| Personal Care and Cosmetics |
| By Source | Animal Protein | Casein and Caseinates |
| Collagen | ||
| Egg Protein | ||
| Gelatin | ||
| Milk Protein | ||
| Whey Protein | ||
| Insect Protein | ||
| Other Animal Protein | ||
| Plant Protein | Soy Protein | |
| Pea Protein | ||
| Wheat Protein | ||
| Hemp Protein | ||
| Rice Protein | ||
| Potato Protein | ||
| Other Plant Protein | ||
| Microbial Protein | Mycoprotein | |
| Algae Protein | ||
| By End User | Food and Beverages | Bakery |
| Beverages | ||
| Breakfast Cereals | ||
| Confectionery | ||
| Condiments/Sauces | ||
| Dairy and Dairy Alternatives | ||
| Meat/Seafood and Meat Alternatives | ||
| RTE/RTC Meals | ||
| Snacks | ||
| Animal Feed | ||
| Supplements | Sport/Performance Nutrition | |
| Baby Food and Infant Formula | ||
| Elderly and Medical Nutrition | ||
| Personal Care and Cosmetics | ||


Market Definition
- End User - The Protein Ingredients Market operates on a B2B basis. Food, Beverages, Supplements, Animal Feed, and Personal Care & Cosmetic manufacturers are considered to be end-consumers in the market studied. The scope excludes manufacturers buying liquid/dry whey to be used for application as a binding agent or thickener or other non-protein applications.
- Penetration Rate - Penetration Rate is defined as the percentage of Protein-Fortified End User Market Volume in the Overall End User Market Volume.
- Average Protein Content - Average protein content is the average protein content present per 100 g of product manufactured by all end-user companies considered under the scope of this report.
- End User Market Volume - End-user market volume is the consolidated volume of all types and forms of end-user products in the country or region.
| Keyword | Definition |
|---|---|
| Alpha-lactalbumin (α-Lactalbumin) | It is a protein that regulates the production of lactose in the milk of almost all mammalian species. |
| Amino acid | It is an organic compound that contains both amino and carboxylic acid functional groups, which are required for the synthesis of body protein and other important nitrogen-containing compounds, such as creatine, peptide hormones, and some neurotransmitters. |
| Blanching | It is the process of briefly heating vegetables with steam or boiling water. |
| BRC | British Retail Consortium |
| Bread improver | It is a flour-based blend of several components with specific functional properties designed to modify dough characteristics and give quality attributes to bread. |
| BSF | Black Soldier Fly |
| Caseinate | It is a substance produced by adding an alkali to acid casein, a derivative of casein. |
| Celiac disease | Celiac disease is an immune reaction to eating gluten, a protein found in wheat, barley, and rye. |
| Colostrum | It is a milky fluid that’s released by mammals that have recently given birth before breast milk production begins. |
| Concentrate | It is the least processed form of protein and has a protein content ranging from 40-90% by weight. |
| Dry protein basis | It refers to the percentage of "pure protein" present in a supplement after the water in it is completely removed through heat. |
| Dry whey | It is the product resulting from drying fresh whey which has been pasteurized and to which nothing has been added as a preservative. |
| Egg protein | It is a mixture of individual proteins, including ovalbumin, ovomucoid, ovoglobulin, conalbumin, vitellin, and vitellenin. |
| Emulsifier | It is a food additive that facilitates the blending of foods that are immiscible with one another, such as oil and water. |
| Enrichment | It is the process of addition of micronutrients that are lost during the processing of the product. |
| ERS | Economic Research Service of the USDA |
| Extrusion | It is the process of forcing soft mixed ingredients through an opening in a perforated plate or die designed to produce the required shape. The extruded food is then cut to a specific size by blades. |
| Fava | Also known as Faba, it is another word for yellow split beans. |
| FDA | Food and Drug Administration |
| Flaking | It is a process in which typically a cereal grain (like corn, wheat, or rice) is broken down into grits, cooked with flavors and syrups, and then pressed into flakes between cooled rollers. |
| Foaming agent | It is a food ingredient that makes it possible to form or maintain a uniform dispersion of a gaseous phase in a liquid or solid food. |
| Foodservice | It refers to the part of the food industry which includes businesses, institutions, and companies which prepare meals outside the home. It includes restaurants, school and hospital cafeterias, catering operations, and many other formats. |
| Fortification | It is the deliberate addition of micronutrients that are not found in them naturally or which are lost during processing, to improve a food product's nutritional value. |
| FSANZ | Food Standards Australia New Zealand |
| FSIS | Food Safety and Inspection Service |
| FSSAI | Food Safety and Standards Authority of India |
| Gelling agent | It is an ingredient that functions as a stabilizer and thickener to provide thickening without stiffness through the formation of gel. |
| GHG | Greenhouse Gas |
| Gluten | It is a family of proteins found in grains, including wheat, rye, spelt, and barley. |
| Hemp | It is a botanical class of Cannabis sativa cultivars grown specifically for industrial or medicinal use. |
| Hydrolysate | It is a form of protein manufactured by exposing the protein to enzymes that can partially break the bonds between the protein's amino acids and break down large, complicated proteins into smaller pieces. Its processing makes it easier and quicker to digest. |
| Hypoallergenic | It refers to a substance that causes fewer allergic reactions. |
| Isolate | It is the purest and most processed form of protein which has undergone separation to obtain a pure protein fraction. It typically contains ≥ 90% of protein by weight. |
| Keratin | It is a protein that helps form hair, nails, and the outer layer of skin. |
| Lactalbumin | It is the albumin contained in milk and obtained from whey. |
| Lactoferrin | It is an iron‑binding glycoprotein that is present in the milk of most mammals. |
| Lupin | It is the yellow legume seeds of the genus Lupinus. |
| Millenial | Also known as Generation Y or Gen Y, it refers to the people born from 1981 to 1996. |
| Monogastric | It refers to an animal with a single-compartmented stomach. Examples of monogastric include humans, poultry, pigs, horses, rabbits, dogs, and cats. Most monogastric are generally unable to digest much cellulose food materials such as grasses. |
| MPC | Milk protein concentrate |
| MPI | Milk protein isolate |
| MSPI | Methylated soy protein isolate |
| Mycoprotein | Mycoprotein is a form of single-cell protein, also known as fungal protein, derived from fungi for human consumption. |
| Nutricosmetics | It is a category of products and ingredients that act as nutritional supplements to care for skin, nails, and hair natural beauty. |
| Osteoporosis | It is a medical condition in which the bones become brittle and fragile from loss of tissue, typically as a result of hormonal changes, or deficiency of calcium or vitamin D. |
| PDCAAS | Protein digestibility-corrected amino acid score (PDCAAS) is a method of evaluating the quality of a protein based on both the amino acid requirements of humans and their ability to digest it. |
| Per-capita consumption of animal protein | It is the average amount of animal protein (such as milk, whey, gelatin, collagen, and egg proteins) that is readily available for consumption by each person in an actual population. |
| Per-capita consumption of plant protein | It is the average amount of plant protein (such as soy, wheat, pea, oat, and hemp proteins) that is readily available for consumption by each person in an actual population. |
| Quorn | It is a microbial protein manufactured using mycoprotein as an ingredient, in which the fungus culture is dried and mixed with egg albumen or potato protein, which acts as a binder, and then is adjusted in texture and pressed into various forms. |
| Ready-to-Cook (RTC) | It refers to food products that include all of the ingredients, where some preparation or cooking is required through a process that is given on the package. |
| Ready-to-Eat (RTE) | It refers to a food product prepared or cooked in advance, with no further cooking or preparation required before being eaten. |
| RTD | Ready-to-Drink |
| RTS | Ready-to-Serve |
| Saturated fat | It is a type of fat in which the fatty acid chains have all single bonds. It is generally considered unhealthy. |
| Sausage | It is a meat product made of finely chopped and seasoned meat, which may be fresh, smoked, or pickled and which is then usually stuffed into a casing. |
| Seitan | It is a plant-based meat substitute made out of wheat gluten. |
| Softgel | It is a gelatin-based capsule with a liquid fill. |
| SPC | Soy protein concentrate |
| SPI | Soy protein isolate |
| Spirulina | It is a biomass of cyanobacteria that can be consumed by humans and animals. |
| Stabilizer | It is an ingredient added to food products to help maintain or enhance their original texture, and physical and chemical characteristics. |
| Supplementation | It is the consumption or provision of concentrated sources of nutrients or other substances that are intended to supplement nutrients in the diet and is intended to correct nutritional deficiencies. |
| Texturant | It is a specific type of food ingredient that is used to control and alter the mouthfeel and texture of food and beverage products. |
| Thickener | It is an ingredient that is used to increase the viscosity of a liquid or dough and make it thicker, without substantially changing its other properties. |
| Trans fat | Also called trans-unsaturated fatty acids or trans fatty acids, it is a type of unsaturated fat that naturally occurs in small amounts in meat. |
| TSP | Textured soy protein |
| TVP | Textured vegetable protein |
| WPC | Whey protein concentrate |
| WPI | Whey protein isolate |


Research Methodology
Mordor Intelligence follows a four-step methodology in all our reports.
- Step-1: Identify Key Variables: The quantifiable key variables (industry and extraneous) pertaining to the specific product segment and country are selected from a group of relevant variables & factors based on desk research & literature review; along with primary expert inputs. These variables are further confirmed through regression modeling (wherever required).
- Step-2: Build a Market Model: In order to build a robust forecasting methodology, the variables and factors identified in Step-1 are tested against available historical market numbers. Through an iterative process, the variables required for market forecast are set and the model is built on the basis of these variables.
- Step-3: Validate and Finalize: In this important step, all market numbers, variables and analyst calls are validated through an extensive network of primary research experts from the market studied. The respondents are selected across levels and functions to generate a holistic picture of the market studied.
- Step-4: Research Outputs: Syndicated Reports, Custom Consulting Assignments, Databases & Subscription Platforms


