Market Overview
| Study Period | 2020 - 2031 |
|---|---|
| Forecast Data Period | 2026 - 2031 |
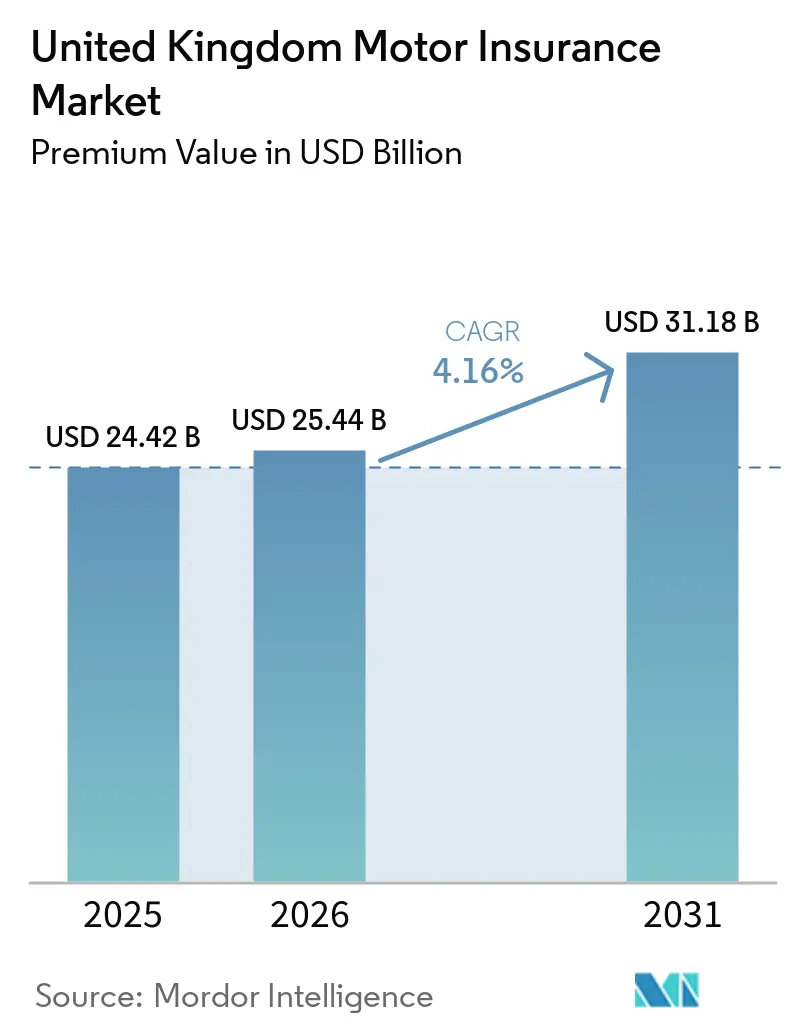
| Base Year Market Size (2025) | USD 24.42 Billion |
| Market Size (2026) | USD 25.44 Billion |
| Market Size (2031) | USD 31.18 Billion |
| Growth Rate (2026 - 2031) | 4.16% CAGR |
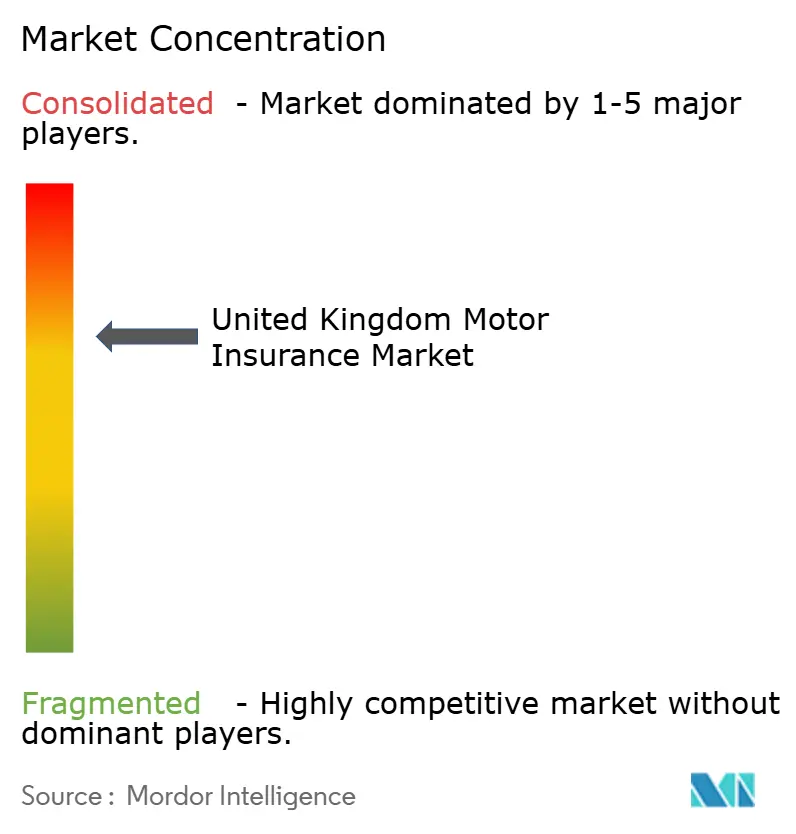
| Market Concentration | High |
Major Players *Disclaimer: Major Players sorted in no particular order Image © Mordor Intelligence. Reuse requires attribution under CC BY 4.0. | |
United Kingdom Motor Insurance Market Analysis by Mordor Intelligence
The United Kingdom Motor Insurance Market size in terms of premium value is projected to expand from USD 24.42 billion in 2025 and USD 25.44 billion in 2026 to USD 31.18 billion by 2031, registering a CAGR of 4.16% between 2026 to 2031.
Despite facing regulatory constraints on renewal pricing and an uptick in claims inflation, the UK motor insurance market is witnessing a steady rise in premiums. Insurers are feeling the pinch on profitability due to escalating vehicle repair costs, surging valuations of used cars, and a marked rise in claims related to electric vehicles (EVs). In response, they've begun recalibrating their underwriting strategies. Concurrently, the market is transforming: the growing use of telematics, intensified competition from digital direct providers, and a wave of consolidation among major insurers are reshaping the distribution of underwriting capacity across various coverage lines. These shifts herald a move towards data-centric pricing, sharper customer segmentation, and an amplified role of artificial intelligence in processing claims.
Key Report Takeaways
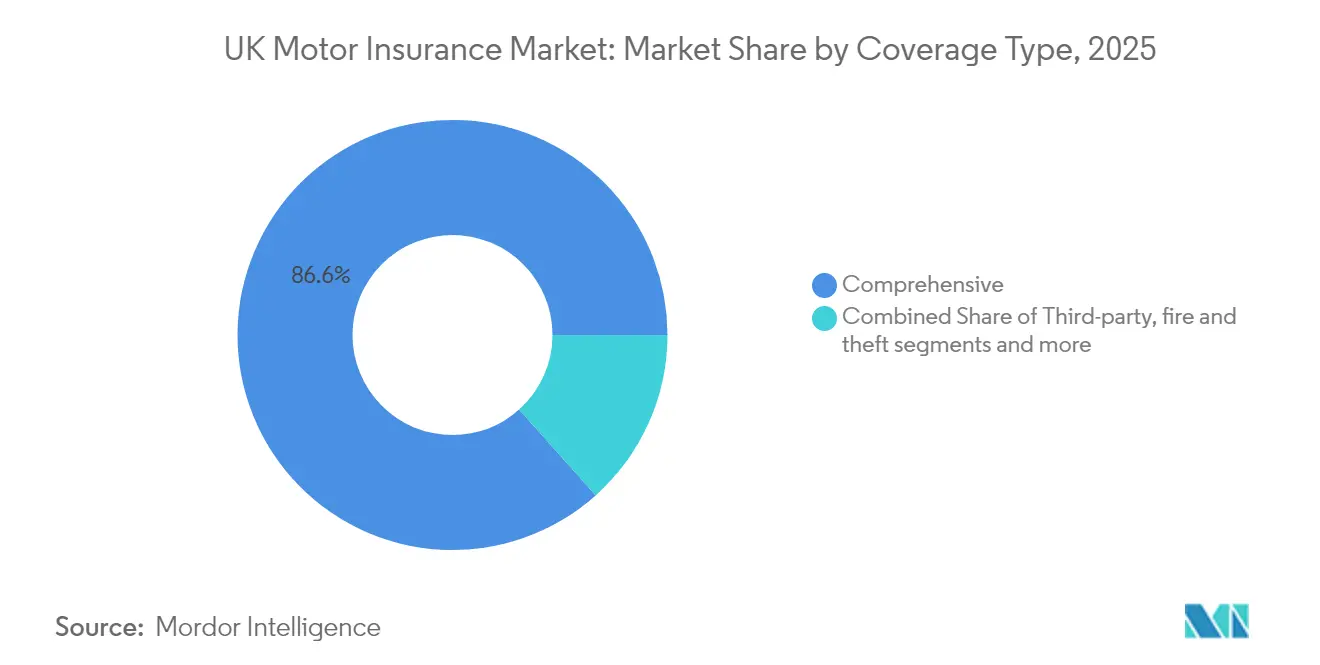
- By insurance coverage type, comprehensive policies commanded 86.60% of revenue in 2025, whereas third-party, fire, and theft coverage is forecast to expand at a 6.63% CAGR through 2031.
- By vehicle type, passenger cars accounted for 71.90% of the United Kingdom motor insurance market share in 2025, while commercial vehicles led growth with a projected 5.76% CAGR.
- By end user, individual motorists generated 81.50% of premiums in 2025; the commercial fleet segment is projected to advance at a 5.37% CAGR through 2031.
- By distribution channel, price-comparison websites controlled 54.70% of premium in 2025; direct digital channels are growing faster at a 7.18% CAGR.
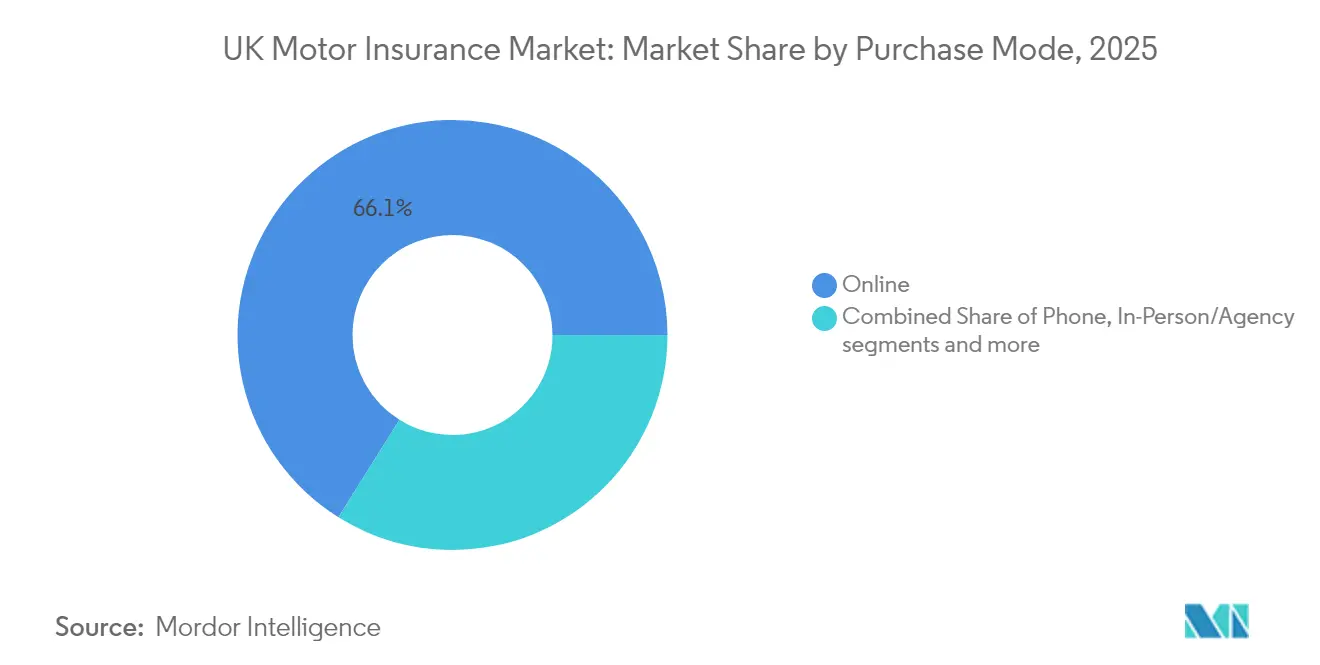
- By purchase mode, online transactions comprised 66.10% of premium in 2025 and will grow at a 7.65% CAGR.
- By technology, usage-based insurance is expanding at an 17.90% CAGR, even as traditional products hold 89.40% share.
- By geography, England dominated with an 82.30% share in 2025; Northern Ireland shows the strongest 4.22% CAGR outlook.
Note: Market size and forecast figures in this report are generated using Mordor Intelligence’s proprietary estimation framework, updated with the latest available data and insights as of 2026.
United Kingdom Motor Insurance Market Trends and Insights
Drivers Impact Analysis*
| Driver | (~) % Impact on CAGR Forecast | Geographic Relevance | Impact Timeline |
|---|---|---|---|
| Surge in used-car values elevating total-loss payouts | +1.8% | England, Scotland, Wales, Northern Ireland | Short term (≤ 2 years) |
| Growth of usage-based insurance through DVLA data and 5G telematics | +1.5% | England, Scotland, Wales, Northern Ireland | Medium term (2–4 years) |
| Rapid expansion of the EV parc driving specialized cover | +1.2% | England, Scotland, Wales, Northern Ireland | Long term (≥ 4 years) |
| Broader distribution via aggregators delivering >70% new business | +0.8% | England, Scotland, Wales, Northern Ireland | Short term (≤ 2 years) |
| Commercial fleet electrification mandates | +0.6% | England, Scotland, Wales, Northern Ireland | Medium term (2–4 years) |
| AI-enabled claims automation reducing expense ratios | +0.4% | England, Scotland, Wales, Northern Ireland | Medium term (2–4 years) |
| Source: Mordor Intelligence | |||
Surge in Used-Car Values Elevating Total-Loss Payouts and Premium Levels
Throughout 2024 and into early 2025, the United Kingdom motor insurance market felt the sting of surging used-car values. This spike not only inflated total-loss payouts but also prompted widespread adjustments in premiums. Data from EY highlights that in 2024, the uptick in vehicle valuations added GBP 68 to the average premium, pushing comprehensive coverage costs up by 12%. Concurrently, delays in repairs extended vehicle hire periods, amplifying hire-related expenses by 30%. As a result, comprehensive policy premiums averaged GBP 437, while third-party-only coverage saw a rise to GBP 591, driven by heightened risks of unrecoverable damage. While these dynamics have led to a short-term inflation in premiums, analysts predict a cooling off as the availability of new cars improves, potentially alleviating pricing pressures in the coming two years.
Growth of Usage-Based Insurance Fueled by DVLA Open Data & 5G Telematics
In UK, the adoption of usage-based insurance (UBI) is surging, fueled by the integration of cutting-edge 5G telematics and the open data access provided by the Driver and Vehicle Licensing Agency (DVLA). These advancements empower insurers to gather and assess real-time driving metrics, like braking patterns, acceleration tendencies, and contextual road information. Such insights feed into dynamic pricing models, promoting safer driving behaviors. As a result, telematics-based policies have witnessed a robust CAGR of 18.60%. Looking forward, as innovation in behavior-based underwriting continues, the competitive edge is set to favor insurers who prioritize and invest in data-driven capabilities.
Rapid Expansion of EV Parc in the United Kingdom Driving Specialized Motor Cover Demand
EVs represented 20% of new registrations in June 2024, and one in four new cars sold in November 2024 was electric[1]Department for Transport, “Industry Encouraged to Shape UK Transition to Zero Emission Vehicles,” gov.uk. Insurers report average EV premiums 25.5% higher than for petrol vehicles because battery packs raise repair complexity. Advances in fast-charging infrastructure and the reinstated 2030 petrol-diesel phase-out date reinforce long-term demand for specialist EV cover, including battery degradation and charging-station damage protection. The United Kingdom motor insurance market is therefore building EV-specific underwriting expertise to manage emerging loss patterns and protect profitability.
Broader Distribution via Aggregators Delivering Majority of New Business
In the United Kingdom motor insurance market, price-comparison websites are pivotal, driving growth and capturing 60% to 70% of new business premiums. This dominance forces insurers to engage with multiple aggregator panels to stay competitive. Direct Line's December 2024 decision to join these platforms underscores their strategic significance. While commission fees ranging from 15% to 25% strain margins, they boost quote volume, leading to better risk selection and enhanced underwriting efficiency. As aggregators solidify their role in customer acquisition, insurers are also channeling investments into direct-to-consumer avenues, aiming to regain control over distribution costs and safeguard profitability.
Restraints Impact Analysis*
| Restraint | (~) % Impact on CAGR Forecast | Geographic Relevance | Impact Timeline |
|---|---|---|---|
| FCA “fair value” pricing reforms restricting loyalty penalty | -1.2% | England, Scotland, Wales, Northern Ireland | Medium term (2–4 years) |
| Parts & labour cost inflation outpacing premium growth | -0.8% | England, Scotland, Wales, Northern Ireland | Short term (≤ 2 years) |
| Declining young-driver population and public-transport revival | -0.6% | England, Scotland, Wales, Northern Ireland | Long term (≥ 4 years) |
| Rising severity of cyber risk elevating reinsurance costs | -0.4% | England, Scotland, Wales, Northern Ireland | Long term (≥ 4 years) |
| Source: Mordor Intelligence | |||
FCA “Fair Value” Pricing Reforms Restricting Loyalty Penalty & Renewal Hikes
The Financial Conduct Authority's (FCA) "fair value" pricing reforms are reshaping the landscape of the United Kingdom motor insurance market. Starting January 2022, insurers could no longer charge renewing customers more than new ones for the same coverage, effectively abolishing the so-called loyalty penalty[2]Financial Conduct Authority, “PS21/11: General Insurance Pricing Practices – Amendments,” fca.org.uk. In retaliation, insurers hiked rates for new business, leading to an average premium increase of 40% from pre-reform levels. As the FCA's Consumer Duty takes full effect in July 2024, insurers must now showcase fair value across their entire product lineup. This not only tightens the reins on price optimization but also pivots the competitive spotlight from pricing strategies to superior service and customer experience.
Parts & Labor Cost Inflation Outpacing Premium Growth
Rising parts and labour costs are placing considerable strain on the United Kingdom motor insurance market, as claims inflation increasingly outpaces premium growth. In 2024, shortages of original equipment manufacturer (OEM) parts, rising labour rates, and extended repair timelines drove claims costs up by 5-10%. Electric vehicle (EV) repairs, which are often twice as expensive as those for traditional combustion-engine vehicles, have further intensified cost pressures. As a result, EY projects the market’s combined ratio will deteriorate to 101.6% in 2025, reversing from a profitable 93% in 2024. This shift underscores the growing financial squeeze insurers face between escalating claim expenses and limited ability to raise premiums due to regulatory and competitive constraints.
*Our forecasts treat driver/restraint impacts as directional, not additive. The impact forecasts reflect baseline growth, mix effects, and variable interactions.
Segment Analysis
By Insurance Coverage Type: Comprehensive Cover Retains Primacy but Pricing Tensions Persist
Comprehensive policies generated 86.60% of the 2025 premium, demonstrating consumers’ desire for full protection even amid rate hikes. The United Kingdom motor insurance market size for comprehensive products will expand at a 3.84% CAGR through 2031. While prices climbed sharply in 2024, digital-first carriers now offer tiered levels within comprehensive cover, pairing repair-network limitations with telematics discounts that soften price shocks.
Third-party, fire, and theft policies remain a limited share, yet their 6.63% CAGR outpaces the market. Uptake is notable among cost-sensitive younger drivers and in high-premium urban postcodes. Insurers employ refined rating factors to control exposure, allowing them to price competitively while maintaining adequate reserves against rising bodily injury claims.


By Vehicle Type: Electrification Reshapes Risk Pools
Passenger cars accounted for 71.90% of premiums in 2025. The United Kingdom motor insurance market continues to rely on this cornerstone, yet a rising proportion of EVs complicates parts-supply forecasting and cost-of-repair modelling. Claims data confirm EV repairs are 25.5% costlier and slower, challenging actuaries to reflect the new severity curve.
Commercial vehicles are the fastest-growing cohort, advancing at a 5.76% CAGR. Fleet electrification mandates amplify coverage needs for battery electric vans used in parcel logistics, expanding premium pools. Specialty carriers prepare multi-vehicle programs covering mixed fleets during the transition phase, using telematics mileage data to align pricing with utilization.
By End User: Commercial Fleets Lead Digital Adoption
Individual motorists delivered 81.50% of written premiums in 2025, but face ongoing volatility from supply-chain-driven repair costs. Smartphone-based scoring apps offer policyholders concrete premium relief for safe driving, and FCA guidance on fair-value assessments promotes the wider rollout of such incentive schemes.
Commercial fleets, projected to grow at a 5.37% CAGR, showcase intensive telematics usage. Seventy-two percent of fleets report crash reductions after telematics installation, with a quarter recording a premium decrease. Insurers refine dashboards that combine battery-health diagnostics and driver coaching, extending the United Kingdom motor insurance industry’s influence on operational risk management.
By Distribution Channel: Digital Direct Chisels at Aggregator Dominance
Aggregators control 54.70% of premium and remain a defining feature of the United Kingdom motor insurance market. High quote volumes and transparent comparison reduce transaction friction but suppress margins. To rebalance the cost equation, carriers strengthen branded portals, offering loyalty benefits that sit within the FCA value framework guidelines.
Direct digital sales, growing at 7.18% CAGR, deliver ownership of customer data and lower acquisition costs. Investments in conversational AI improve quote accuracy, while single-sign-on portals encourage cross-selling of home and pet cover, spreading acquisition costs across multiple products.
By Purchase Mode: Online Journey Becomes the Norm
Online purchases captured 66.10% of premium in 2025 and are projected to rise at a 7.65% CAGR, taking advantage of consumer comfort with self-service. The United Kingdom motor insurance market size attributable to online sales is expected to surpass USD 21.6 billion by 2031. Embedded insurance, offered at the point of vehicle sale or financing, is gaining traction and could claim a 10-15% share of new policies within the decade.
Phone-based channels still serve non-standard risks and older demographics. Although they represent a shrinking slice, carriers maintain staffed call centers to preserve service differentiation under FCA fairness obligations.
By Technology: Telematics Disrupts Conventional Rating
Traditional rating models retain 89.40% share, but regulatory expectations on fair value challenge reliance on inertia pricing. Telematics, expanding at 17.90% CAGR, offers dynamic premiums that better reflect observed driving. Pay-per-mile propositions suit low-mileage commuters in metropolitan areas, while EV-specific programs bundle wall-box charger protection into premium calculations.
The growing depth of telematics data enables predictive maintenance alerts that prevent accidents, ultimately lowering claim frequency. Such benefits enhance policyholder retention and feed the virtuous cycle of improved underwriting.
By Claims Type: Liability Severities Outpace Own-Damage Frequencies
Third-party liability represented 59.60% of claims costs in 2025. A 23% increase in personal injury awards in 2024 raised average settlement values. Meanwhile, ADAS-equipped models such as the Volkswagen Golf 7 report 45% fewer third-party injury claims, demonstrating technology’s role in future loss-cost moderation.
Own-damage claims grow at a 5.88% CAGR because technologically rich vehicles require specialized parts and calibration. The United Kingdom motor insurance market adjusts premiums to reflect higher ADAS repair costs, yet carriers leverage salvage-parts programs and approved-repairer networks to slow severity escalation.
Geography Analysis
England generated 82.30% of the written premium in 2025, reflecting its larger population and higher vehicle density. Inner London recorded the UK’s costliest average premium at GBP 1,501, a 41% year-on-year rise, whereas the Southwest averaged GBP 358, illustrating a 76% regional premium spread. Consolidation, such as Aviva’s purchase of Direct Line, is expected to intensify competition for profitable city postcodes.
Northern Ireland, while smaller, shows the highest 4.22% CAGR outlook. Average comprehensive premiums reached GBP 834 in early 2025, though quarterly figures revealed the sharpest decline among all regions, hinting at competitive rebalancing. Improved pricing transparency via digital channels could alleviate historic premium disparities, encouraging new entrants to expand geographically.
Scotland and Wales illustrate varied risk profiles. Premiums in Central Scotland climbed 52% in early 2025 to GBP 871, reflecting higher repair costs along the busy central belt. Conversely, slower traffic and improved road safety measures in rural Wales support lower frequency and modest premiums. Upcoming government reviews on rating fairness may harmonize methodologies and narrow regional differentials over the forecast horizon, promoting balanced premium growth across the United Kingdom motor insurance market.
Competitive Landscape
The top ten market players hold the majority of premiums in 2024, pointing to moderate concentration. The Aviva–Direct Line merger, currently under CMA review, will create the largest player, reshaping market dynamics and sparking renewed focus on technological investments[3]Insurance Journal, “Aviva’s £3.7 Billion Direct Line Deal Faces UK Merger Review,” insurancejournal.com.
Technology is the principal competitive lever. Carriers deploying AI-driven triage models report claims cost reductions up to 20%, allowing price-competitive offers without eroding margins. Challenger brands such as Marshmallow, By Miles, and Zego leverage cloud-native systems to underwrite niche segments—overseas license holders, pay-per-mile commuters, and gig-economy couriers—forcing incumbents to accelerate innovation cycles.
Scale economies remain critical. The merged Aviva entity targets GBP 200 million in annual synergies via procurement leverage and de-duplicated IT infrastructure. Mid-tier carriers pursue bolt-on acquisitions or affinity partnerships with auto manufacturers and mobility platforms to deepen distribution reach and enhance data access, reinforcing competitive positioning in the United Kingdom motor insurance market
United Kingdom Motor Insurance Industry Leaders
Admiral Group plc
Aviva plc
Direct Line Insurance Group plc
Hastings Group Holdings
AXA UK plc
- *Disclaimer: Major Players sorted in no particular order

Recent Industry Developments
- May 2025: Aviva plc’s GBP 3.7 billion Direct Line Insurance Group deal entered CMA review; decision expected by 10 July 2025.
- April 2025: Zurich Insurance plc partnered with Insurtech Ominimo to roll out AI-powered car insurance across Europe.
- March 2025: The government reinstated the 2030 petrol-diesel sales ban to support the zero-emission transition
- December 2024: Direct Line Insurance Group launched car insurance on comparison websites after years of resistance


Research Methodology Framework and Report Scope
Market Definitions and Key Coverage
Mordor Intelligence defines the United Kingdom motor insurance market as the total gross written premiums generated from compulsory third-party liability and all voluntary covers (comprehensive, collision, fire-and-theft, and usage-based products) issued for on-road passenger cars, motorcycles, light commercial vans, and heavy goods vehicles registered in the UK.
Scope exclusion: Stand-alone roadside assistance contracts and extended vehicle warranties remain outside this study.
Segmentation Overview
- By Insurance Coverage Type
- Third-Party Only (TPO)
- Third-Party, Fire & Theft (TPFT)
- Comprehensive
- By Vehicle Type
- Passenger Cars
- Commercial Vehicles
- Motorcycles
- Others (Classic & Specialty)
- By End-User
- Individual
- Commercial / Fleet
- By Distribution Channel
- Direct / Digital Direct
- Insurance Brokers
- Price Comparison Websites / Aggregators
- Bancassurance & Affinity Partners
- By Purchase Mode
- Online
- Phone
- In-Person / Agency
- By Technology
- Traditional Policies
- Usage-Based Insurance (Telematics)
- Pay-Per-Mile
- EV-Specific Cover
- By Claims Type
- Own Damage
- Third-Party Liability
- By Geography
- England
- Scotland
- Wales
- Northern Ireland
Detailed Research Methodology and Data Validation
Primary Research
Structured interviews and short surveys with underwriting executives, broker networks, claims suppliers, body-shop groups, telematics providers, and actuarial consultants across England, Scotland, Wales, and Northern Ireland help us validate assumptions on premium dynamics, claims inflation, EV repair costs, and policy-holder behavior. Feedback fills residual gaps and calibrates scenario inputs.
Desk Research
Our analysts start with official, freely available data such as the Association of British Insurers' premium tracker, FCA multi-firm reviews, DVLA vehicle-parc counts, SMMT new-registration reports, Office for National Statistics repair-cost indices, and OECD non-life premium trends. Company filings, investor presentations, and trade-press archives complement these sources. Where firm-level financials are required, D&B Hoovers and Dow Jones Factiva provide audited numbers. This list is illustrative; many additional publications support data collection, cross-checks, and clarification.
Market-Sizing & Forecasting
A top-down and bottom-up blended model is deployed. National premium pools from ABI and FCA form the spine, which is then validated through selective bottom-up roll-ups of leading insurers' reported shares and average premium × policy calculations. Key variables, including vehicle-parc growth, average premium movement, Ogden rate changes, EV share of registrations, telematics policy penetration, and claims severity inflation, feed a multivariate regression that generates the base-year value and an outlook for the forecast period. Where granular data are missing, statistically significant proxies such as repair-cost CPI or battery replacement indices are applied and re-benchmarked during expert calls.
Data Validation & Update Cycle
Outputs undergo variance checks against external market ratios and historical underwriting cycles before internal peer review. Models refresh each year, with interim tweaks triggered by material events (e.g. large mergers or regulatory shifts). A final sense-check is completed just prior to report release so clients receive the most current view.
Why Mordor's United Kingdom Motor Insurance Baseline Earns Stakeholder Trust
Published figures often diverge because firms mix personal and commercial lines differently, apply varied currency conversions, or lock forecasts to outdated claim-cost curves. Our disciplined scoping, annual refresh cadence, and variable transparency keep our numbers repeatable and decision-ready.
Benchmark comparison
| Market Size | Anonymized source | Primary gap driver |
|---|---|---|
| USD 24.42 bn (2025) | Mordor Intelligence | - |
| USD 29.30 bn (2024) | Regional Consultancy A | Includes ancillary products and fleet warranty add-ons, uses list-price premiums without IPT adjustments |
| USD 27.33 bn (2024) | Global Consultancy B | Combines personal motor with motorcycle specialty lines and applies constant 2023 FX rates |
| USD 26.14 bn (2024) | Industry Journal C | Excludes Northern Ireland and models EV premiums using global, not UK-specific, repair cost multipliers |
Differences show that scope creep, currency treatment, and cost assumptions can inflate totals by several billion dollars. Mordor Intelligence provides a balanced, transparent baseline tied to clear variables and repeatable steps, giving stakeholders a dependable platform for strategic choices.


Key Questions Answered in the Report
What is the forecast value of the UK motor insurance market in 2031?
It is projected to reach USD 31.18 billion by 2031, growing at a 4.16% CAGR.
Why are premiums for electric vehicles higher than for petrol cars?
EV repairs involve costly battery components and specialist labor, raising average claim severity and driving premiums 25.5% higher than conventional vehicles.
How will the Aviva-Direct Line merger influence pricing?
The combined 20% market share should deliver procurement and IT synergies, enabling sharper pricing and intensifying competition for profitable urban postcodes.
Which distribution channel is growing fastest?
Direct digital sales are expanding at a 7.18% CAGR as insurers seek to reduce aggregator commission costs and cultivate closer customer relationships.
Page last updated on:


