Qatar Transportation Infrastructure Construction Market Size and Share
Market Overview
| Study Period | 2020 - 2031 |
|---|---|
| Base Year For Estimation | 2025 |
| Forecast Data Period | 2026 - 2031 |
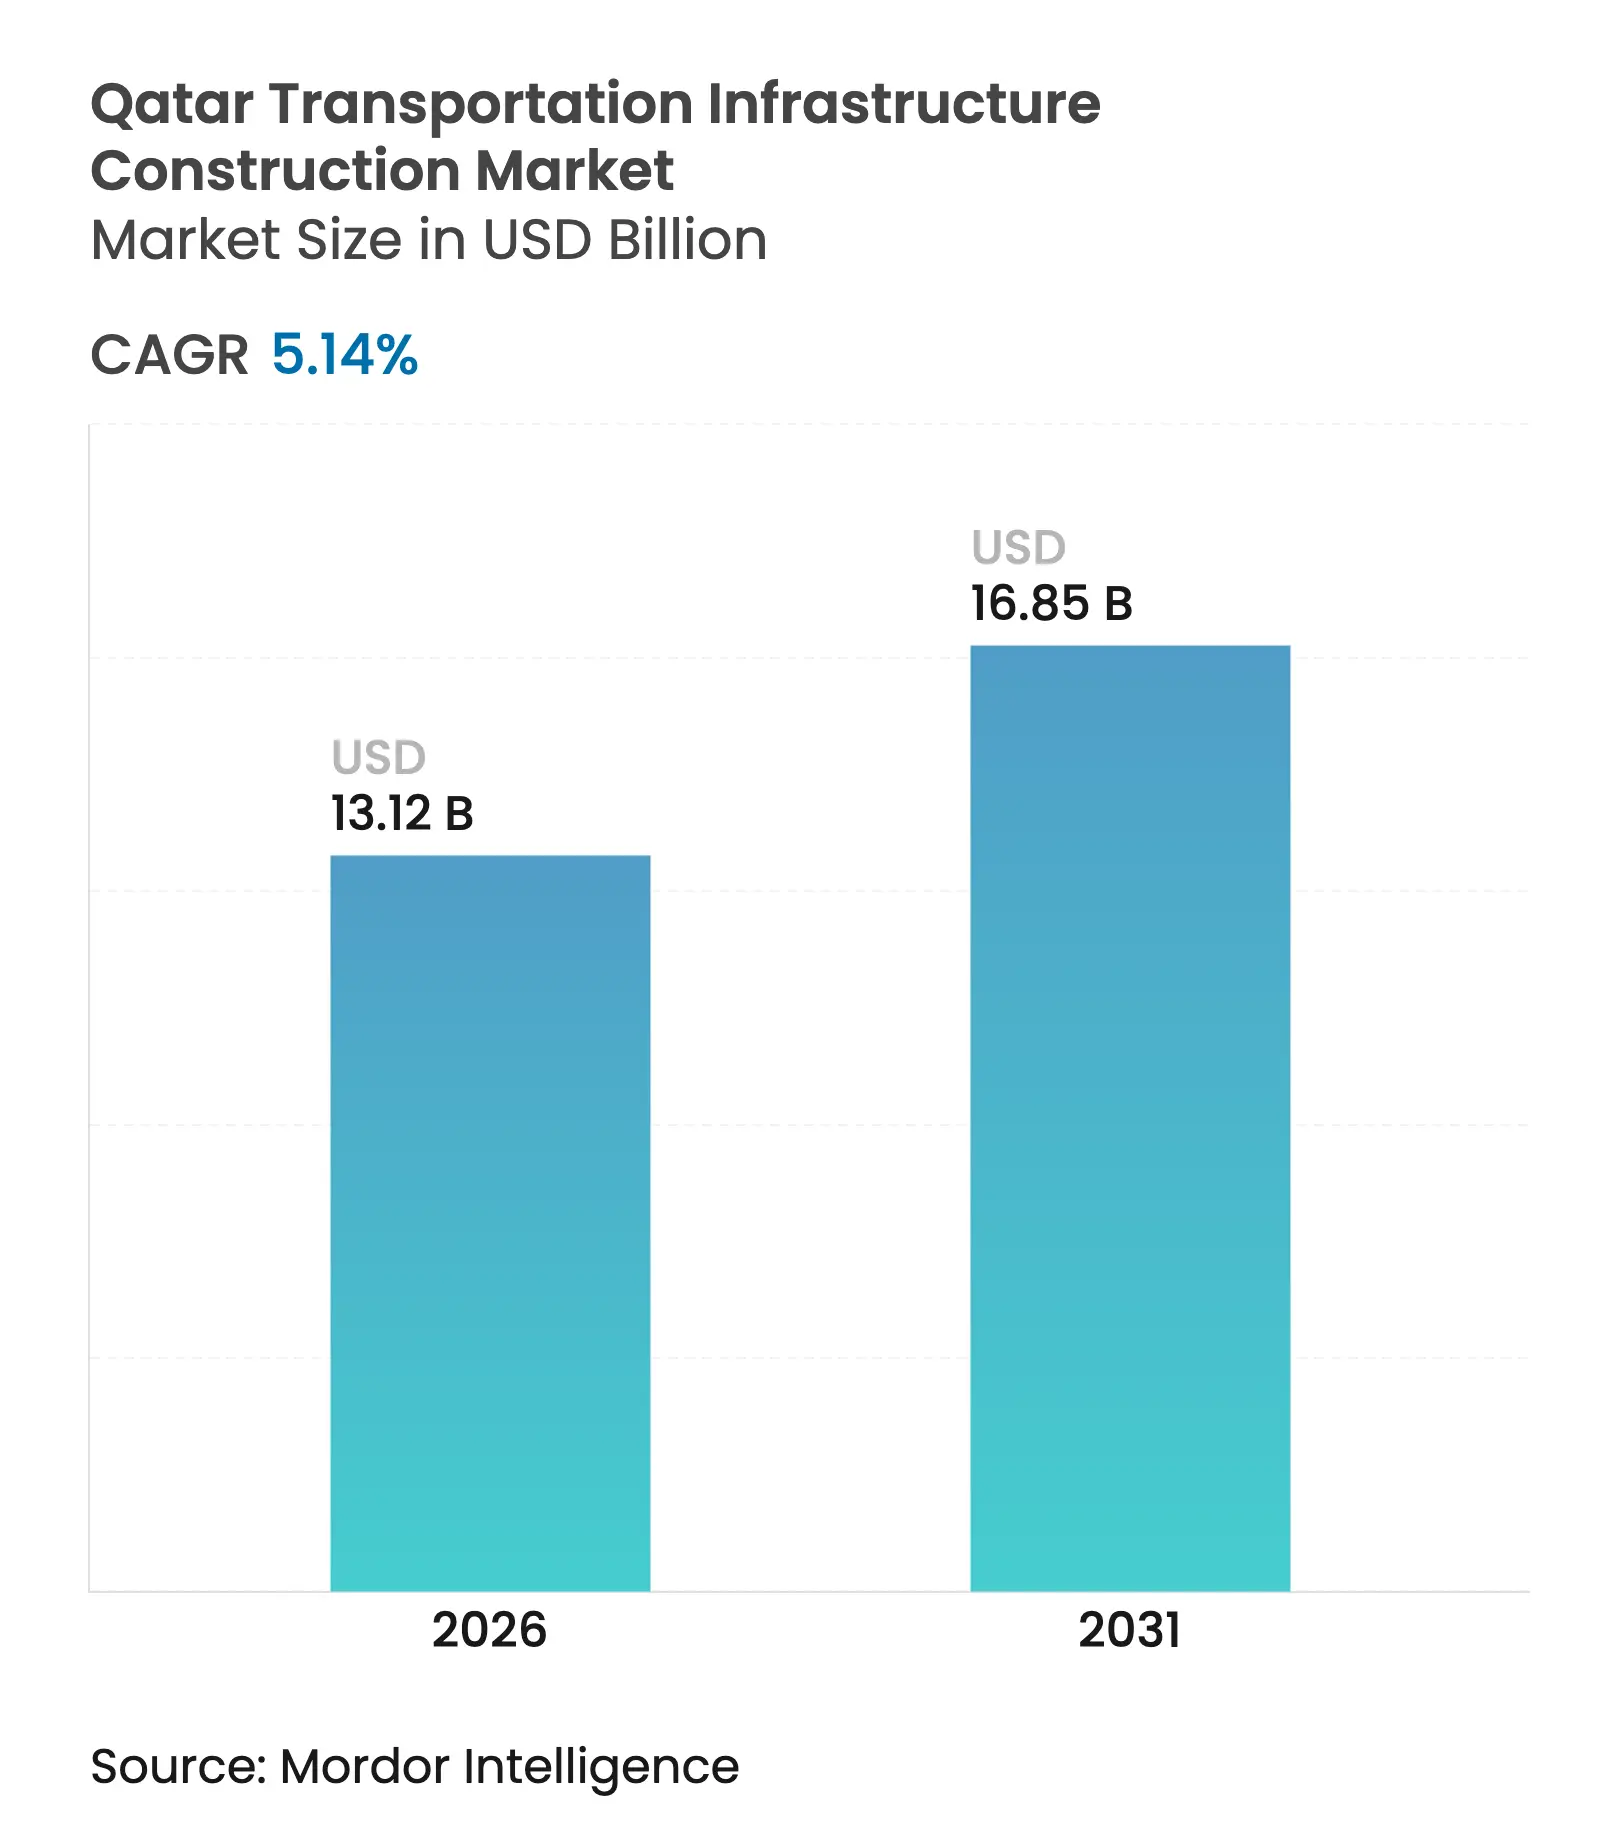
| Market Size (2026) | USD 13.12 Billion |
| Market Size (2031) | USD 16.85 Billion |
| Growth Rate (2026 - 2031) | 5.14 % CAGR |
| Market Concentration | Low |
Major Players *Disclaimer: Major Players sorted in no particular order. Image © Mordor Intelligence. Reuse requires attribution under CC BY 4.0. |
Qatar Transportation Infrastructure Construction Market Analysis by Mordor Intelligence
The Qatar Transportation Infrastructure Construction Market size is expected to grow from USD 12.48 billion in 2025 to USD 13.12 billion in 2026 and is forecast to reach USD 16.85 billion by 2031 at 5.14% CAGR over 2026-2031. Qatar’s Third National Development Strategy and Ashghal’s unprecedented USD 22.2 billion five-year plan underpin this steady expansion, pivoting capital from World Cup legacy assets into long-term connectivity investments.[1]Qatar News Agency, “Ashghal Launches USD 22.2 Billion Five-Year Infrastructure Plan” Robust public funding merges with rising private-sector participation, while smart-city mandates weave digital layers into physical assets, sharpening project efficiency and sustainability. Material-cost volatility and skilled-labour shortages remain cost and schedule risks, yet sovereign wealth support and green-bond financing blunt these pressures and open pathways for climate-aligned construction.
Key Report Takeaways
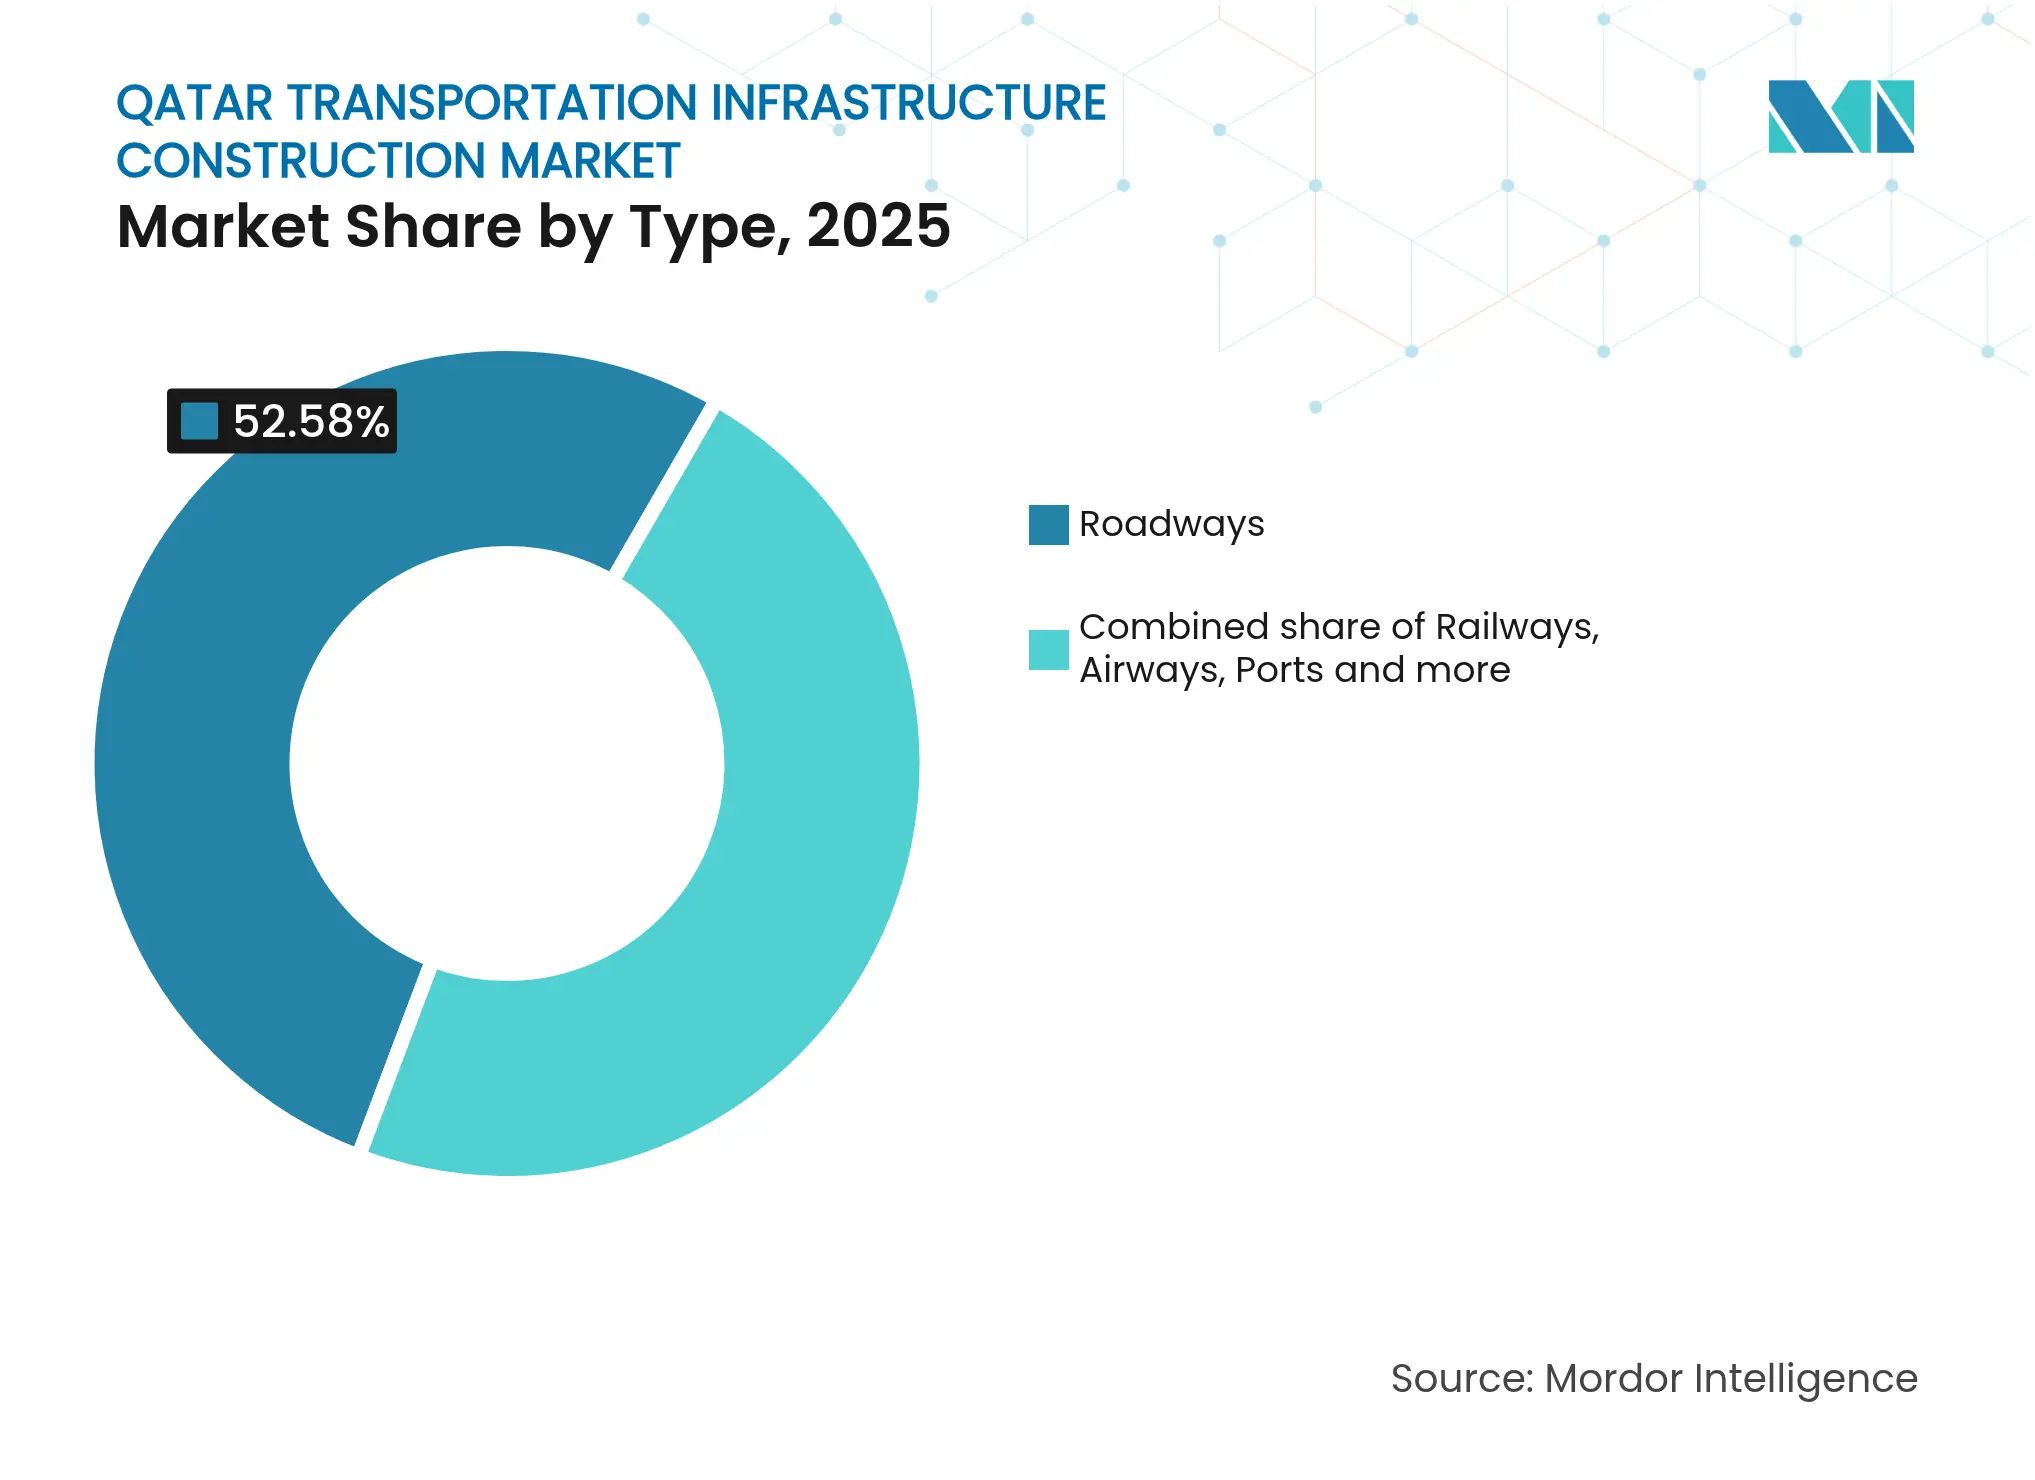
- By type, roadways commanded 52.58% of the Qatar transportation infrastructure construction market share in 2025; railways are forecast to expand at a 6.06% CAGR through 2031 Ministry of Transport.
- By construction type, new construction captured 81.35% of the Qatar transportation infrastructure construction market size in 2025, while renovation tracks a 5.06% CAGR to 2031 Qatar News Agency.
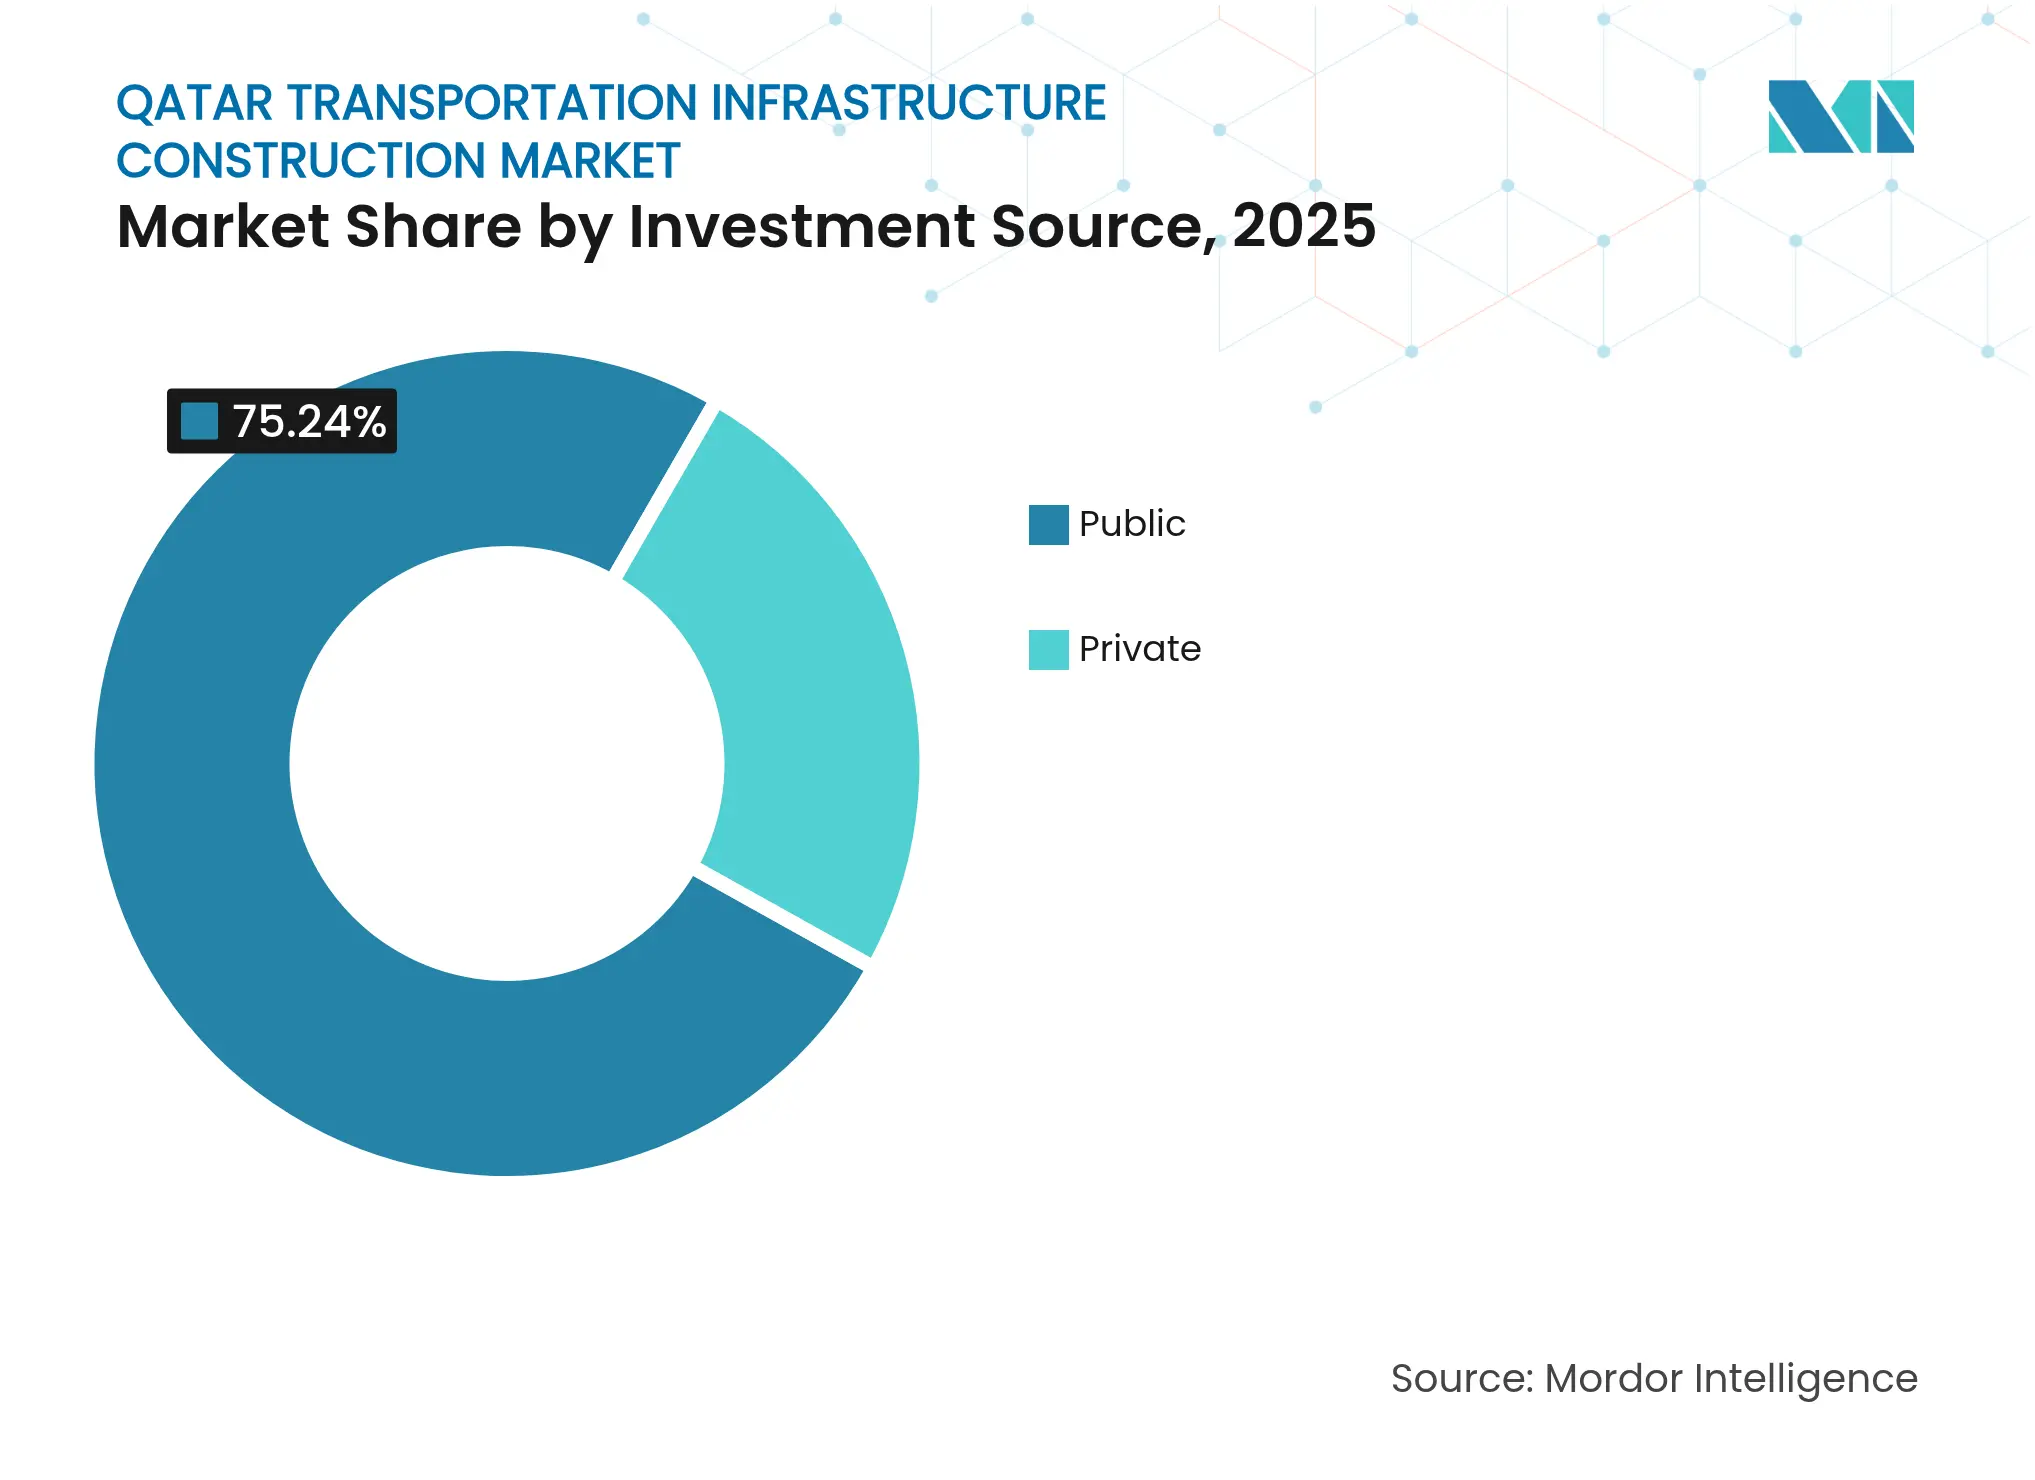
- By investment source, public outlays held 75.24% of the Qatar transportation infrastructure construction market share in 2025; private capital is advancing at a 5.91% CAGR to 2031 Aninver.
- By city, Doha retained 44.62% of market activity in 2025, whereas Al Daayen is the fastest-growing locality with a 6.02% CAGR through 2031.
Note: Market size and forecast figures in this report are generated using Mordor Intelligence's proprietary estimation framework, updated with the latest available data and insights as of 2026.
Qatar Transportation Infrastructure Construction Market Trends and Insights
Drivers Impact Analysis
| Driver | (~) % Impact on CAGR Forecast | Geographic Relevance | Impact Timeline | |||
|---|---|---|---|---|---|---|
Urban mobility push integrating metro and multimodal transit Urban mobility push integrating metro and multimodal transit | +1.2% | Doha, Lusail, Al Rayyan | Medium term (2-4 years) | (~) % Impact on CAGR Forecast:+1.2% | Geographic Relevance:Doha, Lusail, Al Rayyan | Impact Timeline:Medium term (2-4 years) |
Transit-oriented development (TOD) synergies Transit-oriented development (TOD) synergies | +0.8% | Doha, Lusail, Al Daayen | Long term (≥ 4 years) | |||
National expressway and road upgrade programs National expressway and road upgrade programs | +1.0% | National, focus on northern corridors | Short term (≤ 2 years) | |||
Major aviation infrastructure investments Major aviation infrastructure investments | +0.7% | Doha, spillover to Al Rayyan | Medium term (2-4 years) | |||
| Source: Mordor Intelligence | ||||||
Urban mobility push integrating metro and multimodal transit
The opening of the Lusail Tram Turquoise Line in January 2025 closed the loop on a 19 km, 25-station network that synchronises seamlessly with the 37-station Doha Metro. Together, these systems give 91.7% of residents convenient public-transport access, the highest rate in MENA, and rank Doha among the global leaders in network density.[2]Ministry of Transport, “Doha Metro and Lusail Tram Integration Milestones” Full bus-fleet electrification targeted for 2030 spurs construction of depots and charging hubs, enlarging the Qatar transportation infrastructure construction market. Future metro extensions, including the Blue Line, will require deep-tunnel know-how and station overhauls, attracting contractors with rail mechanisation expertise. The broad shift toward multimodal nodes is also catalysing commercial leasing, as Qatar Rail begins retail tenders across 12 stations.
Transit-oriented development (TOD) synergies
Lusail City’s USD 250 billion development pipeline shows how TOD raises land values and amplifies ridership, with covered walkways and climate-adapted public realms supporting year-round footfall. A USD 60 million smart-city platform awarded to ST Engineering layers AI-driven monitoring across utilities, traffic, and security, demonstrating that digital infrastructure is now inseparable from concrete and steel. TOD increases non-fare revenue through integrated parking, pedestrian bridges, and mixed-use towers, enlarging the Qatar transportation infrastructure construction market beyond traditional civils. The approach blends cultural motifs and thermal comfort measures—such as shaded corridors—positioning TOD as both a mobility and placemaking strategy.
National expressway and road upgrade programs
Over 200 new bridges and 30 tunnels are slated under the Ministry of Transport’s highway plan, incorporating smart signalling and electric-vehicle chargers. Northern works around Al Daayen worth USD 81.7 million are already enhancing links to Al Bayt Stadium.[3]Public Works Authority, “Road Development Projects in Northern Municipalities” Designs must align with the planned GCC Railway, forcing sophisticated grade separations and multimodal hubs that widen the Qatar transportation infrastructure construction market. Road upgrades also target 6.6% logistics-sector GDP growth by 2030, embedding IoT sensors for asset monitoring that reduce lifecycle costs.
Major aviation infrastructure investments
Hamad International Airport finished Concourses D and E in March 2025, lifting capacity to 65 million passengers and adding 17 contact gates. GSAS 4-Star and LEED Gold targets required low-carbon materials and high-efficiency MEP systems, sharpening demand for specialised contractors. Cargo-facility expansion aligns with e-commerce growth, while biometric boarding systems drive civil-and-IT integration skills into the Qatar transportation infrastructure construction industry. The airport’s early-delivery record strengthens confidence across upcoming terminal and runway projects.
Restraints Impact Analysis
| Restraint | (~) % Impact on CAGR Forecast | Geographic Relevance | Impact Timeline | |||
|---|---|---|---|---|---|---|
Persistent imported material cost inflation Persistent imported material cost inflation | -1.1% | National, higher impact in Doha and Lusail | Short term (≤ 2 years) | (~) % Impact on CAGR Forecast:-1.1% | Geographic Relevance:National, higher impact in Doha and Lusail | Impact Timeline:Short term (≤ 2 years) |
Skilled labour shortages in specialised transport works Skilled labour shortages in specialised transport works | -0.9% | National, acute in Al Daayen projects | Medium term (2-4 years) | |||
Geopolitical risks dampening long-term foreign investment Geopolitical risks dampening long-term foreign investment | -0.6% | National, affects international contractors | Long term (≥ 4 years) | |||
| Source: Mordor Intelligence | ||||||
Persistent imported material cost inflation
Global steel and cement prices remain volatile, with external variables explaining 41% of cost variance for Qatari projects. Ashghal unlocked USD 5.8 billion in sector support and launched an In-Country Value program to expand local sourcing. Contractors now favour fixed-volume supply contracts and early material procurement, but PPP bids still price in inflation risk, moderating the Qatar transportation infrastructure construction market’s margin outlook. A proposed national materials index could stabilise budgeting yet awaits formal adoption.
Skilled labour shortages in specialised transport works
Underground rail builds, smart-city systems, and high-spec aviation facilities need advanced skills in limited supply. Contractor financial stress, cited as the main delay trigger, often traces to premium wage outlays for scarce experts. Government inclusion schemes target basic upskilling for 1.5 million migrant workers, but complex tunnelling and systems-integration know-how still rely on expatriates. Visa-processing bottlenecks and pandemic-era attrition keep competition for talent tight, curbing growth momentum in the Qatar transportation infrastructure construction market during peak rollout years.
Segment Analysis
By Type: Roadways Anchor Demand While Railways Accelerate
Roadways captured 52.58% of the Qatar transportation infrastructure construction market share in 2025, reflecting ongoing expressway upgrades and an 8,500 km network in perpetual maintenance. Investment continues into smart lanes, high-capacity interchanges, and EV-charging corridors that widen the asset’s lifespan and lower congestion. Contractors experienced in phased traffic management find consistent workloads as Doha and northern municipalities retrofit junctions for increased urbanisation.
The rail segment, though smaller, is the fastest-growing with a 6.06% CAGR outlook to 2031 thanks to the GCC Railway and domestic metro extensions. Rolling-stock orders, CBTC signalling, and underground station complexes heighten capital intensity per route-kilometre, expanding the Qatar transportation infrastructure construction market size at the project level. Cross-segment synergies emerge as stations trigger mixed-use retail, driving design-build-operate-maintain contracts. International specialists in bored-tunnel drives and platform screen doors are partnering local firms to meet Qatar Rail’s localisation quotas.
Note: Segment shares of all individual segments available upon report purchase
By Construction Type: New Builds Dominate but Renovations Scale Up
New builds held 81.35% of the Qatar transportation infrastructure construction market share in 2025, buoyed by Ashghal’s USD 22.2 billion five-year plan and Lusail’s greenfield pipeline. Massive plot-servicing in citizens’ lands, new wastewater alignments, and expressway loops continue to reward firms with large equipment fleets and megaproject coordination capacity.
Renovation and retrofit work grows in parallel at a 5.06% CAGR through 2031. Upgrading older highways with ITS, re-roofing metro stations for energy efficiency, and LEED-driven terminal refurbishments diversify revenue streams across the Qatar transportation infrastructure construction industry. Modular building and 3D printing piloted in the PPP schools programme reduce schedule risk and signal a broader pivot to industrialised construction methods.
By Investment Source: Public Capital Leads, Private Funding Gains Traction
Public spending supplied 75.24% of the Qatar transportation infrastructure construction market size in 2025, with sovereign wealth flows ensuring continuity across strategic assets. Large-scale allocations shelter the pipeline from commodity downturns and geopolitical shocks, keeping bid calendars predictable for tier-one contractors.
Private finance, projected to expand at 5.91% CAGR to 2031, is energised by the PPP Law 12/2020 and the USD 2.5 billion green-bond debut. Concession models covering schools, wastewater, and parking structures now extend to transit-adjacent retail and logistics parks. Long-tenor availability payments reassure lenders, fuelling wider participation and enlarging the Qatar transportation infrastructure construction market.
Note: Segment shares of all individual segments available upon report purchase
Geography Analysis
The Qatar transportation infrastructure construction market is geographically concentrated yet gradually dispersing. Doha, with a 44.62% slice in 2025, remains the anchor due to its airport expansion, metro densification, and core government districts. Continuous refurbishment of arterial roads and utility corridors keeps a steady stream of civil packages alive. Adjacent Al Rayyan capitalises on population spillovers and World Cup infrastructure, while maintaining stable demand for residential arterials and feeder bus facilities.
Northward, Al Daayen enjoys the fastest 6.02% CAGR trajectory as highway interchanges, rail alignments, and logistics estates converge there. Its proximity to Saudi gateways and the industrial North Field fuels demand for heavy-haul roads and intermodal yards. Lusail, built from scratch, embeds ICT frameworks and climate-responsive architecture, embodying the state’s turn toward integrated digital-physical assets. Port-centric southern and western zones concentrate on LNG expansion works and bulk-cargo berths, sustaining marine and heavy-civil opportunities despite their distance from metropolitan hubs.
Regionally, connectivity upgrades position Qatar as a central Gulf node despite supply-chain headwinds. Overland links into the GCC Railway, augmented by smart-port and chilled-warehouse builds, underpin Doha’s aspiration for 6.6% logistics GDP growth by 2030. Collectively, these projects propagate demand across the broader Qatar transportation infrastructure construction market, distributing workloads to secondary cities and rural industrial clusters.

Reports are available across multiple geographies.
Gain in-depth market insights across regions to support informed decisions.
Competitive Landscape
Market Concentration
International majors and capable domestic players—such as Qatar Rail, Ashghal, HBK Contracting Company W.L.L, Qatari Diar, and Midmac Contracting Company W.L.L—shape a moderately fragmented arena. Larsen & Toubro’s USD 4 billion offshore compression award showcases how scale and EPC prowess win mega-contracts. Consolidated Contractors Company leverages LNG experience to lock in brownfield packages, while Webuild and Bouygues chase tunnelling and viaduct lots that align with core competencies.
Digital-forward bidding increasingly separates leaders from laggards. ST Engineering’s smart-city platform for Lusail illustrates how OT-IT fusion can unlock new revenue layers.[4]Smart Cities World, “ST Engineering Wins Lusail Smart City Platform Deal” Domestic incumbents HBK Contracting and Midmac Contracting protect local share through agile mobilisation, government rapport, and GSAS-credentialed teams, but now invest in BIM and drone surveying to stay relevant.
Supply-chain resilience and green-construction pedigrees rise in tender scoring. More than 2,400 Qatari projects have attained GSAS ratings, compelling firms to field low-carbon concrete mixes and energy-efficient MEP systems. Consortium structures balancing offshore technology providers with local subcontractors have become customary to meet localisation quotas and mitigate import risks, subtly lifting the competitive bar across the Qatar transportation infrastructure construction market.
Qatar Transportation Infrastructure Construction Industry Leaders

*Disclaimer: Major Players sorted in no particular order
Recent Industry Developments
- May 2025: Hamad International Airport completed Concourses D & E, boosting capacity to 65 million passengers.
- May 2025: Larsen & Toubro won a USD 4 billion QatarEnergy offshore compression EPC contract.
- January 2025: Qatar Officially Inaugurates the Lusail Tram Turquoise Line, Marking the Completion of the 19-Kilometre Urban Transit Network.
- January 2025: Qatar Successfully Issues USD 2.5 Billion Green Bond to Advance National Sustainable Infrastructure Initiatives.
Table of Contents for Qatar Transportation Infrastructure Construction Industry Report
1. Introduction
- 1.1Study Assumptions & Market Definition
- 1.2Scope of the Study
2. Research Methodology
3. Executive Summary
4. Market Insights and Dynamics
- 4.1Market Overview
- 4.2Market Drivers
- 4.2.1Urban Mobility Push Accelerating Metro Expansion and Multimodal Transit Integration
- 4.2.2Transit-Oriented Development (TOD) Principles Driving Synergies Between Real Estate and Transport Projects
- 4.2.3National Expressway and Road Upgrade Programs Enhancing Intercity Connectivity and Network Efficiency
- 4.2.4Major Aviation Infrastructure Investments Expanding Passenger and Air Cargo Capacity
- 4.3Market Restraints
- 4.3.1Persistent Imported Material Cost Inflation Elevating Project Budgets
- 4.3.2Skilled Labour Shortages Limiting Capacity for Specialized Transport Projects
- 4.3.3Geopolitical Risks and Regional Uncertainty Weighing on Long-Term Foreign Infrastructure Investment
- 4.4Value / Supply-Chain Analysis
- 4.4.1Overview
- 4.4.2Real Estate Developers and Contractors - Key Quantitative and Qualitative Insights
- 4.4.3Architectural and Engineering Companies - Key Quantitative and Qualitative Insights
- 4.4.4Building Material and Equipment Companies - Key Quantitative and Qualitative Insights
- 4.5Government Initiatives & Vision
- 4.6Regulatory Outlook
- 4.7Porter’s Five Forces
- 4.7.1Threat of New Entrants
- 4.7.2Bargaining Power of Suppliers
- 4.7.3Bargaining Power of Contractors
- 4.7.4Threat of Substitutes
- 4.7.5Competitive Rivalry
- 4.8Pricing (Construction Materials) and Construction Cost (Materials, Labour, Equipment) Analysis
- 4.9Comparison of Key Industry Metrics of Qatar with Other Countries
- 4.10Key Upcoming/Ongoing Projects (with a focus on Mega Projects)
- 4.11Insights on Technological Innovations
5. Market Size & Growth Forecasts (Value, USD)
- 5.1By Type
- 5.1.1Roadways
- 5.1.2Railways
- 5.1.3Airways
- 5.1.4Ports and Inland Waterways
- 5.2By Construction Type
- 5.2.1New Construction
- 5.2.2Renovation
- 5.3By Investment Source
- 5.3.1Public
- 5.3.2Private
- 5.4By Key Cites
- 5.4.1Doha
- 5.4.2Al Rayyan
- 5.4.3Al Daayen
- 5.4.4Lusail
- 5.4.5Rest of Qatar
6. Competitive Landscape
- 6.1Market Concentration
- 6.2Strategic Moves
- 6.3Market Share Analysis
- 6.4Company Profiles {(includes Global level Overview, Market level overview, Core Segments, Financials as available, Strategic Information, Market Rank/Share for key companies, Products & Services, and Recent Developments)}
- 6.4.1Qatar Rail
- 6.4.2Ashghal (Public Works Authority)
- 6.4.3HBK Contracting Company W.L.L
- 6.4.4Qatari Diar
- 6.4.5Midmac Contracting Company W.L.L.
- 6.4.6Al Jaber Engineering
- 6.4.7Consolidated Contractors Co. (CCC)
- 6.4.8Larsen & Toubro
- 6.4.9Webuild (Impregilo-Salini)
- 6.4.10Bouygues Travaux Publics
- 6.4.11Vinci Construction Grands Projets
- 6.4.12Hyundai Engineering & Construction
- 6.4.13China Railway Construction Corp.
- 6.4.14Tekfen Construction
- 6.4.15PORR AG
- 6.4.16Acciona
- 6.4.17Samsung C&T
- 6.4.18Bechtel
- 6.4.19KBR Inc.
- 6.4.20Parsons Corp.
- 6.4.21Mott MacDonald
7. Market Opportunities & Future Outlook
Research Methodology Framework and Report Scope
Market Definitions and Key Coverage
Segmentation Overview
- By Type
- Roadways
- Railways
- Airways
- Ports and Inland Waterways
- Roadways
- By Construction Type
- New Construction
- Renovation
- New Construction
- By Investment Source
- Public
- Private
- Public
- By Key Cites
- Doha
- Al Rayyan
- Al Daayen
- Lusail
- Rest of Qatar
- Doha
Detailed Research Methodology and Data Validation
Primary Research
Desk Research
Market-Sizing & Forecasting
Data Validation & Update Cycle
Why Our Qatar Transportation Infrastructure Construction Baseline Deserves Confidence
Benchmark comparison
| Market Size | Anonymized source | Primary gap driver | ||
|---|---|---|---|---|
USD 12.48 B (2025) | Mordor Intelligence | - | Anonymized source:Mordor Intelligence | Primary gap driver:- |
USD 16.80 B (2024) | Global Consultancy A | Includes minor repairs, headline CPI escalation | ||
USD 35.00 B (2023) | Industry Research B | Counts rolling stock, lumps multi-year PPP awards |