
Transplant Diagnostics Market Size and Share
Market Overview
| Study Period | 2020 - 2031 |
|---|---|
| Market Size (2026) | USD 6.88 Billion |
| Market Size (2031) | USD 9.98 Billion |
| Growth Rate (2026 - 2031) | 7.71 % |
| Fastest Growing Market | Asia Pacific |
| Largest Market | North America |
| Market Concentration | Medium |
Major Players *Disclaimer: Major Players sorted in no particular order Image © Mordor Intelligence. Reuse requires attribution under CC BY 4.0. | |
Transplant Diagnostics Market Analysis by Mordor Intelligence
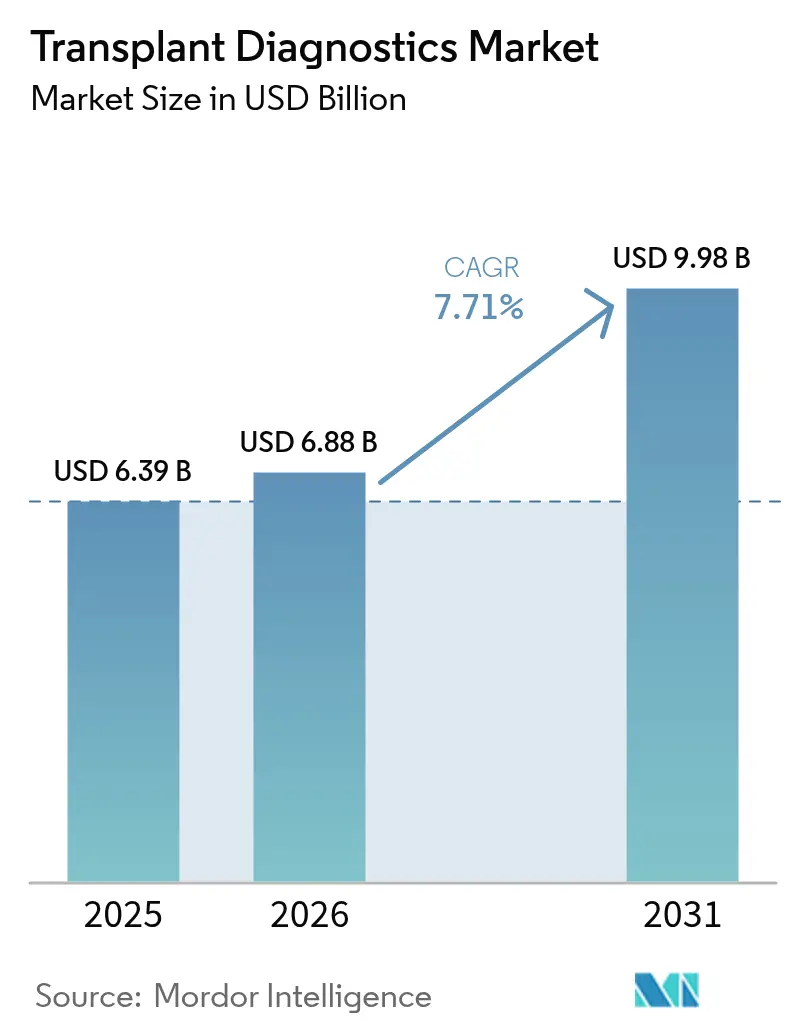
Transplant diagnostics market size in 2026 is estimated at USD 6.88 billion, growing from 2025 value of USD 6.39 billion with 2031 projections showing USD 9.98 billion, growing at 7.71% CAGR over 2026-2031. Robust transplant volumes, rapid NGS adoption, AI-driven decision support, and payer recognition of precision medicine collectively sustain double-digit revenue momentum across major laboratories and kit suppliers. High-resolution HLA sequencing delivers decisive gains in turnaround times and allelic resolution, encouraging pay-per-use procurement models that lower capital barriers for smaller programs. Reagent pull-through remains strong because NGS workflows require validated library kits, while predictive dd-cfDNA surveillance is displacing invasive biopsies in routine follow-up. Competitive intensity is rising as diagnostics majors and transplant-focused specialists race to integrate analytics, automation, and digital pathology into unified offerings.
Key Report Takeaways
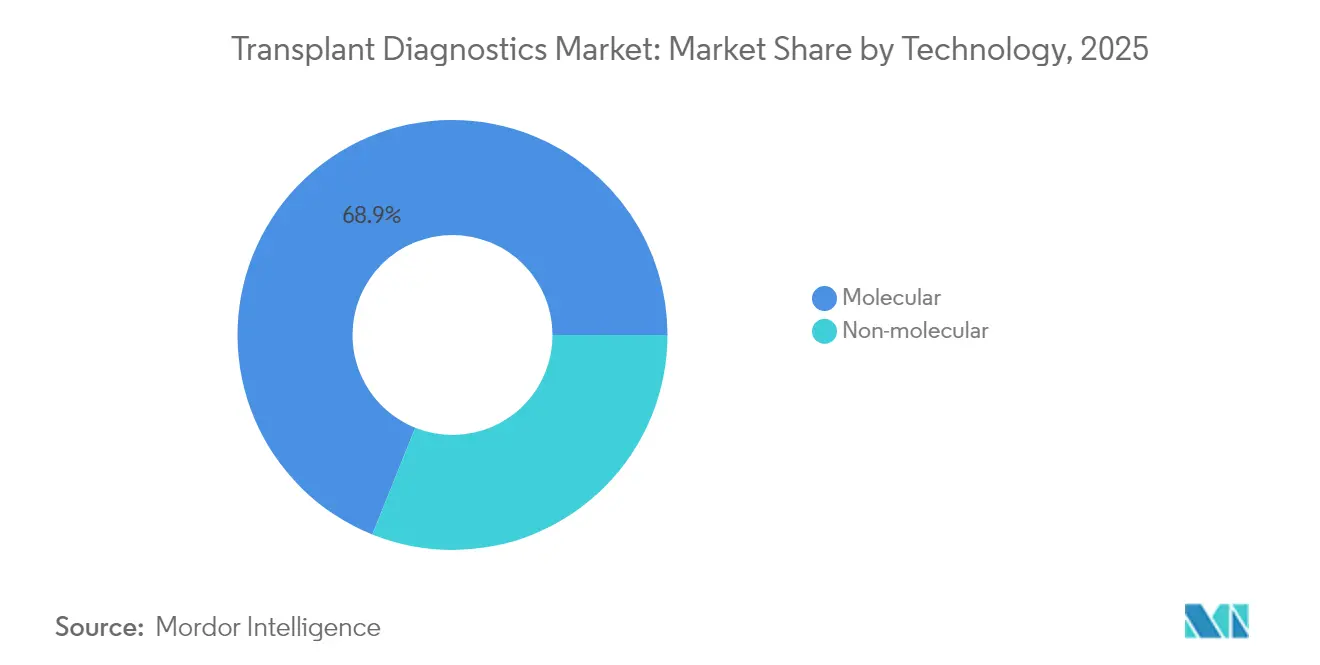
- By technology, molecular platforms led with 68.92% of transplant diagnostics market share in 2025.
- By product, reagents and consumables accounted for 64.93% revenue in 2025; software and analytics is expanding at a 13.58% CAGR through 2031.
- By transplant type, solid organs held 76.12% share in 2025 while stem cell procedures are growing at 10.29% CAGR.
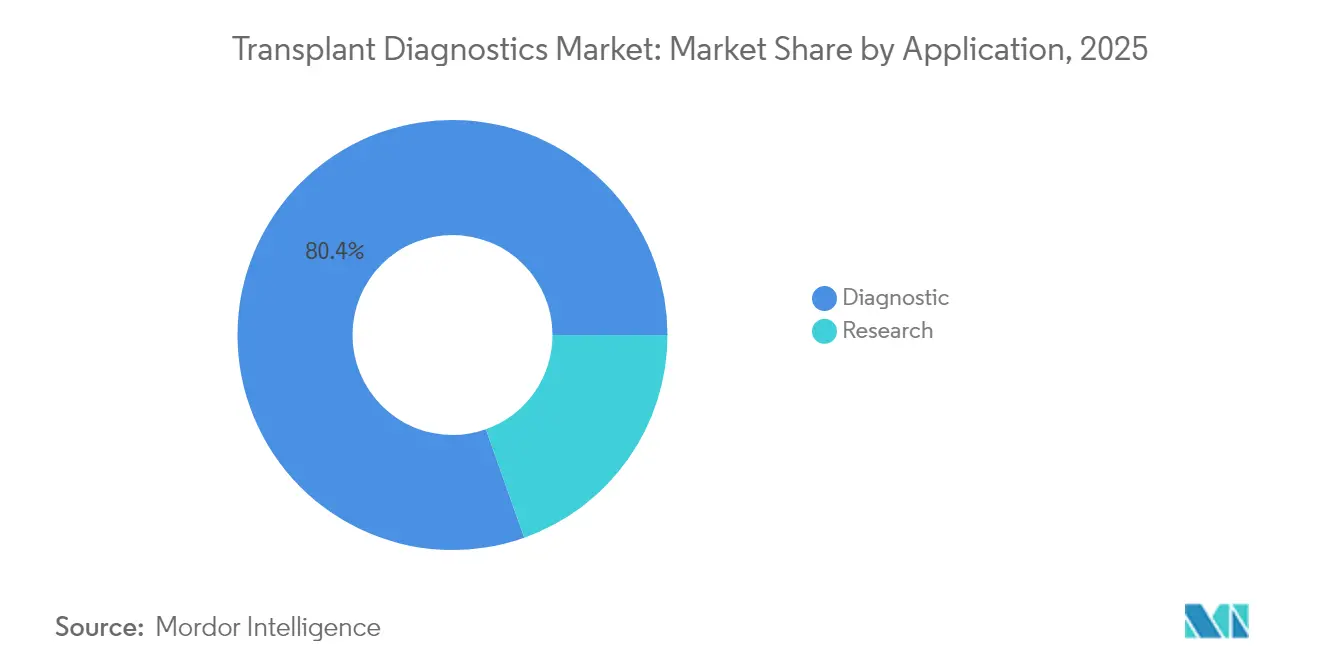
- By application, diagnostic segment accounted for 80.42% of 2025 revenue; research segment is forecast to rise at an 11.34% CAGR to 2031.
- By end user, hospitals and transplant centers captured 54.48% revenue in 2025; academic and research institutes post the quickest gains at 12.28% CAGR.
- By geography, North America dominated with 42.42% share in 2025, while Asia-Pacific advances at 11.36% CAGR.
Note: Market size and forecast figures in this report are generated using Mordor Intelligence’s proprietary estimation framework, updated with the latest available data and insights as of 2026.
Market Trends and Insights
Drivers Impact Analysis of Transplant Diagnostics Market*
| Driver | (~) % Impact on CAGR Forecast | Geographic Relevance | Impact Timeline |
|---|---|---|---|
| Growing Transplant Volumes (Solid-Organ & Cell Therapy) | +2.1% | Global, with strongest impact in North America & Asia-Pacific | Medium term (2-4 years) |
| Shift To NGS-Based HLA & Ccfdna Surveillance | +1.8% | Global, led by North America & Europe | Short term (≤ 2 years) |
| Reagent Rental + Pay-Per-Use Pricing By Vendors | +0.9% | North America & Europe, expanding to Asia-Pacific | Medium term (2-4 years) |
| AI-Assisted Histocompatibility Matching | +1.2% | Global, with early adoption in North America | Long term (≥ 4 years) |
| 3-D Printed Micro-Organs As Reference Controls | +0.4% | North America & Europe, research-focused | Long term (≥ 4 years) |
| Source: Mordor Intelligence | |||
Growing Transplant Volumes (Solid Organ & Cell Therapy)
US hospitals performed 48,000-plus organ transplants in 2024, a 3.3% rise that mirrors broader global gains. Donation-after-circulatory-death grafts now contribute 36% of deceased-donor procedures, expanding the recipient pool. Parallel momentum in hematopoietic stem-cell transplants is linked to high-resolution HLA typing that validates partially mismatched donors, especially benefitting ethnically diverse patients. Continuous distribution for lungs has already lifted transplant rates 16% within 12 months[1]Organ Procurement and Transplantation Network, “Organ Transplants Exceeded 48,000 in 2024,” optn.transplant.hrsa.gov. Each increment in procedure volume converts into higher demand for compatibility assays, post-operative monitoring, and longitudinal rejection surveillance. Consequently, the transplant diagnostics market records sustained reagent pull-through and greater installed-base utilization.
Shift to NGS-Based HLA & dd-cfDNA Surveillance
NGS platforms provide simultaneous high-resolution typing of multiple HLA loci via sample barcoding, boosting throughput while cutting cost per allele. dd-cfDNA assays now flag graft injury earlier than histology, with hazard ratios of 2.56 for elevated signals in heart recipients. National payers increasingly recognize the downstream savings from fewer biopsy complications, accelerating reimbursement approvals. Laboratories gain flexibility through reagent-rental contracts that bundle sequencers, software, and consumables into predictable per-sample fees, propelling wider NGS adoption across mid-tier centers.
AI-Assisted Histocompatibility Matching
Machine-learning algorithms outperform conventional scoring in predicting cellular rejection, achieving 98% donor-recipient matching accuracy in kidney cohorts. Cardiac biopsy image classifiers covering 2,900 patients deliver higher diagnostic precision than manual review methods. Platforms such as Smart Match integrate IoT telemetry with predictive analytics to update allocation decisions in real time. AI integration embeds software subscriptions into every assay order, opening recurring revenue channels and reinforcing vendor lock-in across the transplant diagnostics market.
Reagent-Rental & Pay-Per-Use Pricing
Lower upfront capital encourages smaller centers to adopt advanced assays. Vendors replicate gene-therapy subscription models by bundling consumables, service, and analytics into flat monthly fees for unlimited tests. This arrangement smooths budget spikes and ensures reagent certainty during surge periods. As laboratories scale test menus, per-sample economics improve, making precision diagnostics accessible beyond top-tier institutions.
Restraints Impact Analysis of Transplant Diagnostics Market*
| Restraint | (~) % Impact on CAGR Forecast | Geographic Relevance | Impact Timeline |
|---|---|---|---|
| High Assay Costs & Capital Outlay | -1.4% | Global, particularly affecting emerging markets | Short term (≤ 2 years) |
| Patchwork Global Reimbursement | -1.1% | Global, with varying regional impact | Medium term (2-4 years) |
| Data-Privacy Hurdles In Cross-Border Registries | -0.7% | Europe & Asia-Pacific primarily | Long term (≥ 4 years) |
| Source: Mordor Intelligence | |||
High Assay Costs & Capital Outlay
Comprehensive NGS systems can exceed USD 500,000 before validation, while premium reagents reach USD 400 per sample aruplab.com. FDA oversight of Laboratory-Developed Tests adds compliance expenditures near USD 1.29 billion over 10 years[2]Food and Drug Administration, “Laboratory-Developed Tests Regulatory Impact Analysis,” fda.gov. Laboratories with limited throughput struggle to amortize these expenses, prompting consolidation toward high-volume reference centers. Cost pressure also affects dd-cfDNA assays where payer fee schedules lag analytical complexity, delaying widespread roll-out in low-income settings.
Patchwork Global Reimbursement
Medicare’s adjudication of AlloSure and AlloMap underscored how coverage swings can reset demand trajectories overnight. Europe requires multi-year clinical dossiers for new tests, extending market entry timelines and raising evidence-generation costs. GDPR restrictions have already reduced registry-based studies by 46.9%, slowing biomarker validation that underpins reimbursement submissions. These discrepancies fragment the global commercial roadmap and inhibit uniform scaling of transplant diagnostics market offerings.
*Our forecasts treat driver/restraint impacts as directional, not additive. The impact forecasts reflect baseline growth, mix effects, and variable interactions.
Transplant Diagnostics Market Segment Analysis
By Technology:
Molecular Platforms Extend DominanceMolecular assays captured 68.92% of transplant diagnostics market share in 2025 owing to unrivaled allelic resolution and multiplex capacity. The segment’s 7.63% CAGR through 2031 benefits from lab automation that consolidates extraction, library prep, and sequencing on unified decks, shortening hands-on time. Complementary non-molecular tests such as flow-cytometric crossmatch remain indispensable for urgent deceased-donor allocation, growing 12.02% CAGR on specialized use cases.
Platform enhancements now merge NGS reads with AI-based imputation to reconcile ambiguous alleles, raising call confidence in under-sequenced regions. dd-cfDNA kits layered on the same sequencers raise reagent consumption per patient episode, lifting the transplant diagnostics market size for molecular workflows. External proficiency programs covering 19 years of benchmarking show genotype concordance steadily increasing, underscoring technology maturity.



By Product:
Digital Analytics AcceleratesReagents and consumables remained the revenue anchor with 64.93% share in 2025 because every NGS run consumes barcoded primers, polymerases, and capture probes. Yet software and analytics is expected to post 13.58% CAGR, expanding the transplant diagnostics market size for digital services as algorithms automate QC, phasing, and clinical reporting.
Cloud-native platforms reduce on-premise infrastructure needs and support real-time variant databases that update with each global allele submission. Instruments shift toward usage-based leases, reallocating capex to operating budgets and dampening hardware growth. Vendors bundle AI licenses with reagent kits, embedding data subscriptions into every assay cycle to capture recurring revenue.
By Transplant Type:
Stem Cell Procedures SurgeSolid organ programs represented 76.12% of global revenue in 2025, anchored by kidney and liver caseloads that demand high-frequency monitoring. Stem cell transplantation, however, displays a 10.29% CAGR through 2031 as mismatched unrelated donors achieve survival parity with fully matched sources.
Expanded criteria intensify testing volumes because every partial match requires deeper allelic interrogation plus chimerism surveillance. Xenotransplantation successes, including 10-day pig-liver function without rejection, herald new compatibility assays that will diversify the transplant diagnostics market.
By Application:
Research Pipelines Propel InnovationClinical diagnostics generated 80.42% of revenue in 2025, encompassing pre-implant typing, virtual crossmatch, and longitudinal rejection monitoring. Research use is rising 11.34% CAGR as bioprinted tissue models, organoids, and extracellular vesicle analytics demand ultra-sensitive sequencing for immune profiling.
Grant-funded projects increasingly purchase multi-omic workflows that integrate single-cell RNA-seq with HLA genotyping. These studies drive incremental consumable demand and incubate biomarkers that eventually transition into clinical panels, continually enlarging the transplant diagnostics market.
By End User:
Academic Centers Lead Adoption CurvesHospitals and dedicated transplant centers retained 54.48% share in 2025 because point-of-care decisions hinge on in-house labs. Academic and research institutes are expanding at 12.28% CAGR as they combine care delivery with precision-medicine trials that require high-complexity assays.
Independent reference labs collect overflow samples and satisfy regulatory complexity for smaller community hospitals, reinforcing consolidation trends. Fully automated “dark labs” running 24/7 with robotic sample loading are emerging at leading institutions, signaling the next productivity leap for the transplant diagnostics market.
Geography Analysis
North America Transplant Diagnostics Market
North America held 42.42% of global revenue in 2025 due to comprehensive Medicare policies, 48,000 transplant procedures, and dense center networks that routinely deploy dd-cfDNA monitoring. Widespread adoption of AI analyzers and early reimbursement decisions support mid-single-digit unit price premiums. FDA regulation of LDTs may pinch smaller facilities, provoking outsourcing to national reference laboratories that command scale efficiencies.
Europe Transplant Diagnostics Market
Europe presents mature infrastructure with harmonized quality schemes; however, GDPR limits rare-allele data exchange, complicating multicenter study design and slowing biomarker validation. Health-technology-assessment bodies often request extended clinical outcome data, extending payback periods for vendors. Nonetheless, population aging and rising solid-organ waitlists sustain steady test volumes.
APAC Transplant Diagnostics Market
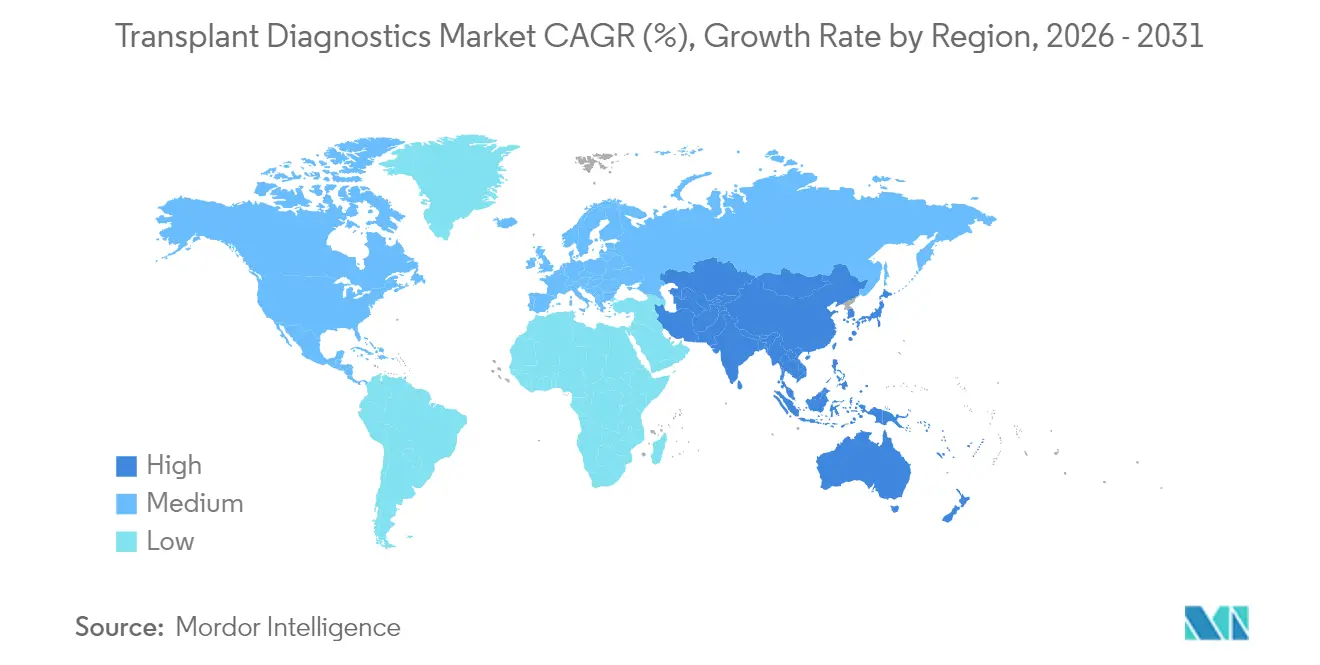
Asia-Pacific registers the fastest expansion at 11.36% CAGR as Japan pioneers gene-edited xenograft readiness and India scales transplant capacity with 85-90% one-year survival benchmarks. Governments invest in local bioprinting and NGS manufacturing to mitigate import dependence, amplifying reagent accessibility. Diverse HLA profiles across large populations further elevate demand for high-resolution genotyping, expanding the transplant diagnostics market.

Competitive Landscape
The sector exhibits moderate concentration with diagnostics conglomerates and transplant-focused specialists tussling for share. Abbott, Roche, and Thermo Fisher leverage multi-segment portfolios to supply instruments, reagents, and informatics bundles that embed them across hospital labs. CareDx and Natera maintain transplant exclusivity, posting 30% revenue growth in 2024 on expanded AlloSure indications and payer wins.
Strategic acquisitions intensify: Werfen purchased Omixon for USD 25 million to widen its NGS franchise, while Quest Diagnostics bought Fresenius kidney-testing assets to increase hospital outreach. Vendors differentiate by coupling consumables with AI dashboards that interpret immunological risk and link directly to electronic health records. Bioinformatics portfolios generate incremental subscription revenue and raise switching costs.
Impending reshuffles loom as Becton Dickinson explores divestiture of its USD 3.4 billion diagnostics arm, potentially enabling niche players to consolidate specialized assay lines. White-space opportunities persist in emerging economies, AI-enhanced personalized immunology, and xenotransplant compatibility testing. Vendors that harmonize sequencing, digital pathology, and predictive analytics within secure cloud frameworks are poised to accelerate share gains across the transplant diagnostics market.
Transplant Diagnostics Industry Leaders
Abbott Laboratories
Biomérieux SA
Qiagen NV
F Hoffman La Roche AG
Bio-Rad Laboratories, Inc.
- *Disclaimer: Major Players sorted in no particular order

Transplant Diagnostics Market Companies Covered in this Report
- Abbott Laboratories
- Becton, Dickinson & Co
- bioMérieux
- Bio-Rad Laboratories
- CareDx Inc.
- Roche
- Hologic
- Illumina
- QIAGEN
- Thermo Fisher Scientific
- Immucor
- Omixon
- GenDx (GenCell)
- BioGenuix
- Oxford Nanopore Technologies
- Eurofins
- Natera
- BGI
- Eurofins Transplant Genomics
- Genetron Health
- Pacific Biosciences

Market Opportunities and Future Outlook
Product whitespace is widening around standardized, regulated transplant-rejection and immune-risk tests, particularly those that can scale beyond single-site LDT constraints. In 2026, Insight Molecular Diagnostics submitted its GraftAssureDx kidney transplant rejection test to the FDA via the de novo pathway, which points to a continued push toward kit-based offerings with clearer regulatory positioning and broader commercialization routes for mid-tier transplant centers.
Workflow and menu expansion opportunities are also visible in next-generation HLA typing and broader pre-transplant safety testing coverage. CareDx introduced AlloSeq Nano in April 2026, bringing nanopore-based HLA and ABO genotyping into the transplant typing portfolio and reinforcing demand for associated software and analytics that interpret high-resolution results. On the service side, Stanford Blood Center launched specialized infectious disease and immunohematology testing services for organ and tissue donor procurement organizations in July 2026, highlighting capacity buildout around donor qualification and logistics. In the United States, New York State approvals continue to act as a commercialization lever, with Verici Dx receiving NYSDOH certification for Tutivia in June 2026 to enable nationwide availability and support broader adoption of non-invasive monitoring where reimbursement and operational pathways already exist.
Recent Industry Developments in Transplant Diagnostics Market
- July 2026: Stanford Blood Center launched specialized infectious disease and immunohematology testing services for organ and tissue donor procurement organizations. The expansion adds operational capacity for donor qualification workflows that feed transplant programs. It also supports more standardized, multi-state testing coverage for time-sensitive procurement logistics.
- June 2026: Verici Dx received New York State Department of Health certification for its Tutivia test, enabling nationwide availability across all 50 US states. This state-level milestone removes an access barrier for a clinically used kidney transplant rejection monitoring test. Broader geographic availability supports scaling with national transplant-center networks.
- October 2024: QIAGEN expanded its automated liquid biopsy portfolio with new kits for the EZ2 Connect platform, including applications relevant to organ transplantation. The update reinforces automation-oriented sample prep workflows that help labs manage throughput and consistency requirements. It also strengthens QIAGEN's position in standardized, instrument-linked consumables that fit transplant testing menus.


Transplant Diagnostics Market Report Scope and Research Methodology
Market Definition and Coverage
This market covers the revenue generated from tests and related tools used to support donor-recipient matching and to monitor graft health before and after transplantation, across clinical labs and transplant centers.
Scope exclusions: It excludes transplant surgery, therapeutic drugs, organ-preservation systems, and general purpose lab reagents or instruments that are not positioned for transplant compatibility workflows.
Segments Covered in This Report
- By Technology
- Molecular
- PCR-based Molecular Assays
- Sequencing-based Molecular Assays
- Non-Molecular
- Molecular
- By Product
- Instruments
- Reagents & Consumables
- Software / Analytics
- By Transplant Type
- Solid Organ
- Stem Cell / Bone Marrow
- Soft Tissue
- By Application
- Diagnostic
- Research
- By End User
- Independent Reference Laboratories
- Hospital & Transplant Centres
- Academic & Research Institutes
- Geography
- North America
- United States
- Canada
- Mexico
- Europe
- Germany
- United Kingdom
- France
- Italy
- Spain
- Rest of Europe
- Asia-Pacific
- China
- Japan
- India
- South Korea
- Australia
- Rest of Asia-Pacific
- Middle East and Africa
- GCC
- South Africa
- Rest of Middle East and Africa
- South America
- Brazil
- Argentina
- Rest of South America
- North America
Data Sources, Market Sizing, and Validation
Desk Research
Desk research was used to define the basic demand pool and keep assumptions tied to public, repeatable datasets. We referenced sources such as the United Network for Organ Sharing (UNOS) and the Organ Procurement and Transplantation Network (OPTN) for transplant procedure volumes, and the WHO Global Observatory on Donation and Transplantation for cross-country donation and transplant activity patterns.
To link clinical activity to diagnostic spending, we also reviewed publications and datasets from the US FDA for test and platform context, the CDC for disease burden signals that influence transplant demand, and peer-reviewed journals indexed on PubMed for trends such as HLA typing approaches and post-transplant surveillance. Company filings, investor presentations, and reputable press were used to confirm product positioning and geographic exposure. Paid subscriptions for company financials and patent databases were used selectively to support revenue mapping and technology-shift signals. These examples are not exhaustive, and many other public sources were also reviewed for data collection, validation, and clarification.
Primary Interviews and Surveys
Primary interviews focused on what is actually billed and adopted in routine transplant pathways, then on stress-testing assumptions about how the test mix changes over time. We spoke with a mix of transplant clinicians, lab directors, procurement teams, and diagnostic industry experts across major regions so gaps in public reporting, especially around pricing and utilization, could be addressed.
Distribution of primary research fieldwork respondents
| Company type | Respondent position | Region |
|---|---|---|
| Top tier: 35% | CXOs: 13% | APAC: 45% |
| Mid tier: 47% | Functional/Unit leaders: 28% | EMEA: 35% |
| Smaller Players: 18% | Managers: 59% | Americas: 20% |
Market-Sizing & Forecasting
The sizing model starts with a top-down build where transplant procedure volumes, donor testing requirements, and the intensity of post-transplant monitoring are used to reconstruct the addressable testing demand by region. We then convert demand into value using typical price bands and observed test-mix shares.
To keep the output realistic, we cross-checked against selective bottom-up approximations, such as sampled reagent and kit revenue by major product families, lab channel checks, and volume times ASP sanity checks for high-frequency assays.
Key inputs tracked include solid organ and stem cell transplant volumes, HLA typing and antibody screening frequency per patient journey, the shift toward higher resolution molecular methods (including sequencing-based workflows), reagent and consumable share versus instrument placements, and the pace of adoption for noninvasive surveillance tests where clinically relevant. If public splits were inconsistent in some regions, we used proxy indicators such as transplant center density and lab capacity, followed by expert re-checks to ensure outliers did not persist.
For forecasting, we ran scenario analysis around transplant volume growth and test mix progression. We then applied a regression-based overlay using variables such as healthcare spending direction, transplant waitlist growth signals, and donor availability trends to smooth the year-to-year curve. Assumptions were finalized only after they were checked against what experts expected in ordering behavior and reimbursement practicality.
Data Validation & Update Cycle
Validation was done in multiple steps to avoid reliance on a single dataset or assumption. Modeled totals were compared with independent signals such as transplant procedure totals, lab testing intensity benchmarks, and regional revenue patterns, and we investigated material variances before final sign-off.
If an input shifted unusually, for example a step-change in transplant volumes or a visible pricing shift, analysts re-checked the logic and, when needed, re-contacted experts to confirm whether the change was temporary or structural. The report is refreshed annually, with interim updates when material events affect demand, pricing, or scope. Before delivery, we complete a final review pass so the published view reflects the most current inputs available.
Mordor Intelligence's Transplant Diagnostics Market Sizing Compared With Other Published Estimates
It is common to see different published market sizes for transplant diagnostics because each publisher sets its own inclusion list and its own timing for what counts as the market year. Differences also come from how test utilization is estimated, whether software and services are bundled in, and how currency conversion or inflation is handled.
The main gap drivers in this market are usually whether the estimate counts only transplant-specific compatibility and monitoring assays, or also pulls in broader immunology and genetics testing performed outside transplant episodes. Another driver is the pricing method, since using list prices or assuming uniform ASP decline can swing totals when reagent-heavy workflows dominate, and not all studies re-check these assumptions against current lab purchasing behavior. A more frequent refresh also changes outcomes here, because adoption shifts, especially around molecular approaches, can move the mix within a short period, and those mix changes alter revenue even when procedure volume is stable.
Benchmark comparison
| Source | Market Size | Gaps in Research Methodology |
|---|---|---|
| Mordor Intelligence | USD 6.88 B (2026) | |
| Industry Research Publisher A | USD 6.39 B (2024) | Uses an earlier base year and a different forecast window, and it can broaden scope by grouping transplant diagnostics with adjacent software and service revenue that is not always tied to billable transplant test volumes. |
| Industry Research Publisher B | USD 4.94 B (2024) | Applies a narrower priced demand pool in some regions by leaning more on conservative utilization assumptions for advanced molecular testing, which can understate reagent and consumable intensity versus current lab practice. |
The spread is largely explained by base-year timing and what is counted as transplant-specific testing revenue versus adjacent categories. By anchoring demand to transplant procedure activity and then adjusting test mix and ASPs through repeated expert checks, the estimate stays traceable to clear variables and repeatable steps, which is the approach applied by Mordor Intelligence.


Key Questions Answered in the Report
What is the current value of the transplant diagnostics market?
The transplant diagnostics market size is USD 6.88 billion in 2026 and is projected to hit USD 9.98 billion by 2031 at a 7.71% CAGR.
Which technology segment leads revenue?
Molecular assays dominate with 68.92% market share in 2025 due to the clinical precision of next-generation sequencing.
Why are stem cell diagnostics growing faster than solid organ testing?
Expanded HLA matching criteria now validate partially mismatched donors, driving a 10.29% CAGR for stem cell transplant diagnostics.
Which region is expanding the fastest?
Asia-Pacific posts the quickest growth at 11.36% CAGR thanks to rapid transplant program expansion and government investment in precision medicine.
How are vendors lowering capital barriers for smaller centers?
Reagent-rental and pay-per-use models bundle sequencers, consumables, and software into predictable operating fees, enabling mid-tier hospitals to adopt NGS workflows without large upfront purchases.
Page last updated on:


 Your data is secure and never sold or shared.


