Data Masking Market Size and Share
Market Overview
| Study Period | 2020 - 2031 |
|---|---|
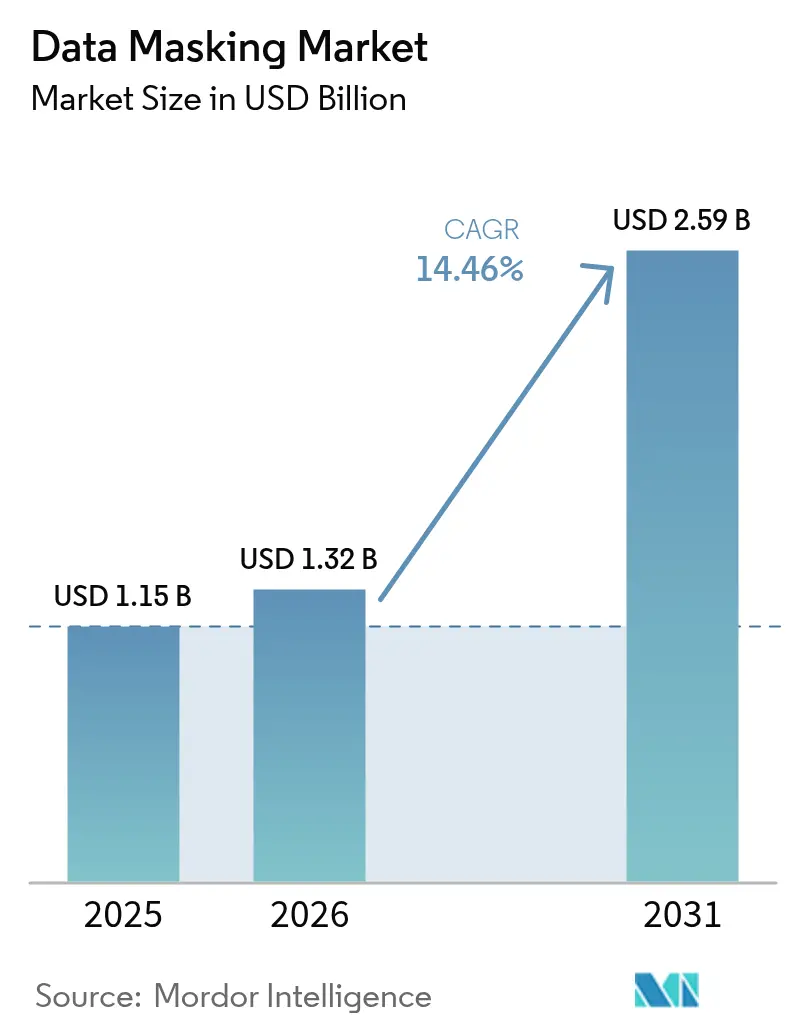
| Market Size (2026) | USD 1.32 Billion |
| Market Size (2031) | USD 2.59 Billion |
| Growth Rate (2026 - 2031) | 14.46% CAGR |
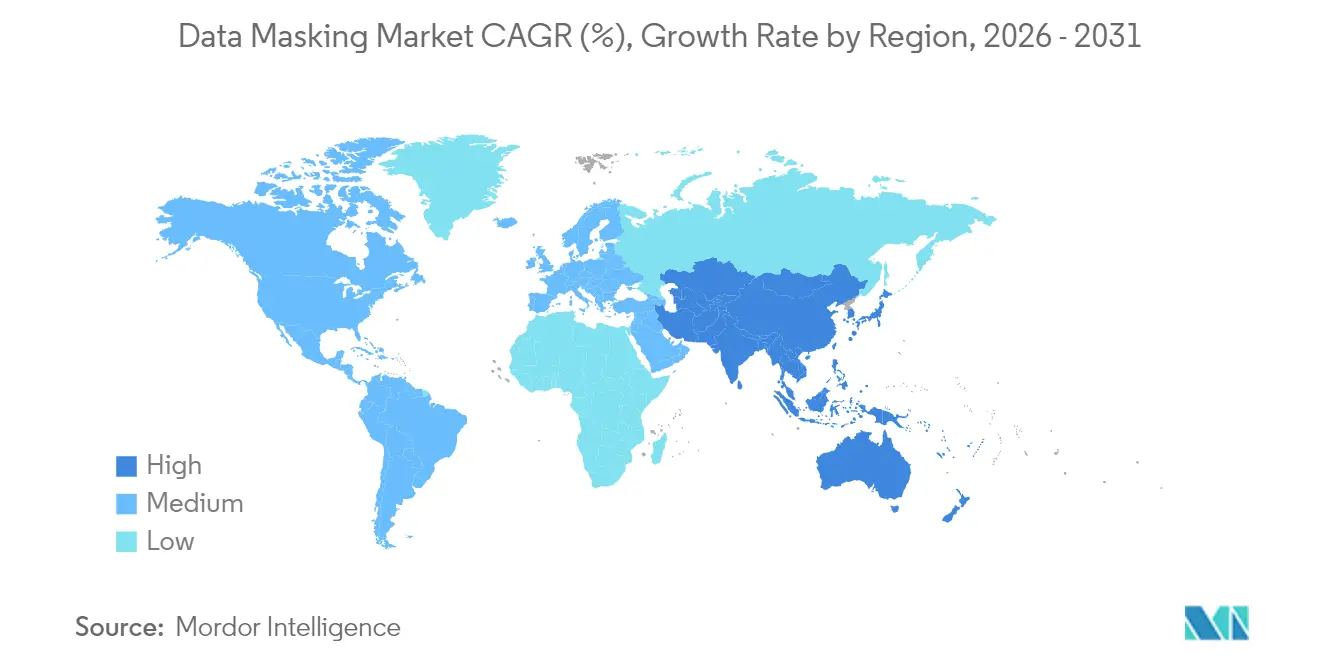
| Fastest Growing Market | Asia-Pacific |
| Largest Market | North America |
| Market Concentration | Medium |
Major Players *Disclaimer: Major Players sorted in no particular order Image © Mordor Intelligence. Reuse requires attribution under CC BY 4.0. | |
Data Masking Market Analysis by Mordor Intelligence
The data masking market size was valued at USD 1.15 billion in 2025 and estimated to grow from USD 1.32 billion in 2026 to reach USD 2.59 billion by 2031, at a CAGR of 14.46% during the forecast period (2026-2031). Strong legislation, accelerating cloud migration, and a surge in ransomware incidents are pushing organizations to replace ad-hoc anonymization with standardized masking programs that protect production and non-production data estates. Vendors are embedding AI in masking engines to speed discovery of sensitive fields, while DevOps teams treat masked, format-preserving copies as the default for continuous testing. Consolidation is likely as incumbents acquire niche specialists to fill product gaps in synthetic data, confidential computing, and unstructured data protection. Despite healthy growth, implementation complexity, licensing costs, and data-utility concerns remain short-term brakes on adoption, particularly for small and medium enterprises (SMEs).
Key Report Takeaways
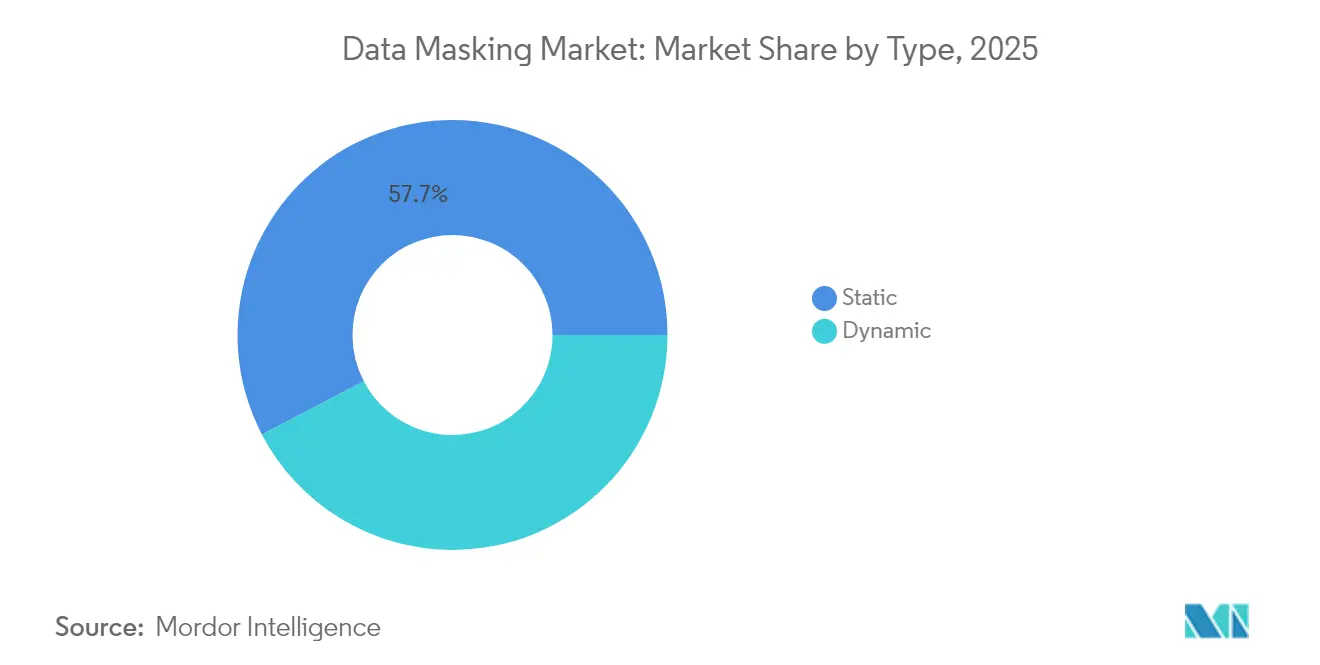
- By type, static masking led with 57.65% revenue share of the data masking market in 2025, while dynamic masking is on track for a 14.92% CAGR through 2031.
- By deployment model, on-premise installations accounted for 55.05% of the data masking market share in 2025, whereas cloud deployments are expanding at a 15.18% CAGR to 2031.
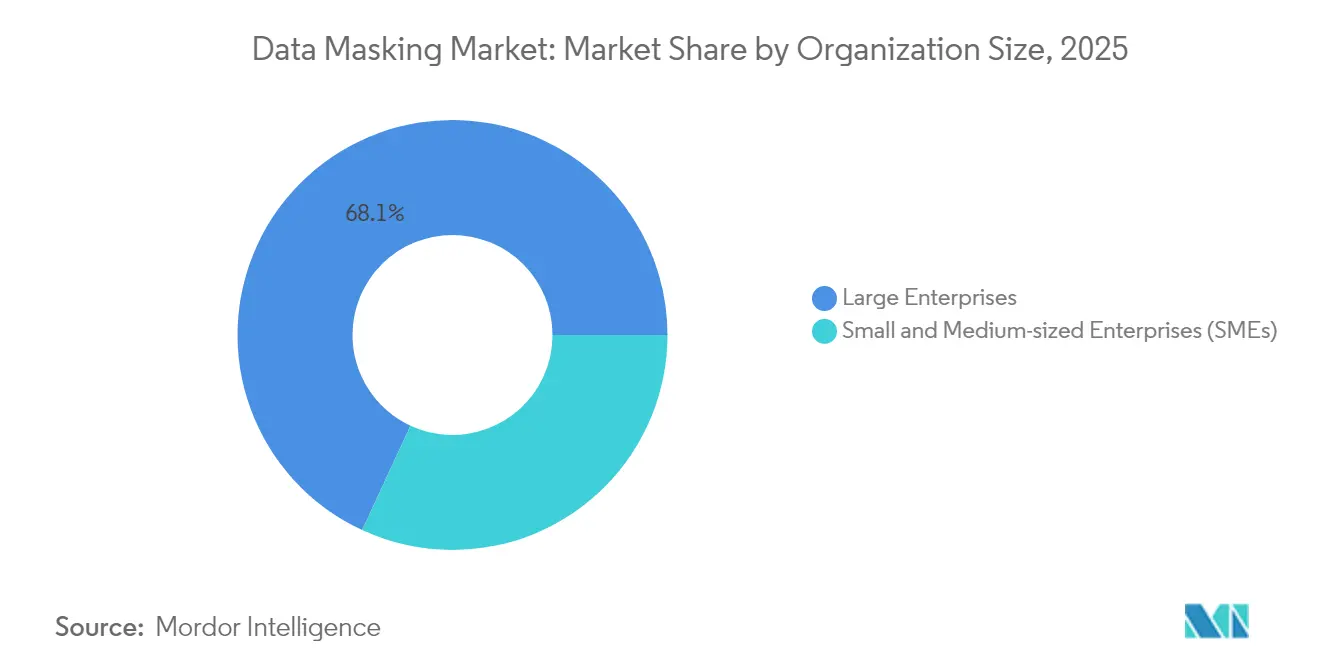
- By organization size, large enterprises commanded 68.10% of the data masking market size in 2025, yet SMEs register the fastest outlook at 15.06% CAGR through 2031.
- By end-user industry, BFSI captured 28.05% share of the data masking market size in 2025; healthcare is advancing at a 15.32% CAGR to 2031.
- By data environment, structured datasets dominated with a 52.78% share of the data masking market in 2025 and are growing at a 14.98% CAGR through 2031.
- By geography, North America held 37.05% of the data masking market share of the data masking market in 2025, while Asia-Pacific is set to rise at a 15.44% CAGR to 2031.
Note: Market size and forecast figures in this report are generated using Mordor Intelligence’s proprietary estimation framework, updated with the latest available data and insights as of 2026.
Global Data Masking Market Trends and Insights
Drivers Impact Analysis*
| Driver | (~) % Impact on CAGR Forecast | Geographic Relevance | Impact Timeline |
|---|---|---|---|
| Increase in global data volume | +3.2% | Global with Asia-Pacific leading | Medium term (2-4 years) |
| Rising data-privacy regulations | +4.1% | North America and EU, expanding to Asia-Pacific | Long term (≥ 4 years) |
| Cloud-first DevOps requiring masked test data | +2.8% | Global, concentrated in developed markets | Short term (≤ 2 years) |
| Surge in ransomware and cyber-attacks | +2.3% | Global, highest in North America | Medium term (2-4 years) |
| Synthetic-data adoption for AI training | +1.7% | North America and the EU, emerging in Asia-Pacific | Long term (≥ 4 years) |
| Data residency mandates in emerging economies | +1.2% | Asia-Pacific core; spill-over to MEA | Medium term (2-4 years) |
| Source: Mordor Intelligence | |||
Rising Data-Privacy Regulations Drive Compliance Investment
Expanding privacy laws, led by GDPR and backed by multi-billion-euro fines, have pushed masking to the center of corporate risk agendas. Thirteen U.S. states now enforce sector-agnostic privacy statutes that mirror GDPR obligations, prompting multinationals to replace manual scrubbing with centrally governed masking platforms. ISO/IEC 29100:2024 lists masking among formally recognized privacy-enhancing technologies, giving chief information security officers (CISOs) a standards-based reference for budget approvals. Banks, retailers, and health systems with cross-border footprints increasingly demand policy orchestration that maps to jurisdiction-specific residency rules yet enforces a single control posture. Vendors respond with templates that codify region-specific redaction thresholds, accelerating rollouts and lowering audit costs.[1]International Organization for Standardization, “ISO/IEC 29100:2024 Information Technology — Security Techniques — Privacy Framework,” iso.org
Cloud-First DevOps Accelerates Test Data Management Needs
DevOps teams deploy code daily and require full-fidelity test data that looks and behaves like production without exposing secrets. Masked datasets shorten release cycles by 73% compared to less realistic synthetic-only alternatives, making masking integral to continuous integration pipelines. Containerized delivery models let teams spin up a masked copy per feature branch, while format-preserving tokenization keeps referential integrity for complex microservices. Oracle Data Safe and IBM InfoSphere Optim now ship masking APIs that developers call directly from Terraform scripts, which simplifies infrastructure-as-code automation.[2]IBM, “InfoSphere Optim Data Privacy,” ibm.com As multicloud adoption reaches 76%, platform-agnostic masking brokers ensure consistent policies across AWS, Azure, and Google Cloud.
Synthetic Data Adoption Transforms AI Training Paradigms
Synthetic data augments masked datasets, providing statistically rich records for model training when original fields must remain confidential. Federal contracts from the U.S. Department of Homeland Security validate commercial interest, while banks cite 40% accuracy gains in fraud models that blend synthetic with masked samples. Vendors package masking rules and differential-privacy engines into a single workflow, letting data scientists toggle between regulated and research datasets without exporting raw data. NIST guidelines published in 2025 codify acceptable privacy budgets, driving enterprise pilots and encouraging insurers to accept synthetic outputs for actuarial risk scoring.
Surge in Ransomware Attacks Elevates Data Protection Priority
Ransomware payments exceeded USD 2 million per incident in 2024. Attackers now exfiltrate data before encryption, so restoring from backups no longer eliminates extortion risk. Masking mitigates downstream exposure by ensuring that non-production environments often the easiest to penetrate, never contain live identifiers. Zero-trust architectures adopted by 68% of Fortune 500 firms require least-privilege data flows, and masking aligns with that principle by down-scoping sensitive fields in transit. Government funding, such as the USD 200 million FCC cybersecurity pilot for schools and libraries, makes masking affordable for public-sector entities.
Restraints Impact Analysis*
| Restraint | (~) % Impact on CAGR Forecast | Geographic Relevance | Impact Timeline |
|---|---|---|---|
| Implementation complexity and legacy systems | -2.1% | Global, higher in developed markets | Short term (≤ 2 years) |
| High total cost of ownership for dynamic tools | -1.8% | Global, strong in SME segment | Medium term (2-4 years) |
| Reduced data utility for advanced analytics | -1.3% | North America and EU, emerging in Asia-Pacific | Long term (≥ 4 years) |
| Regulatory uncertainty on synthetic datasets | -0.9% | Global, focus on Asia-Pacific-EU corridors | Medium term (2-4 years) |
| Source: Mordor Intelligence | |||
Implementation Complexity Challenges Enterprise Adoption
Enterprises report 18-month timelines to roll out enterprise-wide masking because mainframes, ERP suites, and cloud data warehouses require different connectors. Maintaining referential integrity across thousands of tables can mean refactoring stored procedures, adding months of QA cycles. Where tokenization vaults become a single point of failure, architects must design active-active clusters, increasing capital expense. Some firms defer dynamic masking in favor of static snapshots, trading real-time coverage for simpler deployments.
High Total Cost of Ownership Constrains SME Adoption
Dynamic masking engines can cost USD 500,000 per year, excluding specialist headcount. Licensing based on data volume punishes fast-growing SMEs, and unpredictable renewal escalators deter long-term commitments. As a workaround, smaller firms gravitate to static open-source tools like GreenMask, accepting limited audit trails and manual policy updates. Vendors respond with tiered SaaS models that meter by usage hours rather than dataset size, smoothing budget forecasts and easing board approvals.
*Our forecasts treat driver/restraint impacts as directional, not additive. The impact forecasts reflect baseline growth, mix effects, and variable interactions.
Segment Analysis
By Type: Static Masking Retains Leadership While Dynamic Rises
Static techniques delivered 57.65% of 2025 revenue, underpinned by predictable throughput and minimal query overhead in relational databases. Financial institutions value deterministic tokenization that keeps account numbers reversible under strict key control, allowing masked data to feed reconciliation engines without schema changes. Dynamic tools, growing at a 14.92% CAGR, shield production analytics workloads by intercepting queries and rewriting result sets on the fly. Early adopters include online retailers running real-time personalization where milliseconds matter. The data masking market size for dynamic solutions is estimated at USD 0.49 billion in 2025, projected to exceed USD 1.12 billion by 2031 on the back of customer-360 and open-banking APIs. Format-preserving encryption bridges both camps, giving architects a migration path that delivers immediate compliance while enabling a gradual move to in-line masking gateways. Thales Vormetric’s vaultless tokenization, launched mid-2024, exemplifies the hybrid model.
Across 2026-2031, static masking will remain the default for QA, training, and offshore support databases. However, as organizations modernize to event-stream architectures, dynamic masking that can redact Kafka topics or GraphQL responses will capture incremental spend. Vendors that bundle policy-as-code templates and auto-classify fields using machine learning lower the skills barrier, accelerating dynamic adoption in regulated verticals. As a result, the data masking market will likely see a blending of static‐plus-dynamic deployments within single enterprises, each optimized for distinct latency and cost envelopes.


By Deployment Model: Hybrid Architectures Shift Share to Cloud
On-premise environments still processed 55.05% of masked data in 2025, driven by sovereignty mandates and sunk investments in data centers. Yet a 15.18% CAGR in cloud deployments points to rapid share transfer, especially among digitized SMEs that bypass legacy stacks. The data masking market size for cloud solutions reached USD 0.52 billion in 2025 and will climb in line with multicloud analytics programs. Confidential-computing features such as Intel SGX allow masking engines to protect keys during computation, mitigating fears around provider access. K2View’s fabric deploys as Kubernetes operators, applying rules uniformly across Redshift, Snowflake, and BigQuery without re-coding.
By 2031, most large enterprises will run policy engines centrally and push enforcement decisions to both local and cloud workers. This federated pattern reduces egress charges and complies with residency laws. ISO/IEC 27701, scheduled for late-2025 release, will codify privacy controls for cloud PIAs, and masking vendors are already mapping controls to draft clauses. Consequently, the data masking market will reward platforms with native connectors to all major hyperscalers and the ability to share lineage metadata with cloud security posture management tools.
By Organization Size: SME Upswing Narrows the Gap
Large enterprises controlled 68.10% of 2025 expenditure thanks to multi-petabyte data estates, audit obligations, and global staff counts that force fine-grained role-based redaction. Their typical contracts bundle data discovery, classification, masking, and tokenization across dozens of data stores. However, SMEs clock a 15.06% CAGR and will account for nearly one-third of spending by decade's end. Consumption-based SaaS lowered the entry ticket; Protecto, for example, offers per-user tiers starting at USD 2,000 annually, auto-discovering sensitive fields in minutes.
SMEs care most about one-click templates for PCI and HIPAA rather than custom rules, and many prefer static masking with overnight refreshes to avoid daytime performance hits. The vendor ecosystem responds by embedding masking inside broader data-governance-as-a-service bundles. Channel partners, especially regional MSPs, play a key role by bundling setup, monitoring, and quarterly audits, further easing SME adoption.
By End-User Industry: BFSI Holds Lead as Healthcare Accelerates
Stringent mandates keep BFSI atop spending, with 28.05% of 2025 outlays. PCI DSS 4.0’s March 2025 deadline adds fresh urgency; acquirers must improve data discovery and redact PAN fields in logs. Banks also rely on masking to feed real-time anti-money-laundering analytics without breaching secrecy laws. Yet healthcare’s 15.32% CAGR outpaces all other sectors. Electronic health record vendors integrate masking APIs to support FHIR-based interoperability, while biotech firms rely on masked genomic datasets during pre-approval research.
Retailers employ masking to protect loyalty-program data and comply with state-level privacy acts, especially when sharing datasets with marketing partners. Manufacturing and energy verticals explore masking of sensor and SCADA telemetry to share insights with OEMs without exposing IP. These niche applications expand the data masking industry footprint into operational technology, though overall revenue remains dominated by BFSI and healthcare through 2031.
By Data Environment: Structured Data Holds Majority Amid Unstructured Growth
Relational databases delivered 52.78% of 2025 revenue and will keep a slim majority through 2031. Mature tools auto-generate surrogate keys, maintain deterministic references, and support partition pruning for performance. The data masking market size for structured datasets is forecast to post a steady 14.98% CAGR as organizations modernize core banking, SAP, and CRM systems. Unstructured data emails, chat logs, and medical images, grows faster in volume but lacks standardized field delimiters. Protecto’s context-aware NLP engine recognizes entities in free-text physician notes, replacing names while leaving clinical context intact.
Large language models (LLMs) introduce new attack vectors such as prompt injection; enterprises respond by masking sensitive content before it enters vector stores. Vendors now secure embeddings by swapping personally identifiable vectors with pseudonymized equivalents, preserving semantic search accuracy. As a result, unstructured masking will increasingly ride on advances in AI-driven pattern recognition, turning a current niche into a mainstream requirement by 2031.
Geography Analysis
North America captured 37.05% of revenue in 2025, anchored by early cloud adoption, stringent state laws, and high ransomware exposure. C-suite budgets reflect sizable breach fines, pushing masking to the top of cybersecurity roadmaps. Multinationals headquartered in the region deploy unified platforms that apply policies consistently to subsidiaries worldwide, simplifying cross-border audits.
Europe follows with entrenched GDPR enforcement and emerging statutes such as the AI Act. Regulators’ appetite for blockbuster fines, demonstrated by the EUR 1.2 billion Meta penalty, creates a clear ROI case for masking deployment. Funding from the Digital Europe Programme channels EUR 142 million toward SME privacy tech adoption, shrinking the historical gap between large enterprises and smaller firms.
Asia-Pacific posts the fastest 15.44% CAGR through 2031. Nations, including Singapore, update privacy laws to align with OECD frameworks, and China mandates data-local processing under PIPL, prompting regional data-center build-outs with local masking nodes. Indian IT outsourcers adopt masking by default to protect client data inside offshore delivery centers, boosting domestic vendor spend. South America, the Middle East, and Africa lag in absolute dollars but present green-field opportunities as digital ID, fintech, and smart-city initiatives mature. Local resellers bundle masking into turnkey compliance packages, accelerating initial penetration.

Regulatory Landscape
Data masking adoption is being pulled into formal compliance programs as privacy regulators and standards bodies tighten expectations for de-identification, access minimization, and control effectiveness. Under GDPR enforcement, high-profile penalties (such as the EUR 1.2 billion fine against Meta in December 2024) have reinforced the need to protect personal data not only in production, but also across non-production estates where leaks frequently occur. Standards provide additional audit anchors, including ISO/IEC 29100:2024, which recognizes masking as a privacy-enhancing technique, and ISO/IEC 27001:2022 Annex A control 8.11, which calls out data masking as a named technological control.
Recent guidance adds more specificity on what constitutes acceptable anonymisation and pseudonymisation. The European Data Protection Board issued Guidelines 2025/01 on pseudonymisation (January 2025) and published Guidelines 02/2026 on anonymisation (July 2026). These documents raise the emphasis on re-identification risk assessment and require enterprises to document technical and organizational measures around masking, tokenization, and dataset release processes. In cloud environments, ISO/IEC 27018:2025 updates guidance for public cloud PII processors, reinforcing customer expectations for provider-aligned controls when masking is implemented alongside multicloud data pipelines.
Value Chain Analysis
The value chain begins with discovery and classification (identifying sensitive fields across databases, data lakes, and SaaS), then moves to policy definition, where privacy and security teams translate requirements from GDPR, state privacy laws, PCI DSS 4.0, and sector rules into masking rules and roles. Core solution providers supply masking engines (static, dynamic, and in-flight), connectors to platforms such as cloud data warehouses and CI/CD toolchains, and audit reporting. Enterprises typically consume these through direct licensing or SaaS subscriptions, as well as via systems integrators and managed service providers that handle design, connector buildout, and operations.
Downstream, masked datasets are distributed to developers, QA, analytics teams, offshore support, and third parties through governed environments such as test data management platforms, data catalogs, and secure collaboration frameworks. Cross-organization data collaboration is becoming a visible workflow driver. In March 2026, Fifty5Blue (formerly Kantar Media) used AWS Clean Rooms for privacy-enhanced cross-media measurement and audit transparency during panel data exchange, showing how masking and privacy-preserving computation can complement each other when multiple parties must share or compare datasets without exposing raw identifiers. Key bottlenecks remain connector coverage for legacy systems, referential-integrity preservation across complex schemas, and operationalizing continuous policy enforcement across hybrid and multicloud estates.
Competitive Landscape
The market remains moderately fragmented. IBM, Oracle, and Informatica leverage deep product catalogs in integration and governance, offering end-to-end suites that appeal to risk-averse buyers. Delphix and K2View win on developer efficiency, providing lightweight Kubernetes operators and change-data-capture pipelines optimized for agile teams. Protecto positions around GenAI safety, inserting masking at the token and embedding layers to support LLM adoption without leakage risks.
Partnerships matter: Perforce aligned Delphix with Microsoft Azure in April 2025, bringing policy automation to cloud DevOps pipelines. Thales couples tokenization with hardware security modules for regulated finance. Open-source entrants like GreenMask impose pricing pressure, forcing commercial vendors to differentiate via centralized policy orchestration, differential-privacy plug-ins, and audit-ready reporting.
Acquisitions are likely as incumbents pursue niche capabilities expect buys in query-level obfuscation, confidential computing, and privacy-preserving federated analytics. Market momentum favors vendors that can auto-discover sensitive data across structured, semi-structured, and unstructured sources, then enforce policies near real time with minimal latency overhead.
Data Masking Industry Leaders
IBM Corporation
Oracle Corporation
Informatica Inc.
Delphix Corp.
Mentis Inc.
- *Disclaimer: Major Players sorted in no particular order

Market Opportunities and Future Outlook
A primary whitespace area is continuous anonymisation and masking assurance as regulators focus on re-identification risk under modern AI capabilities. The EDPB Guidelines 02/2026 on anonymisation (published July 2026) introduce a more structured assessment approach and reinforce the need to revisit anonymisation claims over time. This creates demand for tooling that combines masking, privacy testing, and governance workflows, rather than one-off, project-based scrambling. Vendors that can operationalize reassessment using policy-as-code, dataset versioning, and automated risk checks are better positioned with regulated enterprises that run frequent data refreshes for analytics and model training.
Another opportunity sits at the intersection of AI usage controls and data masking in enterprise workflows. As organizations route internal data into AI assistants and agentic systems, leakage risk becomes measurable and operational. Check Point Research reported in May 2026 that in Business Services, AI interactions carrying a risk of sensitive data exposure rose to 1 in 14, supporting buyer demand for masking that can operate at ingestion points (APIs, prompts, logs, and data movement) and not only within databases. Product roadmaps are shifting accordingly toward in-flight masking, unstructured redaction, and integration with AI governance and security stacks, alongside established demand for DevOps-friendly masked test data and multicloud consistency.
Recent Industry Developments
- April 2026: Oracle expanded AI capabilities in Oracle Database@Google Cloud, including the Oracle AI Database Agent for Gemini Enterprise. The move deepens multicloud operating models where masking and subsetting are used to protect sensitive fields across replicated and shared datasets, strengthening demand for native, platform-integrated masking controls.
- June 2025: IBM introduced software that integrates IBM Guardium AI Security with watsonx.governance to provide a unified view of enterprise AI risk and security posture. This raises the profile of masking and data protection controls within AI governance programs as enterprises align privacy controls to model development and deployment workflows.
- October 2024: IBM launched IBM Guardium Data Security Center with integrated data monitoring, governance, and cryptography management. By consolidating security and governance capabilities into a unified platform, the launch supports broader enterprise deployments where masking is implemented alongside monitoring and policy enforcement across hybrid data estates.


Research Methodology Framework and Report Scope
Market Definition and Coverage
This market covers the revenue earned from data masking software and related services that help organizations replace sensitive data with realistic, usable values for testing, analytics, and controlled sharing, while keeping exposure risk low.
Scope exclusions: It does not count broader cybersecurity tools that do not perform masking, such as general encryption-only products, endpoint security, or generic identity tools.
Segmentation Overview
- By Type
- Static
- Dynamic
- By Deployment Model
- Cloud
- On-premise
- By Organization Size
- Large Enterprises
- Small and Medium Enterprises (SMEs)
- By End-User Industry
- BFSI
- IT and Telecom
- Healthcare
- Retail and E-commerce
- Industrial and Defense
- Energy and Utilities
- Manufacturing
- Other Industry Verticals
- By Data Environment
- Structured Data
- Semi-structured and Unstructured Data
- By Geography
- North America
- United States
- Canada
- Mexico
- South America
- Brazil
- Argentina
- Chile
- Rest of South America
- Europe
- Germany
- United Kingdom
- France
- Italy
- Spain
- Rest of Europe
- Asia-Pacific
- China
- India
- Japan
- South Korea
- Malaysia
- Singapore
- Australia
- Rest of Asia-Pacific
- Middle East and Africa
- Middle East
- United Arab Emirates
- Saudi Arabia
- Turkey
- Rest of Middle East
- Africa
- South Africa
- Nigeria
- Rest of Africa
- Middle East
- North America
Data Sources, Market Sizing, and Validation
Desk Research
Desk work started with public signals that explain why masking demand moves, and where it shows up first. We reviewed regulatory and guidance material on personal data handling and breach response, plus standards and security control references (such as NIST publications), which help set realistic adoption assumptions. To keep the model grounded in real usage, we also used sources such as OECD digital economy releases, US SEC cybersecurity disclosure guidance and filings, and privacy regulator websites for enforcement themes that trigger project budgets.
On the supply and monetization side, we relied on vendor annual reports, investor decks, product documentation, and credible press coverage to understand packaging changes and buyer needs across cloud and on-premise environments. Patent databases were checked to spot where masking is being linked with newer approaches like synthetic data and unstructured data protection, which then informed our scope checks. We also used paid subscriptions for company financials and news screening, and for patent lookups, to speed up validation and avoid missing smaller public signals. These desk sources are illustrative, and we used additional public references to cross-check facts and remove ambiguity during analysis.
Primary Interviews and Surveys
Primary work focused on confirming what buyers actually purchase under data masking budgets, and how pricing and deployment choices shift between static and dynamic masking use cases. We spoke with solution owners, security and privacy leaders, and delivery partners across APAC, EMEA, and the Americas so assumptions from desk inputs could be tested, gaps could be filled, and final sizing could be reconciled with real buying patterns.
Distribution of primary research fieldwork respondents
| Company type | Respondent position | Region |
|---|---|---|
| Top tier: 35% | CXOs: 20% | APAC: 49% |
| Mid tier: 45% | Functional/Unit leaders: 39% | EMEA: 33% |
| Smaller Players: 20% | Managers: 41% | Americas: 18% |
Market-Sizing & Forecasting
The sizing model is built by taking a top-down path where the addressable demand pool is reconstructed from enterprise security and data management spend patterns, and then filtered through masking-specific adoption. Once the demand pool is formed, we break it into logical usage environments, and then align it to how masking is purchased in real projects (licenses, subscriptions, and related services). After that, selective bottom-up checks are used to keep totals realistic, such as sampling typical price bands, validating deployment mix, and rolling up a set of supplier revenues where disclosures are available.
Inputs used in the model include the pace of cloud migration for data platforms, the share of non-production data copies created for testing and DevOps, regulatory enforcement intensity in privacy-heavy sectors, and the shift toward protecting unstructured and semi-structured data in addition to traditional structured databases. We also track typical deployment splits between on-premise and cloud, and the frequency of major product refresh cycles that can change average selling prices. Where a bottom-up check has gaps because smaller vendors do not disclose clean masking revenue, we adjust using interview-backed share ranges and keep the correction step visible in the workbook.
For forecasting, scenario analysis is used, supported by a light multivariate regression on the strongest demand indicators, and then tuned based on expert consensus from primary discussions. That combination helps separate steady growth drivers like compliance and modernization from event-driven spikes tied to breach-response projects.
Data Validation & Update Cycle
Validation is done through multiple passes so the final number is not dependent on one assumption. We compare the output against independent signals like enterprise security spending direction, cloud adoption pace, and stated privacy compliance priorities, and then we check for year-to-year jumps that do not match the buying cycle. When a variance is found, the inputs are rechecked, and targeted re-contacts are triggered with interviewees to confirm whether a change is real or model-driven.
Before sign-off, the model is reviewed by another analyst to confirm scope boundaries, math integrity, and whether any regional weights look out of line. Reports are refreshed annually, and interim updates are done when major events change adoption or pricing, such as large regulation updates or meaningful platform shifts. Right before delivery, a final data scan is completed so clients receive the most current view available.
Mordor Intelligence's Data Masking Market Estimate Compared With Other Published Estimates
Published market sizes for data masking can look different even when the topic name is the same, because the boundary around what is counted is not always consistent. In this space, the common differences come from whether services are included, how cloud subscriptions are annualized, and whether adjacent privacy tools are folded into the same bucket.
By tracking deployment mix and refreshing scope rules for what qualifies as masking revenue, Mordor Intelligence keeps the 2026 estimate tied to solutions and related services that directly deliver masking outcomes, while some estimates widen the scope into nearby privacy or data security categories. We also noticed that timing choices, like which year exchange rates are applied and whether 2025 or 2026 is treated as the anchor year, can move the headline value even when growth expectations are similar.
Benchmark comparison
| Source | Market Size | Gaps in Research Methodology |
|---|---|---|
| Mordor Intelligence | USD 1.32 B (2026) | |
| Global Consultancy A | USD 1.13 B (2025) | Anchors the estimate in 2025 and can understate 2026 totals if subscription ramp-ups and cloud conversion are not carried forward consistently into the next year. |
| Industry Publisher B | USD 1.54 B (2026) | Often applies a broader scope that may include adjacent privacy or security spending lines alongside masking, which can lift the 2026 value versus a masking-only revenue boundary. |
Looking across the three values, the spread is mainly explained by what gets counted as masking, and how the base year is handled when cloud adoption is rising. Our approach is to keep inclusions rule-based and then validate them with buyer and practitioner feedback, so the final number stays traceable to clear demand drivers and repeatable checks.


Key Questions Answered in the Report
How big is the data masking market in 2026?
It is valued at USD 1.32 billion and is forecast to reach USD 2.59 billion by 2031, reflecting a 14.46% CAGR during the forecast period (2026-2031).
Which segment is expanding fastest within data masking?
Dynamic masking shows the highest growth, advancing at a 14.92% CAGR through 2031 due to real-time analytics demand.
Why are SMEs adopting masking now?
SaaS pricing, template-driven deployment, and regulatory pressure make enterprise-grade protection accessible without large capital outlays.
Which region offers the strongest future upside?
Asia-Pacific leads with a 15.44% CAGR as nations tighten privacy laws and digitize public-sector services.
How do synthetic data and masking complement each other?
Enterprises combine masked production snapshots with synthetic records to enrich AI training while preserving mathematical privacy guarantees.
Page last updated on:


