Transparent Display Market Size and Share
Market Overview
| Study Period | 2020 - 2031 |
|---|---|
| Market Size (2026) | USD 4.91 Billion |
| Market Size (2031) | USD 10.24 Billion |
| Growth Rate (2026 - 2031) | 15.84% CAGR |
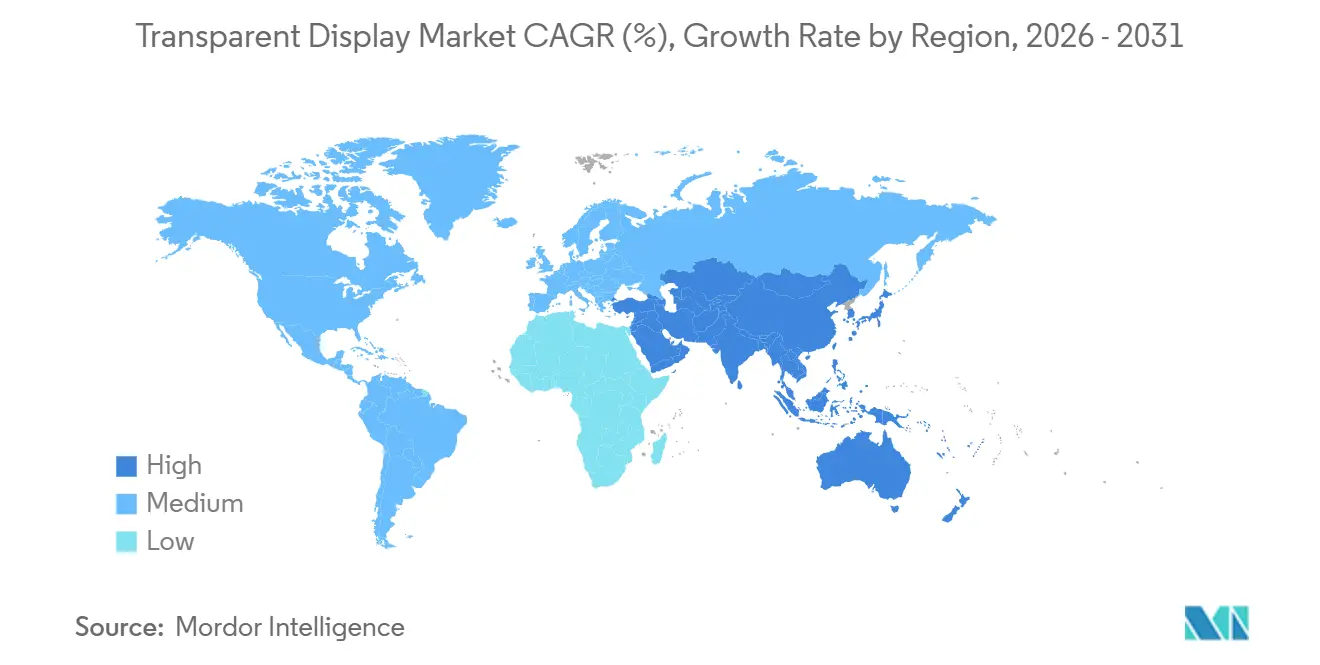
| Fastest Growing Market | Asia Pacific |
| Largest Market | Asia Pacific |
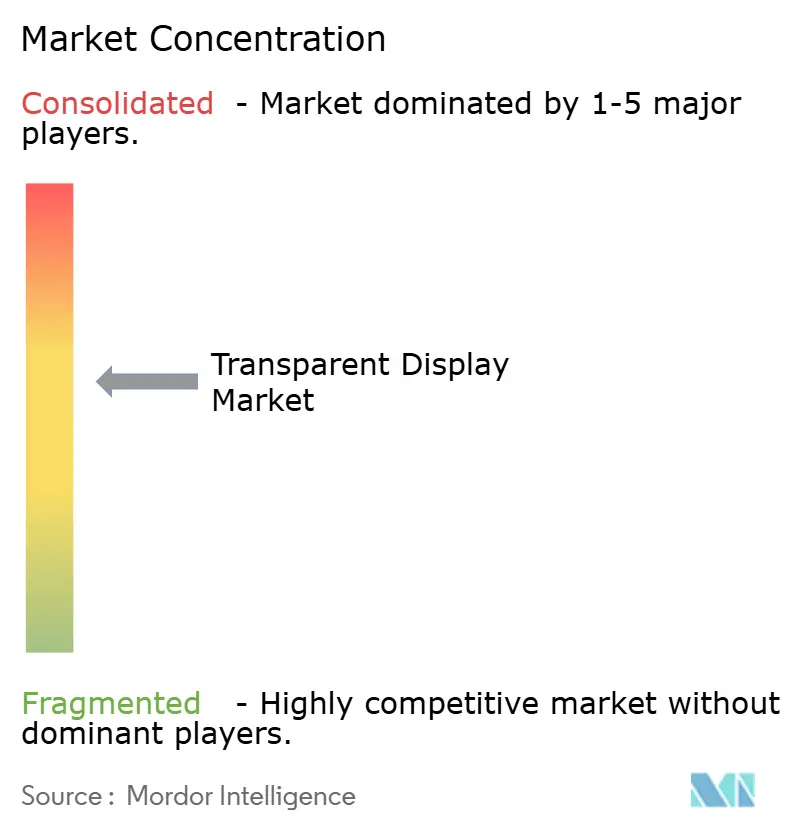
| Market Concentration | Medium |
Major Players *Disclaimer: Major Players sorted in no particular order Image © Mordor Intelligence. Reuse requires attribution under CC BY 4.0. | |
Transparent Display Market Analysis by Mordor Intelligence
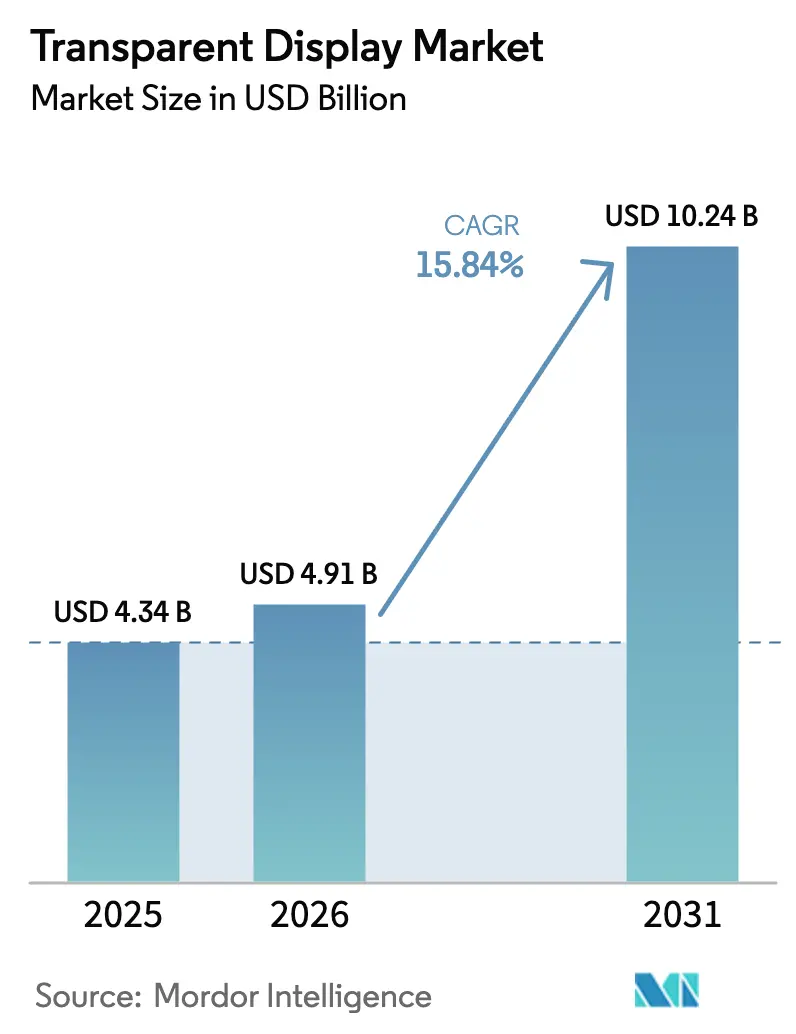
The Transparent display market size was valued at USD 4.34 billion in 2025 and is estimated to grow from USD 4.91 billion in 2026 to reach USD 10.24 billion by 2031, at a CAGR of 15.84% during the forecast period (2026-2031). Automotive original equipment manufacturers are embedding augmented-reality head-up displays, luxury retailers are adopting interactive storefronts to draw consumers back into physical stores, and defense contractors are testing transparent-armor cockpits that keep pilots aware of their surroundings. The formation of the QuadAlliance in February 2026 signals that Tier-1 suppliers now view transparent panels as a scalable platform rather than a niche add-on. Vertically integrated manufacturers continue to absorb the capital burden of Gen 8.6 organic light-emitting diode fabs where initial yields can be as low as 50%. Indium-tin-oxide prices above USD 400 per kilogram outside China are squeezing integrators that lack long-term supply contracts. These converging forces are shaping a market in which scale, secure sourcing, and advanced optics define competitive advantage.
Key Report Takeaways
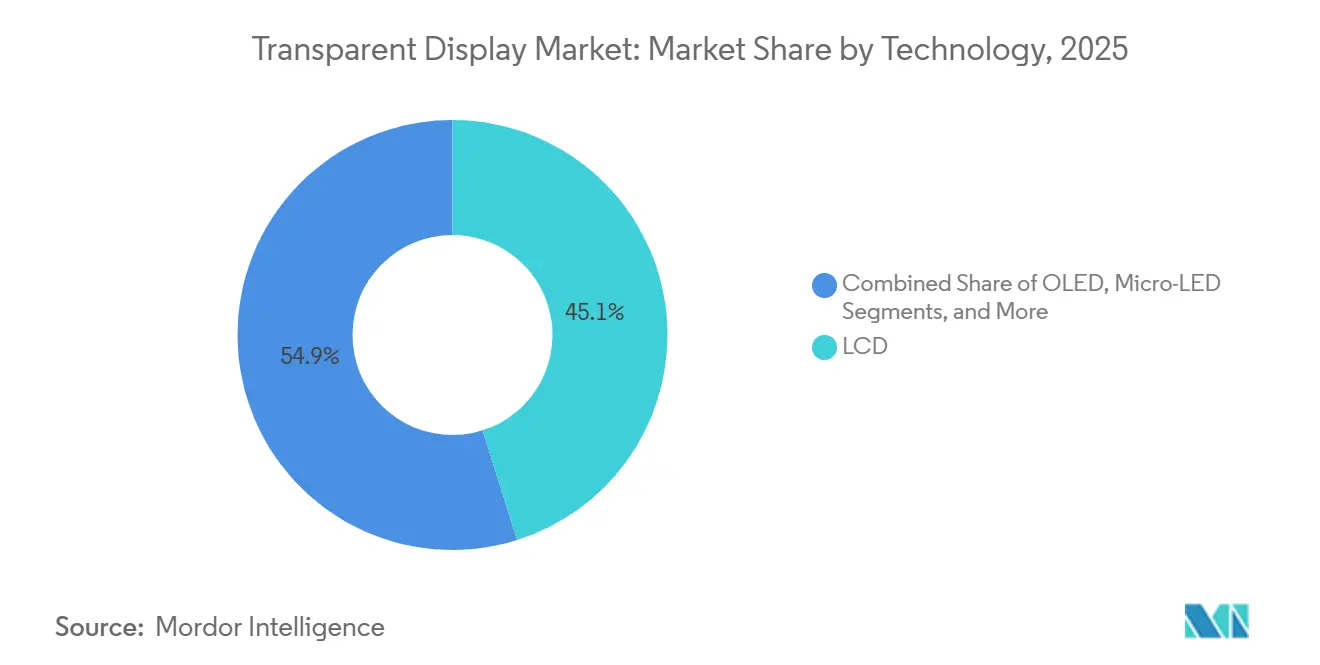
- By technology, liquid-crystal display held a 45.13% transparent display market share in 2025 while micro-light-emitting diode is projected to expand at a 15.93% CAGR through 2031.
- By end-user industry, retail and digital signage led with 30.47% revenue share in 2025, whereas automotive is forecast to post the fastest 16.29% CAGR to 2031.
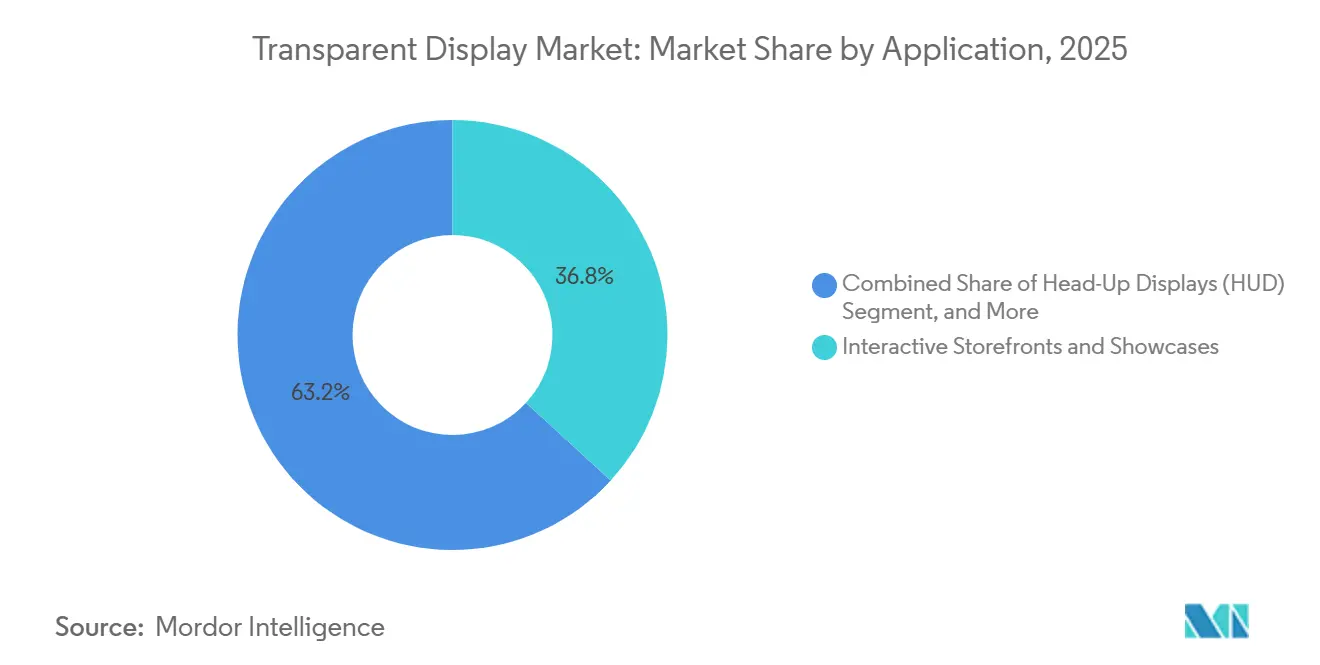
- By application, interactive storefronts commanded 36.84% of 2025 revenue, yet head-up displays are on track for a 16.02% CAGR between 2026 and 2031.
- By display size, panels at least 40 inches captured 52.72% of 2025 sales and are expected to grow at a 16.11% CAGR during the forecast horizon.
- By geography, Asia Pacific secured 40.38% global revenue in 2025 and is forecast to remain the fastest region with a 16.56% CAGR to 2031.
Note: Market size and forecast figures in this report are generated using Mordor Intelligence’s proprietary estimation framework, updated with the latest available data and insights as of January 2026.
Global Transparent Display Market Trends and Insights
Drivers Impact Analysis*
| Driver | (~) % Impact on CAGR Forecast | Geographic Relevance | Impact Timeline |
|---|---|---|---|
| Rising Adoption in Automotive HUD and Cluster Displays | +3.2% | Global, with APAC and Europe leading OEM integration | Medium term (2-4 years) |
| Retail and Digital-signage Demand for Immersive Storefronts | +2.8% | North America, Europe, APAC urban centers | Short term (≤ 2 years) |
| Rapid AR/VR Headset Proliferation | +2.5% | Global, concentrated in North America and APAC consumer markets | Medium term (2-4 years) |
| Cost-down Roadmap for Micro-LED Transparent Panels | +3.0% | APAC manufacturing hubs, spillover to global markets | Long term (≥ 4 years) |
| Dual-use Façade Glass Integrating Transparent PV-displays | +1.5% | Europe, North America, Middle East (net-zero building mandates) | Long term (≥ 4 years) |
| Defense Investment in Transparent Armoured Cockpits | +1.2% | North America, Europe (military procurement cycles) | Long term (≥ 4 years) |
| Source: Mordor Intelligence | |||


Rising Adoption in Automotive HUD and Cluster Displays
Original equipment manufacturers are embedding transparent displays in windshields and instrument panels so drivers can receive navigation cues and collision alerts without shifting their gaze. The QuadAlliance formed in February 2026 by ZEISS, tesa, Saint-Gobain Sekurit, and Hyundai Mobis is targeting 2029 mass production of holographic head-up displays, tripling vertical field of view compared with today’s systems. Visteon partnered with FUTURUS in September 2025 to migrate augmented-reality HUDs into mid-tier sedans, a move that will lower unit costs through higher volumes. Regulatory momentum is visible as UNECE Regulation 125 requires at least 70% transparency for forward-vision devices, while ISO/TS 21957:2023 harmonizes test procedures, cutting approval time by months.[1]UNECE, “Regulation No. 125: Forward Field of Vision,” UNECE.ORG Covestro introduced polycarbonate interlayers in March 2025 that pass ISO 16750-3 mechanical-shock tests, giving suppliers confidence to offer multi-year warranties. Collectively, standards clarity, supplier alliances, and ruggedized materials point to transparent HUDs becoming standard on many mainstream vehicles by 2028.
Retail and Digital-signage Demand for Immersive Storefronts
Luxury labels and mall operators are installing transparent displays that overlay rich media onto physical products, turning windows into dynamic advertising canvases. LG Display deployed 55-inch transparent organic light-emitting diode panels across Tokyo boutiques in September 2025 and reported a 30% to 40% lift in dwell time during pilots.[2]LG Display, “55-inch Transparent OLED Panel Deployment in Tokyo Retail,” LGDISPLAY.COM Glass-Media introduced ultra-thin transparent LED posters in November 2025 with 85% transparency, enabling retailers to rotate campaigns every few seconds while maintaining unobstructed views. Quick-service restaurants and transit hubs are following suit because transparent panels attach directly to glass doors or partition walls where conventional screens cannot fit. Low-power organic light-emitting diode variants consuming under 50 watts per square meter help chains meet LEED energy prerequisites. As content-management platforms move to the cloud, regional franchises can update hundreds of storefronts remotely, accelerating roll-outs beyond flagship locations.
Rapid AR and VR Headset Proliferation
Augmented-reality wearables need transparent or semi-transparent displays that deliver high pixel density with minimal latency. Micro-organic light-emitting diode prototypes unveiled in February 2025 cut optical crosstalk by 40% through a black-matrix sub-pixel design, improving text clarity outdoors.[3]Institute of Electrical and Electronics Engineers, “Micro-OLED Optical Crosstalk Reduction,” IEEE.ORG Dual-sided transparent screens showcased by the Society for Information Display allow the same panel to provide outward imagery and inward eye tracking, cutting parts count inside compact glasses. Smartphone organic light-emitting diode fabs are repurposing surplus capacity for micro-displays, pushing panel prices below USD 50 for sub-1-inch units, which lowers entry barriers for consumer brands. The regulatory path is lighter than that for medical devices, so vendors can iterate hardware annually. Growing availability of software development kits fosters a content ecosystem that keeps pace with display innovation, avoiding the mismatch that stalled earlier smart-glass attempts.
Cost-down Roadmap for Micro-LED Transparent Panels
Manufacturers are racing to reduce the cost of micro-light-emitting diode transparent panels, which already offer brightness above 5,000 nits and lifetimes exceeding 100,000 hours. Fluidic self-assembly demonstrated in 2023 deposits chiplets into receptor wells with micrometer precision, which trims rework labor and boosts throughput. Laser mass-transfer systems introduced in October 2024 can move 10,000 chiplets per cycle, slashing assembly time by an estimated 60%. Vertical stacking of red, green, and blue micro-LEDs raises panel transparency from 60% to 80% and simplifies optics. As pilot lines convert these breakthroughs into repeatable recipes, market participants expect micro-LED unit pricing to fall below organic light-emitting diode parity by 2028, opening high-brightness applications in automotive, architecture, and outdoor signage.
Restraints Impact Analysis*
| Restraint | (~) % Impact on CAGR Forecast | Geographic Relevance | Impact Timeline |
|---|---|---|---|
| Low Yield and High CAPEX of Transparent Panel Fabs | -2.1% | Global, concentrated in APAC fab investments | Medium term (2-4 years) |
| Sub-optimal Brightness/contrast Versus Conventional Displays | -1.3% | Global, affecting outdoor and high-ambient-light applications | Short term (≤ 2 years) |
| Indium-tin-oxide (ITO) Supply Risk and Price Volatility | -1.8% | Global, acute in North America and Europe due to tariffs | Short term (≤ 2 years) |
| Automotive Glare-safety Regulations Delaying Roll-outs | -1.0% | Europe, North America (regulatory approval cycles) | Medium term (2-4 years) |
| Source: Mordor Intelligence | |||
Low Yield and High CAPEX of Transparent Panel Fabs
Gen 8.6 organic light-emitting diode and micro-LED fabs demand cleanrooms, inkjet printing heads, and multilayer encapsulation tools that push capital expenditure above USD 4 billion, limiting new entrants. TCL CSOT broke ground on such a facility in October 2025 with a USD 4.15 billion budget yet acknowledged yields will hover near 50% during the first production year. Universal Display’s third-quarter 2025 results underscored the risk when lower utilization drags on margins across the supply chain. Yield losses originate from particulate contamination in transparent cathodes and water-vapor ingress that degrades organics. Only conglomerates with diversified earnings can endure multi-year payback periods, which curbs global capacity expansion and keeps panel prices elevated until yields climb above 80% post-2028.
Indium-tin-oxide Supply Risk and Price Volatility
Indium-tin-oxide provides the transparent conductive layer for liquid-crystal display, organic light-emitting diode, and micro-LED panels, yet 70% of global indium output comes from China. Prices outside China surpassed USD 400 per kilogram in April 2025 after export quotas tightened. The United States added a 25% tariff on Chinese indium in September 2024, pushing domestic prices to USD 420 per kilogram by mid-2024. Alternatives such as silver nanowires and graphene remain experimental, so panel makers must hedge with long-term contracts or recycling programs until new mines in Canada and Australia start shipping ore around 2029. In the interim, cost spikes hurt small integrators that lack purchasing leverage.
*Our forecasts treat driver/restraint impacts as directional, not additive. The impact forecasts reflect baseline growth, mix effects, and variable interactions.
Segment Analysis
By Technology: OLED Gains While LCD Holds Installed Base
Liquid-crystal display retained the largest 45.13% revenue share in 2025 due to mature tooling and panel prices under USD 100 per square meter. Transparency, however, tops out near 70% and brightness rarely exceeds 500 nits, which restricts outdoor use. Organic light-emitting diode is advancing at a 15.84% CAGR and already meets UNECE photometric criteria for automotive HUDs because self-emissive pixels hit 1,000 nits without a backlight. The transparent display market size for organic light-emitting diode panels is projected to overtake liquid-crystal display revenue by 2029 as retailers and automakers pay premiums for higher contrast. Micro-LED promises even longer lifetimes and is forecast to post the fastest 15.93% CAGR through 2031, supported by fluidic self-assembly and laser mass-transfer techniques that drive defect rates below 10 ppm. Transparent projection and electrochromic films serve specialty installations and smart windows, where imagery resolution is less critical than dynamic opacity or low cost.
Manufacturers segment their portfolios accordingly. Korean firms leverage proprietary organic light-emitting diode stacks to defend high-margin niches, while Chinese producers ship low-cost liquid-crystal display units for indoor signage. Over time, rising yields from Gen 8.6 organic light-emitting diode lines narrow the cost gap with liquid-crystal display, encouraging mid-tier retailers to upgrade. Conversely, aerospace customers favor micro-LED for cockpit transparency near 90% and brightness well above 5,000 nits, performance unattainable with organic light-emitting diode. This bifurcation lets suppliers target discrete use cases rather than pursuing a one-size-fits-all strategy.


By End-User Industry: Automotive Surges Past Retail on Growth Metric
Retail and digital signage generated the largest slice of 2025 revenue at 30.47%, driven by immersive storefronts that merge physical goods with digital storytelling. Automotive is on course for the sharpest 16.29% CAGR because head-up and cluster displays are transitioning from luxury options to standard features across volume models. The transparent display market share for automotive applications is expected to rise steadily after 2027 as ISO and UNECE standards reduce homologation risk. Consumer electronics and smart appliances remain a smaller but vibrant niche where micro-organic light-emitting diode advances slash optical crosstalk, improving readability in bright rooms.
Aerospace and defense projects progress slowly under extended procurement cycles, yet high margins compensate for low volumes. Industrial and enterprise deployments such as warehouse pick-to-light systems and medical imaging overlays grow steadily where situational awareness pays productivity dividends. Healthcare and education adopt transparent screens for surgical planning and museum exhibits, though budgets limit unit sales. Overall, OEMs design transparent displays to meet sector-specific standards like SAE J1757/1 and IEC 62471, which elevates certification cost but reinforces vendor lock-in once approvals are secured.
By Application: HUD Momentum Outpaces Storefronts
Interactive storefronts formed the largest 36.84% share in 2025 because luxury retailers could justify ten-thousand-dollar panels that animate merchandise behind glass. Head-up displays, however, will advance fastest at a 16.02% CAGR as automakers push driver-assist functions to the windshield. The transparent display market size for HUDs will expand markedly after 2028 when the QuadAlliance begins volume shipping holographic windshields featuring a 15-degree vertical field of view. Augmented-reality wearables further amplify demand for micro-displays that weigh only grams yet reach 2,000 nits for outdoor legibility.
Smart windows combine electrochromic dimming with transparent photovoltaic layers such as Ubiquitous Energy’s 10% efficient coating, letting building owners monetize glass as both energy harvester and media asset. Museums and exhibitions continue to adopt transparent projection for immersive curation experiences, but scale remains limited. As panel prices fall, mid-tier retailers and quick-service chains will narrow the growth gap, ensuring interactive storefronts remain a steady revenue contributor even while HUDs pace overall expansion.
By Display Size: Large Formats Command Architectural Budgets
Panels 40 inches and above captured 52.72% of 2025 revenue, buoyed by retail flagships and building lobbies where visual impact scales with area. Economies of scale in Gen 8.6 fabs mean mother-glass utilization improves as panel dimensions increase, reducing waste. The transparent display market size for large formats is forecast to post a 16.11% CAGR through 2031. Medium panels between 10 and 39 inches fit instrument clusters and smart-appliance doors, and Covestro’s polycarbonate interlayers help them survive vibration and temperature cycling in vehicles. Micro panels below 10 inches power augmented-reality glasses and helmet-mounted displays, benefiting from smartphone organic light-emitting diode line conversion that cuts cost under USD 50 per unit.
Size dynamics align with application requirements. HUD projectors often need 14- to 20-inch emitters to fill a windshield combiner, while architectural façades demand several square meters of contiguous glass. As yields and throughput improve across every size class, relative growth rates will converge, but large panels will keep revenue leadership because square-meter pricing multiplies quickly on glass façades.
Geography Analysis
Asia Pacific generated 40.38% of 2025 sales and will log the highest 16.56% CAGR thanks to China’s liquid-crystal display and organic light-emitting diode base and South Korea’s premium organic light-emitting diode prowess. BOE demonstrated a 55-inch 4K transparent organic light-emitting diode at CES 2024 and aims to ship in volume, challenging Korean incumbents. LG Display and Samsung unveiled transparent organic light-emitting diode and MicroLED prototypes that cost five-figure sums yet address premium retail and automotive clients. Japan contributes industrial solutions through Sharp and Japan Display, whereas India’s adoption is still nascent given limited panel-making capacity.
North America and Europe are mature but regulation driven. The United States imposed a 25% tariff on Chinese indium in September 2024, pushing integrators to lock long-term supply or absorb margin erosion. UNECE Regulation 125 provides clarity on 70% transparency thresholds, accelerating European automaker adoption. Smart-window providers such as Saint-Gobain SageGlass secure Leadership in Energy and Environmental Design points for building owners upgrading their envelopes. The Middle East pursues dual-use façade glass that generates power while streaming media, aligning with net-zero mandates.
South America and Africa remain early-stage markets. Pilot deployments in Brazil’s retail sector and South Africa’s smart-city corridors demonstrate feasibility but are constrained by import duties and limited capital budgets. Overall, Asia Pacific remains the production powerhouse, while North America and Europe set performance and sustainability benchmarks that reverberate through the supply chain.

Competitive Landscape
The top five panel makers—LG Display, Samsung Electronics, BOE Technology Group, Sharp, and AU Optronics—account for roughly 55% to 60% of global capacity, indicating moderate concentration. Each competes on scale, patent portfolios, and vertical integration. TCL CSOT is investing USD 4.15 billion in an 8.6-generation organic light-emitting diode fab that will boost large-panel supply after 2027. Korean players leverage organic light-emitting diode intellectual property to secure premium automotive deals, while Chinese producers focus on cost-optimized liquid-crystal display and mid-market organic light-emitting diode.
Niche innovators occupy defensible positions. Ubiquitous Energy develops transparent photovoltaic coatings that enable net-zero façades with integrated signage. Ceres Holographics embeds diffractive waveguides directly inside windshields, eliminating bulky projection optics and shrinking HUD units by 40%. Patent filings related to micro-LED mass transfer have surged, with Samsung and LG Display holding more than 200 active patents, which raises licensing barriers for newcomers.
Strategic cooperation is another theme. The QuadAlliance links optical, adhesive, glass, and Tier-1 automotive expertise to co-develop a turnkey HUD platform. Universal Display provides phosphorescent materials under long-term contracts, locking in revenue while customers secure critical emitters. Regional policy such as US indium tariffs and potential European carbon border taxes incentivize local sourcing, nudging panel makers to diversify supply chains into Vietnam, India, and Mexico.
Transparent Display Industry Leaders
LG Display Co., Ltd.
Samsung Electronics Co., Ltd.
BOE Technology Group Co., Ltd.
AU Optronics Corporation
Sharp Corporation
- *Disclaimer: Major Players sorted in no particular order

Recent Industry Developments
- February 2026: ZEISS, tesa, Saint-Gobain Sekurit, and Hyundai Mobis created the QuadAlliance to commercialize holographic HUDs with a 15-degree vertical field of view, aiming for 2029 mass production.
- November 2025: TCL CSOT commenced construction of a USD 4.15 billion Gen 8.6 inkjet-printed organic light-emitting diode fab in Guangzhou, targeting 2027 ramp-up for large transparent displays.
- October 2025: TCL CSOT disclosed that initial yields at the new fab are projected at 50% during year one and will reach 80% by 2028 as recipes mature.
- September 2025: Visteon and FUTURUS partnered to embed augmented-reality HUDs in mid-tier sedans scheduled for 2027 launch across North America and Europe.


Global Transparent Display Market Report Scope
A transparent display is an electronic display that is a glass screen where the user can see the content while still being able to see through the display. These transparent displays can also be used for augmented reality, a technology that enhances the view using sharp digital images that overlay real ones. They can also be used in building more sophisticated computer screens.
The Transparent Display Market Report is Segmented by Technology (LCD, OLED, Micro-LED, Transparent Projection, Other Technologies), End-User Industry (Retail and Digital Signage, Consumer Electronics and Smart Appliances, Automotive, Aerospace and Defense, Industrial and Enterprise, Others), Application (Interactive Storefronts, HUD, AR Wearables, Smart Windows, Exhibition), Display Size (Less than 10", 10"-39", Greater than or equal to 40"), and Geography (North America, South America, Europe, APAC, Middle East, Africa). Market Forecasts are Provided in Terms of Value (USD).
| LCD |
| OLED |
| Micro-LED |
| Transparent Projection (LCoS / DLP) |
| Other Technologies |
| Retail and Digital Signage |
| Consumer Electronics and Smart Appliances |
| Automotive |
| Aerospace and Defense |
| Industrial and Enterprise |
| Others (Healthcare, Education) |
| Interactive Storefronts and Showcases |
| Head-Up Displays (HUD) |
| Augmented-Reality Wearables |
| Smart Windows and Architectural Glass |
| Exhibition and Museum Installations |
| Less than 10” (Micro) |
| 10” – 39” (Medium) |
| Greater than or equal to 40” (Large) |
| North America | United States |
| Canada | |
| Mexico | |
| South America | Brazil |
| Argentina | |
| Rest of South America | |
| Europe | Germany |
| United Kingdom | |
| France | |
| Italy | |
| Rest of Europe | |
| Asia-Pacific | China |
| Japan | |
| South Korea | |
| India | |
| Rest of Asia-Pacific | |
| Middle East | Saudi Arabia |
| United Arab Emirates | |
| Rest of Middle East | |
| Africa | South Africa |
| Rest of Africa |
| By Technology | LCD | |
| OLED | ||
| Micro-LED | ||
| Transparent Projection (LCoS / DLP) | ||
| Other Technologies | ||
| By End-user Industry | Retail and Digital Signage | |
| Consumer Electronics and Smart Appliances | ||
| Automotive | ||
| Aerospace and Defense | ||
| Industrial and Enterprise | ||
| Others (Healthcare, Education) | ||
| By Application | Interactive Storefronts and Showcases | |
| Head-Up Displays (HUD) | ||
| Augmented-Reality Wearables | ||
| Smart Windows and Architectural Glass | ||
| Exhibition and Museum Installations | ||
| By Display Size | Less than 10” (Micro) | |
| 10” – 39” (Medium) | ||
| Greater than or equal to 40” (Large) | ||
| By Geography | North America | United States |
| Canada | ||
| Mexico | ||
| South America | Brazil | |
| Argentina | ||
| Rest of South America | ||
| Europe | Germany | |
| United Kingdom | ||
| France | ||
| Italy | ||
| Rest of Europe | ||
| Asia-Pacific | China | |
| Japan | ||
| South Korea | ||
| India | ||
| Rest of Asia-Pacific | ||
| Middle East | Saudi Arabia | |
| United Arab Emirates | ||
| Rest of Middle East | ||
| Africa | South Africa | |
| Rest of Africa | ||


Key Questions Answered in the Report
How large is the transparent display market in 2026?
It is valued at USD 4.91 billion in 2026 and is projected to grow rapidly at a 15.84% CAGR through 2031.
Which segment will show the fastest growth to 2031?
Automotive head-up displays are forecast to register the highest 16.29% CAGR as more car models adopt augmented-reality windshields.
What is driving demand for large-format transparent panels?
Retail chains and building owners favor panels 40 inches and above for immersive storefronts and lobby walls that attract customer attention.
How are indium price swings affecting manufacturers?
Prices above USD 400 per kilogram and U.S. tariffs are squeezing margins, compelling panel makers to lock long-term supply contracts or explore alternative conductors.
When will micro-LED panels reach cost parity with OLED?
Industry roadmaps suggest cost parity around 2028 as fluidic self-assembly and laser mass-transfer techniques reach high-volume production.
Page last updated on:


