
Transmission Fluid Market Size and Share
Market Overview
| Study Period | 2020 - 2031 |
|---|---|
| Market Size (2026) | USD 9.03 Billion |
| Market Size (2031) | USD 11.07 Billion |
| Growth Rate (2026 - 2031) | 4.16 % |
| Fastest Growing Market | Asia Pacific |
| Largest Market | Asia Pacific |
| Market Concentration | Medium |
Major Players *Disclaimer: Major Players sorted in no particular order Image © Mordor Intelligence. Reuse requires attribution under CC BY 4.0. | |
Transmission Fluid Market Analysis by Mordor Intelligence
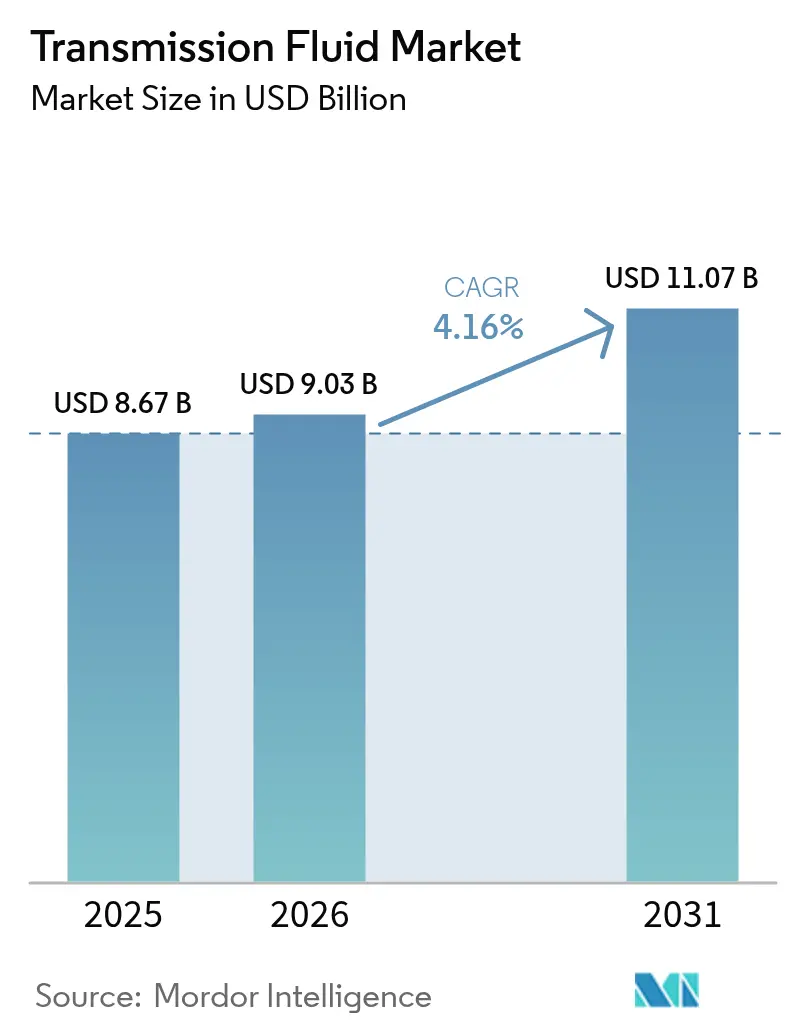
The Transmission Fluid Market size was valued at USD 8.67 billion in 2025 and estimated to grow from USD 9.03 billion in 2026 to reach USD 11.07 billion by 2031, at a CAGR of 4.16% during the forecast period (2026-2031). This steady growth reflects the sector’s move from internal-combustion drivetrains to electrified powertrains, where e-fluids with dielectric properties are priced at a premium even though each vehicle uses less fluid overall. Wet e-motor configurations in battery-electric vehicles also require higher thermal conductivity and electrical compatibility than conventional automatic transmission fluids can deliver. Asia Pacific leads the transmission fluid market supported by China’s more than 50% surge in electric-vehicle output during 2024. Synthetic base-oil formulations, while smaller today, are rising at 5.10% CAGR because OEMs specify polyalphaolefin (PAO) chemistry for extended drain intervals and superior high-temperature stability.
Key Report Takeaways
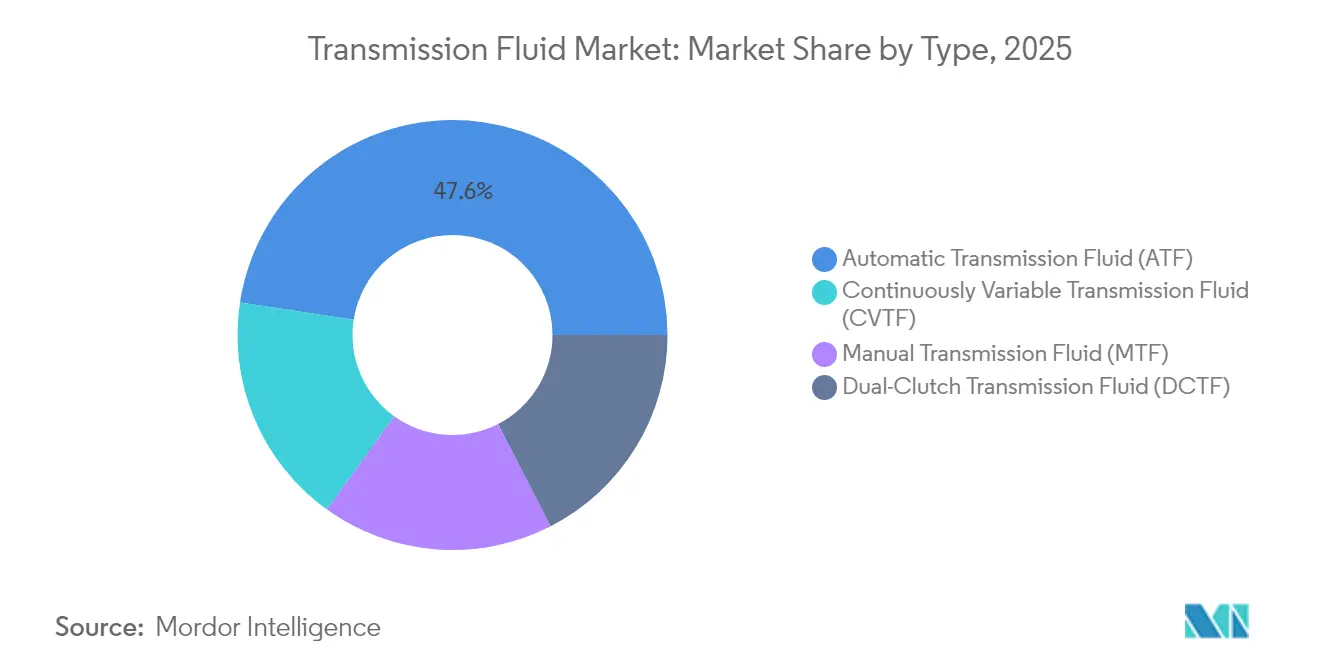
- By product type, Automatic Transmission Fluid led with 47.58% of the transmission fluid market share in 2025, while Dual-Clutch Transmission Fluid posted the highest CAGR at 4.79% through 2031.
- By base oil, mineral oils accounted for 55.92% share of the transmission fluid market size in 2025; synthetic grades are forecast to rise at 5.02% CAGR during 2026-2031.
- By sales channel, OEM factory fills held 64.92% of the transmission fluid market in 2025, whereas the aftermarket is projected to record a 5.83% CAGR to 2031.
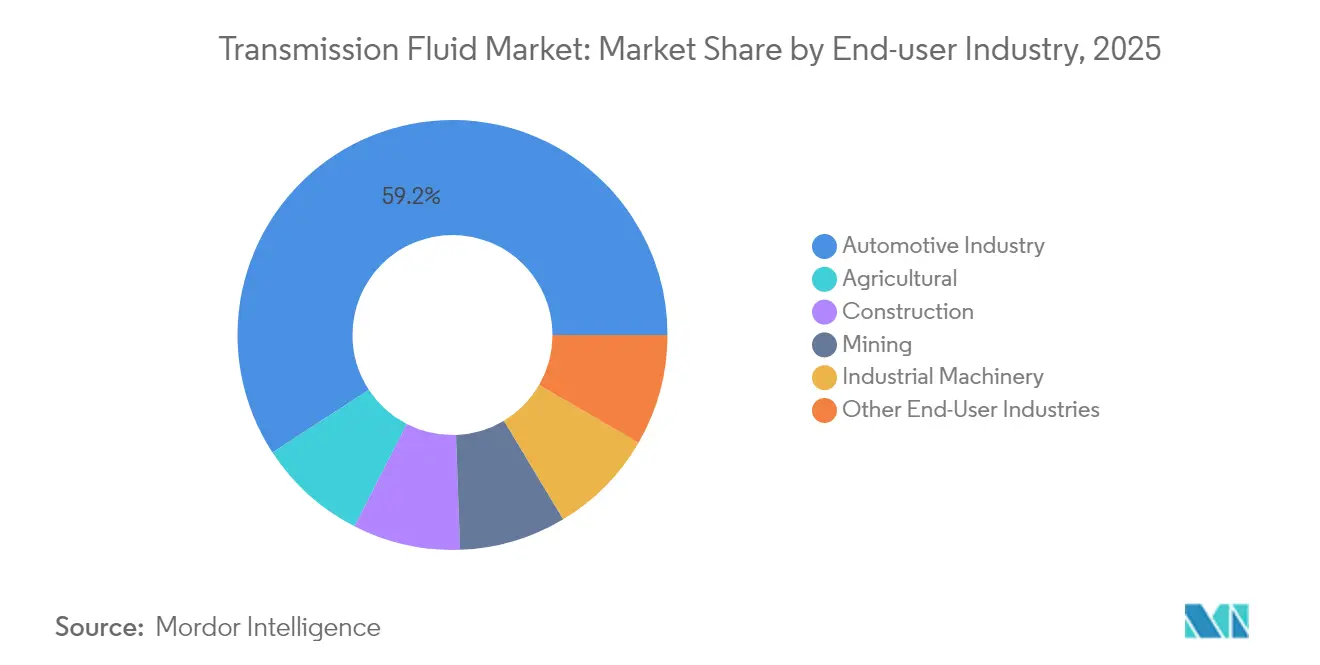
- By end-user industry, automotive accounted for 59.21% of the transmission fluid market size in 2025, and agricultural machinery is set to expand at 5.15% CAGR between 2026-2031.
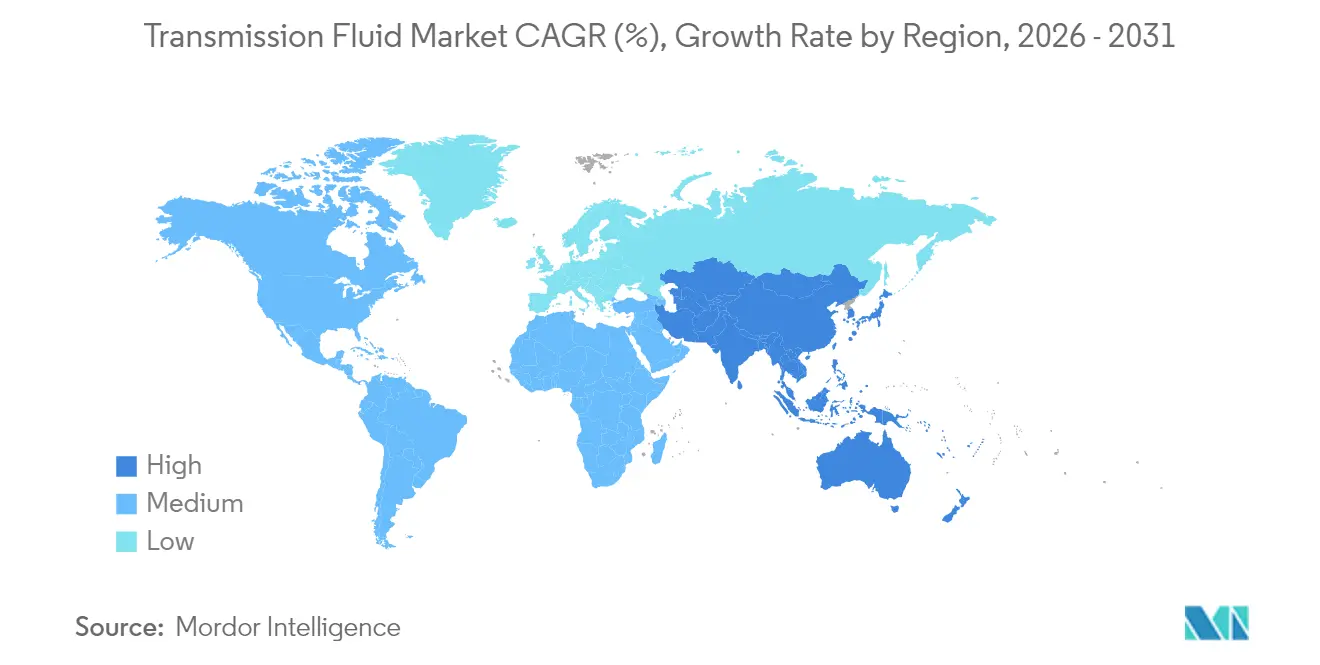
- By geography, Asia Pacific captured 56.02% of the transmission fluid market share in 2025 and is advancing at a 5.16% CAGR through 2031.
Note: Market size and forecast figures in this report are generated using Mordor Intelligence’s proprietary estimation framework, updated with the latest available data and insights as of 2026.
Market Trends and Insights
Drivers Impact Analysis of Transmission Fluid Market*
| Drivers | (~) % Impact on CAGR Forecast | Geographic Relevance | Impact Timeline |
|---|---|---|---|
| Surging global production of automatic and dual-clutch transmission vehicles | +1.5% | Global – APAC leading | Medium term (2-4 years) |
| OEM factory-fill shift to ultra-low-viscosity ATFs | +1.2% | North America and Europe | Short term (≤ 2 years) |
| Electrified powertrains demanding e-fluids with dielectric properties | +0.8% | APAC core, spill-over to North America | Long term (≥ 4 years) |
| Rising vehicle-parc age boosting aftermarket fluid changes | +0.6% | Global – mature markets concentrated | Medium term (2-4 years) |
| Expanding OEM and aftermarket segments | +0.3% | Global | Short term (≤ 2 years) |
| Source: Mordor Intelligence | |||
Surging Global Production of Automatic and Dual-Clutch Transmission Vehicles
Rising consumer preference for effortless shifting is pushing automakers to install automatic and dual-clutch gearboxes in a growing share of new cars. Each DCT requires a fluid that manages wet-clutch friction and gear lubrication simultaneously, and the cost per vehicle can exceed USD 50 compared with roughly USD 25 for a manual-gearbox fill[1]Feature, Society of Tribologists and Lubrication Engineers, stle.org. Hybrids layer further complexity, demanding fluids that tolerate thermal cycling from engines while cooling electric motors. Together, these factors elevate unit-value growth even when overall fluid volumes per vehicle trend downward.
OEM Factory-Fill Shift to Ultra-Low-Viscosity Automatic Transmission Fluids
Fuel-economy mandates are driving carmakers toward ultra-low-viscosity ATFs that cut parasitic losses yet still protect gears and clutches. The incoming ILSAC GF-7 performance category, effective March 2025, requires additive packages that guard against low-speed pre-ignition and deliver additional efficiency gains. This specification accelerates obsolescence for legacy fluids and steers demand toward synthetic formulations capable of 150,000-mile drains. Higher fluid performance lifts average selling prices, offsetting some volume decline linked to longer service intervals.
Electrified Powertrains Demanding E-Fluids with Dielectric Properties
Battery-electric and hybrid drivetrains pose fresh challenges that conventional ATFs cannot meet. E-fluids must manage electrical conductivity to avoid arcing, resist copper corrosion in motor windings, and circulate heat away from high-speed stators. Battery-electric and hybrid drivetrains pose fresh challenges that conventional ATFs cannot meet. E-fluids must manage electrical conductivity to avoid arcing, resist copper corrosion in motor windings, and circulate heat away from high-speed stators.
Rising Vehicle Parc Age Boosting Aftermarket Fluid Changes
The average age of light vehicles in developed regions now exceeds 12 years. Consumers keeping cars longer face transmission rebuild or fluid-exchange decisions, and service centers increasingly recommend synthetic upgrades that can double drain intervals. Pandemic-era delivery delays for new cars further prolonged vehicle retention, reinforcing this aftermarket opportunity. As a result, the aftermarket segment is expected to outpace OEM factory fills through 2030.
Restraints Impact Analysis of Transmission Fluid Market*
| Restraints | (~) % Impact on CAGR Forecast | Geographic Relevance | Impact Timeline |
|---|---|---|---|
| Crude-oil price volatility impacting base-oil costs | -0.7% | Global – OPEC+ refining hubs | Short term (≤ 2 years) |
| Extended OEM drain intervals reducing service-fill volume | -0.5% | North America and Europe | Medium term (2-4 years) |
| Regulatory Complexity and research and development pressure | -0.4% | Global, with stricter enforcement in EU and North America | Long term (≥ 4 years) |
| Source: Mordor Intelligence | |||
Crude-Oil Price Volatility Impacting Base-Oil Costs
Base oils make up 70-80% of finished-fluid cost, leaving margins exposed to feedstock swings. During the first months of the Russia–Ukraine conflict, benchmark crude prices surged more than 50%, prompting multiple lubricant price increases. Although the U.S. Energy Information Administration projects Brent to average USD 79 per barrel in 2025, geopolitical tensions and refining outages can still squeeze independent blenders lacking vertical integration[2]Short-Term Energy Outlook, U.S. Energy Information Administration, eia.gov. Synthetic-base producers face an added layer of risk from alpha-olefin feedstocks that track petrochemical, not crude, supply dynamics.
Extended OEM Drain Intervals Reducing Service-Fill Volume
Heavy-duty truck makers now specify transmission fluid changes at 500,000 miles, while passenger-car intervals commonly reach 60,000-100,000 miles for full synthetics. Sealed-for-life gearboxes eliminate routine service altogether. Consequently, volume growth lags vehicle-parc expansion, compelling suppliers to focus on higher-value formulations that justify premium pricing despite fewer fluid exchanges.
*Our forecasts treat driver/restraint impacts as directional, not additive. The impact forecasts reflect baseline growth, mix effects, and variable interactions.
Transmission Fluid Market Segment Analysis
By Type:
Automatic Transmission Fluid (ATF) Dominance Faces Dual-Clutch Transmission Fluid (DCTF) InnovationAutomatic Transmission Fluid captured 47.58% of 2025 revenue, underscoring decades of global standardization in planetary-gear systems. Dual-Clutch Transmission Fluid, however, is projected to grow at 4.79% CAGR through 2031 as OEMs deploy DCTs that deliver manual-level efficiency with automatic ease. Manual-Transmission and Continuously-Variable Transmission fluids serve niche but steady applications in commercial vehicles and small hybrids. The transmission fluid market size for DCTF is likely to climb sharply as more compact cars adopt wet-clutch dual-gearboxes. Competitive intensity within the transmission fluid market is therefore shifting from legacy ATF blends toward specialized, high-margin DCT formulations.



By Base Oil:
Synthetic Growth AcceleratesMineral oils held 55.92% of 2025 demand, but synthetic formulations are forecast to grow at a 5.02% CAGR as OEMs pursue 0W-20 and 5W-20 viscosity grades unattainable with conventional stocks. The transmission fluid market share commanded by synthetics will widen because PAO and ester chemistries retain film strength at extreme temperatures and resist shear loss. New capacity such as ExxonMobil’s EHC 340 MAX basestock coming online in Singapore in 2025 supports this structural shift toward higher-performance fluids.
Semi-synthetic blends offer a mid-price bridge for fleets transitioning from Group II mineral oils, but pure synthetics are set to dominate factory fills in electrified drivetrains where dielectric strength is non-negotiable. Accordingly, premiumization will help buoy revenue even as overall liters per vehicle decline.
By Sales Channel:
OEM Specifications Drive AftermarketOEM contracts accounted for 64.92% of 2025 volume because transmission suppliers mandate factory-fill approval to secure system warranties. The aftermarket is poised for a 5.83% CAGR, however, as aging fleets and service-interval extensions push owners toward premium synthetic replacements during out-of-warranty maintenance. The transmission fluid market size for the aftermarket will benefit from digital retail platforms that give consumers transparent access to OEM-approved and performance-branded products.
OEMs themselves are entering direct-to-consumer channels, creating “genuine” fluid lines that mirror factory-fill chemistry. This convergence forces traditional distributors to provide value-added diagnostics or bundled services rather than compete on fluid price alone.
By End-User Industry:
Automotive Core Expands Agricultural EdgePassenger cars, light trucks, and commercial vehicles collectively absorbed 59.21% of 2025 demand, positioning automotive as the bedrock of the transmission fluid market. Agriculture is the fastest-growing niche at 5.15% CAGR because modern tractors rely on variable-speed, high-load hydrostatic transmissions that need specialized fluids. Construction and mining equipment prefer extreme-pressure formulations capable of withstanding shock loads, while industrial machinery applications are highly fragmented.
Agricultural OEMs often co-brand fluids with lubricant majors to ensure field-warranty compliance, creating sticky revenue streams less sensitive to automotive sales cycles. This diversification supports overall transmission fluid market resilience during passenger-vehicle downturns.
Geography Analysis
APAC Transmission Fluid Market
Asia Pacific dominated the transmission fluid market with 56.02% revenue share in 2025, propelled by China’s massive vehicle production base and aggressive electric-vehicle adoption targets. The region is forecast to log a 5.16% CAGR through 2031 as domestic brands such as BYD and Geely integrate advanced e-motor cooling circuits that need purpose-designed e-fluids. India’s budding export platform for compact cars furnishes additional volume, while South Korea’s drivetrain research and development underpins high-margin synthetic adoption.
North America Transmission Fluid Market
North America maintains a balanced mix of factory fills and long-drain aftermarket business. EPA emissions rules effective for 2027 model years are steering light-duty OEMs toward lower-viscosity ATFs, which raises synthetic penetration rates. Fleets prioritize total cost of ownership, incentivizing suppliers to prove extended-service benefits in field trials.
Europe and Turkey Transmission Fluid Market
Europe’s market skews toward premium fluids given stringent CO₂ and durability standards. German luxury-car brands favor dual-clutch and hybrid transmissions that command bespoke fluids, while Scandinavian countries’ early EV uptake boosts demand for dielectric e-fluids. Brexit-related logistics realignment has encouraged regional blending capacity to serve continental OEMs more efficiently. Turkey’s role as a production gateway to the Middle East expands regional demand for cost-effective mineral-synthetic blends.
South America and MEA Transmission Fluid Market
South America, and the Middle-East and Africa represent smaller but growing pockets where infrastructure development fuels demand for off-highway equipment fluids. Currency volatility can affect synthetic uptake, yet agricultural mechanization trends in Brazil and South Africa provide long-run growth prospects for specialized formulations.

Regulatory Landscape
Transmission fluid formulations are increasingly shaped by a combination of technical standards and chemical-management rules. SAE International updated SAE J311 in February 2024 for passenger-car automatic transmission fluids, tightening low-temperature Brookfield viscosity (at -40 C) and raising oxidation stability requirements. That direction pushes formulators toward higher-performance base stocks and more robust additive systems to meet modern multi-speed transmission durability needs.
In the European Union, REACH-related measures influence additive and material choices, including restrictions on intentionally added microplastics (Annex XVII, Entry 78, in force since 2023) that can affect certain polymer-containing components used in lubricant formulations and packaging. Industry bodies such as ACEA and UEIL have engaged on the REACH revision discussion during 2025, highlighting compliance and reformulation workload for automotive lubricants, including transmission fluids, as OEMs tighten approval requirements across regions.
Value Chain Analysis
The transmission fluid value chain starts with base oils (Group II/III/III+ and synthetics such as PAO/esters) and a relatively concentrated additive supply layer. A small set of major additive companies, including Afton Chemical, Chevron Oronite, Infineum, and Lubrizol, control key additive technologies and validation know-how used to build OEM-approved ATF, DCTF, and emerging e-fluid packages. As a result, additive selection and qualification remains a central gating step for market entry and product refresh cycles.
Blending and finished-fluid manufacturing are carried out by integrated oil majors and independent lubricant blenders through regional plants, then distributed via OEM factory-fill contracts and service-fill channels (wholesalers, workshops, and growing direct-to-fleet procurement in commercial segments). Logistics disruptions through large hubs (for example Rotterdam and Houston) and single-source exposure for specialized chemistries, such as certain friction modifiers, are common friction points. In these cases, compliance obligations under EU chemical rules can accelerate reformulation and constrain supply options for high-spec, low-viscosity fluids.
Competitive Landscape
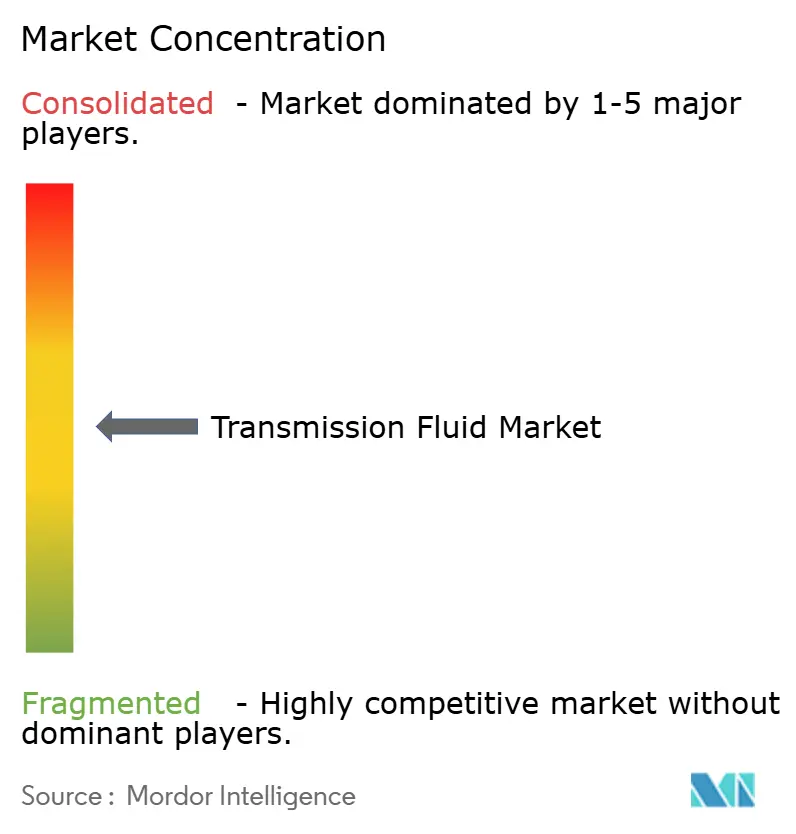
Industry concentration is moderately fragmented. Integrated energy companies, ExxonMobil, Shell, and TotalEnergies, command cost leadership through in-house base-oil production and global blending networks. Mid-tier specialists such as FUCHS leverage application engineering and custom testing to differentiate. Strategic collaborations between transmission OEMs and lubricant suppliers intensify. For instance, ExxonMobil collaborates with leading e-motor manufacturers to co-develop wet-rotor cooling fluids, ensuring first-fill exclusivity. Digital platforms supplying fluid analytics and condition monitoring are emerging as service differentiators that lock in long-term customer relationships.
Transmission Fluid Industry Leaders
BP p.l.c.
Chevron Corporation
Exxon Mobil Corporation
Shell plc
TotalEnergies
- *Disclaimer: Major Players sorted in no particular order
Transmission Fluid Market Companies Covered in this Report
- Afton Chemical
- Amalie Oil Co.
- AMSOIL INC.
- BASF
- BP p.l.c.
- Chevron Corporation
- Exxon Mobil Corporation
- FUCHS
- Idemitsu Kosan Co., Ltd.
- Kemipex
- Motul
- Shell plc
- The Lubrizol Corporation
- TotalEnergies
- Valvoline

Market Opportunities and Future Outlook
Electrification is expanding the performance envelope required from transmission fluids and shifting development toward e-drive unit and transaxle fluids that combine cooling capability, dielectric behavior, and copper and polymer compatibility, alongside very low viscosity. This premium segment is supported by visible OEM and supplier activity, including BP Castrol's Castrol ON EV Transmission Fluids (W2 and W5) introduced in August 2024 and ADDINOL's launch of an EV-focused synthetic transmission fluid (ADDINOL EV Fluid ET) in April 2026. Together, these steps show ongoing commercialization of EV-oriented drivetrain fluids.
Supply-side investment in high-quality base stocks also creates whitespace for suppliers that can secure Group III and advanced synthetic inputs for ultra-low-viscosity ATF and e-fluid formulations. Examples include ExxonMobil's Baytown Refinery Reconfiguration Project (groundbreaking in January 2026), which adds new Group III base oil capacity, and Shell's final investment decision (January 2024) to convert Wesseling in Germany to Group III production, both aligned with the move toward low-viscosity, higher-temperature-stability fluids. These projects, along with expansion moves by regional lubricant manufacturers, such as Mannol's announced production milestone and laboratory upgrades for e-mobility research in February 2026, support opportunities for formulation differentiation, OEM approvals, and localized supply strategies in Asia Pacific, North America, and Europe.
Recent Industry Developments in Transmission Fluid Market
- April 2026: ADDINOL launched ADDINOL EV Fluid ET, a synthetic transmission oil formulated for electric vehicles with requirements around thermal stability, electrical insulation, and cooling. The product adds to the growing set of EV-oriented drivetrain fluids and raises competitive pressure on suppliers to prove dielectric performance and materials compatibility alongside traditional wear protection.
- May 2025: Lubrizol introduced Lubrizol AT9311, a multi-vehicle ATF additive designed for both conventional and hybrid applications and validated for use in 9-speed and 10-speed transmissions. By broadening additive coverage across powertrain types, the launch supports faster formulation updates for blenders serving OEM-spec, ultra-low-viscosity ATF programs.
- November 2024: AMSOIL introduced Signature Series Ultra-Low Viscosity 100% Synthetic automatic transmission fluid for Ford MERCON ULV and GM DEXRON ULV applications. The launch underlines the ongoing shift toward OEM-specified ULV fluids, where meeting tightly defined viscosity and durability requirements can unlock higher-margin service-fill demand.


Transmission Fluid Market Report Scope and Research Methodology
Market Definition and Coverage
For this study, the transmission fluid market covers fluids formulated to lubricate, cool, and protect vehicle and equipment transmission systems. It includes products used in automatic, manual, CVT, and dual-clutch applications across on-road and off-road use.
Scope exclusions: This sizing excludes engine oils, hydraulic fluids that are not specified for transmissions, and greases that are not used as transmission fluids.
Segments Covered in This Report
- By Type
- Automatic Transmission Fluid (ATF)
- Manual Transmission Fluid (MTF)
- Dual-Clutch Transmission Fluid (DCTF)
- Continuously Variable Transmission Fluid (CVTF)
- By Base Oil
- Mineral
- Synthetic (PAO, esters)
- Semi-synthetic
- By Sales Channel
- OEM
- Aftermarket
- By End-User Industry
- Automotive Industry
- Construction
- Mining
- Industrial Machinery
- Agricultural
- Other End-User Industries
- By Geography
- Asia-Pacific
- China
- India
- Japan
- South Korea
- Malaysia
- Thailand
- Indonesia
- Vietnam
- Rest of Asia-Pacific
- North America
- United States
- Canada
- Mexico
- Europe
- Germany
- United Kingdom
- France
- Italy
- Spain
- NORDIC Countries
- Russia
- Turkey
- Rest of Europe
- South America
- Brazil
- Argentina
- Colombia
- Rest of South America
- Middle-East and Africa
- Saudi Arabia
- United Arab Emirates
- Qatar
- Egypt
- Nigeria
- South Africa
- Rest of Middle-East and Africa
- Asia-Pacific
Data Sources, Market Sizing, and Validation
Desk Research
Desk work starts by building a fact base around the vehicle and equipment parc, service intervals, and lubricant demand patterns. We relied on public sources such as the International Organization of Motor Vehicle Manufacturers (OICA) for production, the International Energy Agency for electrification signals, and government transport agencies for fleet indicators and registrations.
We then added trade and industrial context using sources such as UN Comtrade for import and export flows, the US Environmental Protection Agency for emissions policy direction that affects transmission choices, and peer-reviewed lubrication journals for viscosity and drain-interval trends. Company filings and investor presentations were reviewed for product positioning and regional exposure. For company financials and patent databases, we used one paid subscription source to track technology direction. These examples are not exhaustive, and we used additional public and internal reference sources for collection, validation, and clarification.
Primary Interviews and Surveys
Primary work was used to pressure-test the demand pool and pricing logic, especially where public data is not granular enough by transmission type and end use. We spoke with stakeholders across additive suppliers, lubricant blenders, distributors, service networks, and large end users. Inputs were balanced across APAC, EMEA, and the Americas to avoid over-assuming regional drain patterns and product mixes.
Distribution of primary research fieldwork respondents
| Company type | Respondent position | Region |
|---|---|---|
| Top tier: 37% | CXOs: 19% | APAC: 45% |
| Mid tier: 42% | Functional/Unit leaders: 39% | EMEA: 32% |
| Smaller Players: 21% | Managers: 42% | Americas: 23% |
Market-Sizing & Forecasting
Sizing is built using a top-down demand pool approach. Vehicle and equipment parc, average sump fill, drain interval, and service penetration are combined to reconstruct annual fluid consumption, then converted to value using region-level price bands. To make sure totals are not over-modeled, we also run selective bottom-up checks using sampled channel price checks and supplier volume signals, which are then used to tune the final totals.
Key inputs that typically move the model include the share of automatic versus manual and CVT transmissions in the active fleet, average annual mileage or operating hours by use case, the shift toward low-viscosity specifications, and the adoption rate of electrified drivetrains that changes fluid needs (including e-fluid demand where relevant). We also account for regional DIY versus workshop servicing mix. Where direct inputs are missing for smaller countries or niche end uses, proxy indicators are applied from comparable markets, and assumptions are validated again through interviews before being locked.
Forecasts are produced using scenario analysis supported by short time-series smoothing. The scenarios are anchored on expected fleet growth, technology mix shifts, and real-world service behavior shared by experts. The final forecast path is only accepted after it aligns with at least two independent demand signals, such as production trends and the aging vehicle parc profile.
Data Validation & Update Cycle
Outputs are checked in layers so the math and the story match. We compare implied per-vehicle fluid consumption and price realization against independent signals, then investigate outliers, such as sudden mix shifts or unrealistic drain-interval changes, before internal sign-off.
A second review pass confirms that units, currency timing, and regional rollups reconcile cleanly. Follow-up outreach is triggered when assumptions change materially. The report is refreshed annually, with interim revisions when major policy, technology, or trade events meaningfully affect the demand pool. Before delivery, the latest data points are re-checked so clients receive an updated view.
Mordor Intelligence's Transmission Fluid Market Sizing Compared With Other Published Estimates
Published market sizes for transmission fluid do not always line up because the counted products, the end-use boundary, and the way pricing is averaged can vary across publishers. Differences can also come from whether a study uses a true in-use demand pool (parc and drain behavior) or relies more on production or sales-led shortcuts.
The benchmark table shows a noticeable spread. In Mordor Intelligence's model, the total is built from an in-use consumption base that includes automotive and off-road end users, while keeping the scope limited to transmission-specific fluids (including CVT and dual-clutch categories) rather than folding in adjacent drivetrain lubricants.
Benchmark comparison
| Source | Market Size | Gaps in Research Methodology |
|---|---|---|
| Mordor Intelligence | USD 9.03 B (2026) | |
| Industry Research Publisher A | USD 9.90 B (2025) | Uses a different base year and often applies broader application grouping, which can shift totals if off-road coverage and product mapping to transmission-only fluids are not kept consistent across regions. |
| Global Publisher B | USD 8.83 B (2025) | Reports a different year and can understate value if pricing is averaged at a high level without adjusting for regional synthetic mix and service-channel price differences. |
Looking at the three figures together, most of the gap can be traced back to year selection, how tightly transmission-only products are defined, and how price bands reflect the synthetic share by region. By keeping the demand pool tied to parc, service behavior, and realistic price realization, the resulting market value stays explainable and repeatable when assumptions are updated.


Key Questions Answered in the Report
What is the current value of the transmission fluid market?
The transmission fluid market size stood at USD 9.03 billion in 2026.
How fast is the market expected to grow?
Industry revenues are projected to rise at a 4.16% CAGR during 2026-2031, reaching USD 11.07 billion by 2031.
Which region leads global demand?
Asia Pacific accounted for 56.02% of global sales in 2025 and is also the fastest-growing region at 5.16% CAGR.
What product segment is expanding the quickest?
Dual-Clutch Transmission Fluid is forecast to post the highest segment CAGR of 4.79% through 2031.
Why are synthetic base oils gaining share?
Synthetic formulations deliver longer drain intervals, better high-temperature stability, and necessary dielectric properties for electric drivetrains, driving a 5.02% CAGR for synthetics.
Page last updated on:





