
Market Overview
| Study Period | 2020 - 2031 |
|---|---|
| Market Size (2026) | USD 12.21 Billion |
| Market Size (2031) | USD 14.71 Billion |
| Growth Rate (2026 - 2031) | 3.79 % |
| Fastest Growing Market | Asia Pacific |
| Largest Market | Asia Pacific |
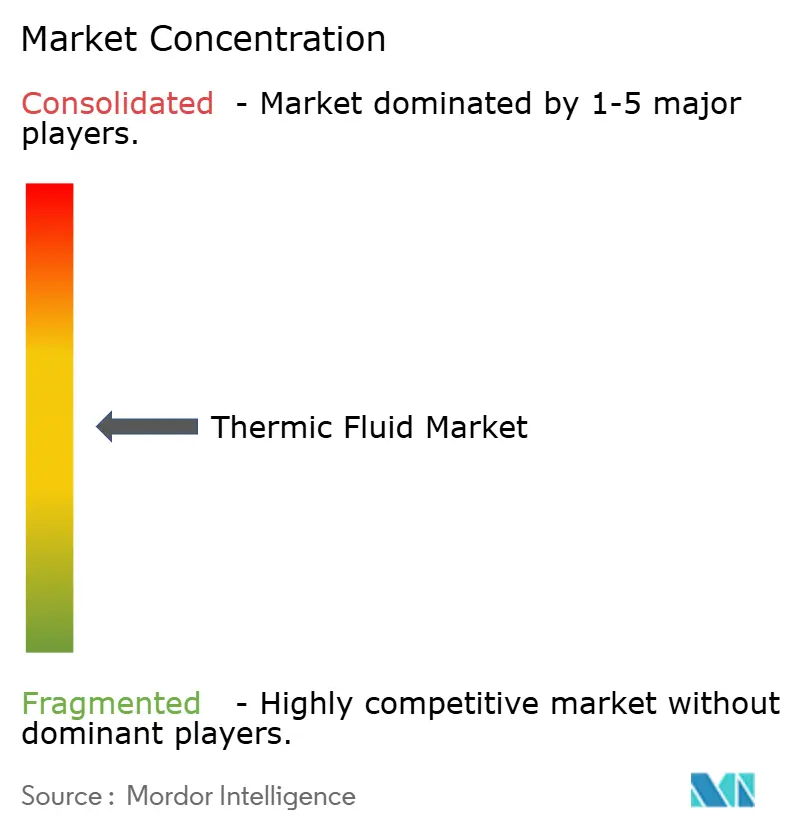
| Market Concentration | Medium |
Major Players *Disclaimer: Major Players sorted in no particular order Image © Mordor Intelligence. Reuse requires attribution under CC BY 4.0. | |
Thermic Fluid Market Analysis by Mordor Intelligence
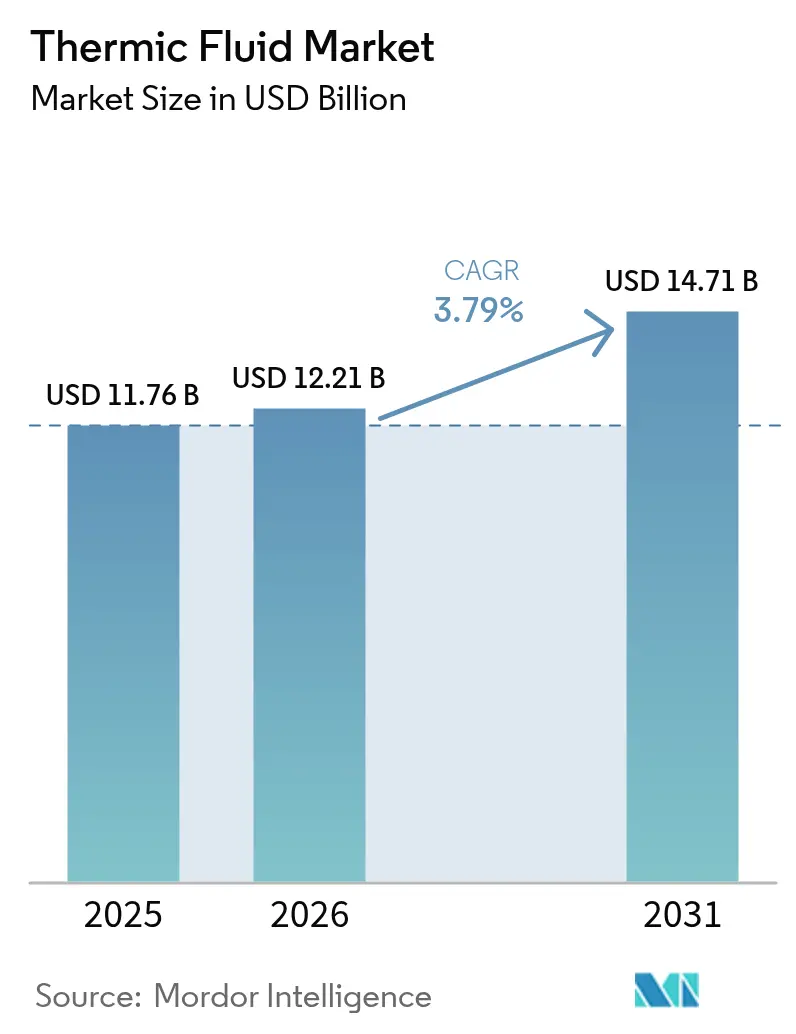
The Thermic Fluid Market size was valued at USD 11.76 billion in 2025 and estimated to grow from USD 12.21 billion in 2026 to reach USD 14.71 billion by 2031, at a CAGR of 3.79% during the forecast period (2026-2031). Medium-temperature applications (150-300 °C) continue to anchor demand by serving diverse industries, while high-temperature uses (greater than 300 °C) record the briskest 4.84% CAGR as concentrated solar power (CSP) and advanced chemical processing scale up. Asia-Pacific retains leadership through robust refining throughput, new petrochemical complexes and accelerating renewable projects. Mineral oils still command the largest slice, yet synthetics and glycols gain rapid traction where regulatory pressure, safety needs and energy efficiency outweigh cost. Integrated oil majors and specialty chemical firms expand capacity, pursue acquisitions and release differentiated fluids that answer data-center, food-grade and CSP specifications. Supply-chain resilience programs and stricter emissions standards reshape sourcing strategies, but the thermic fluids market continues to diversify, limiting exposure to cyclical downturns in legacy oil and gas.
Key Report Takeaways
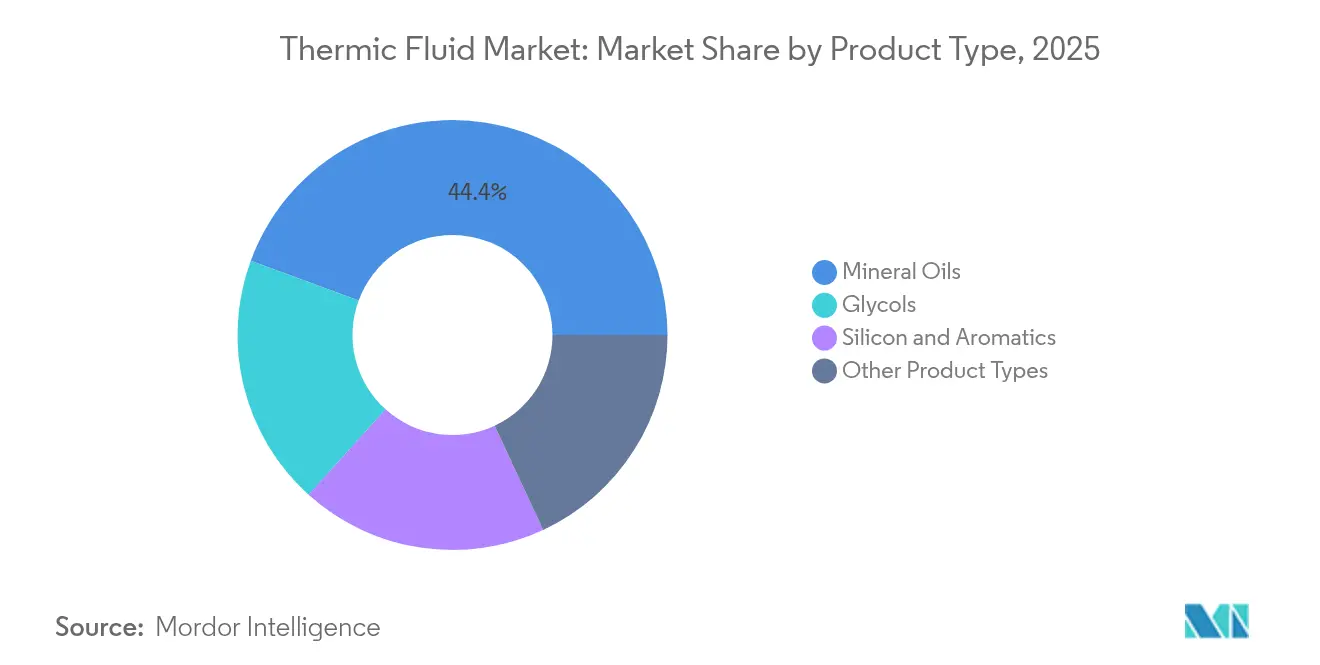
- By product type, mineral oils held 44.38% share of the thermic fluids market size in 2025; glycols are forecast to post the fastest 4.05% CAGR through 2031.
- By temperature range, medium-temperature applications captured 51.88% of the thermic fluids market share in 2025. High-temperature applications are projected to advance at a 4.67% CAGR to 2031.
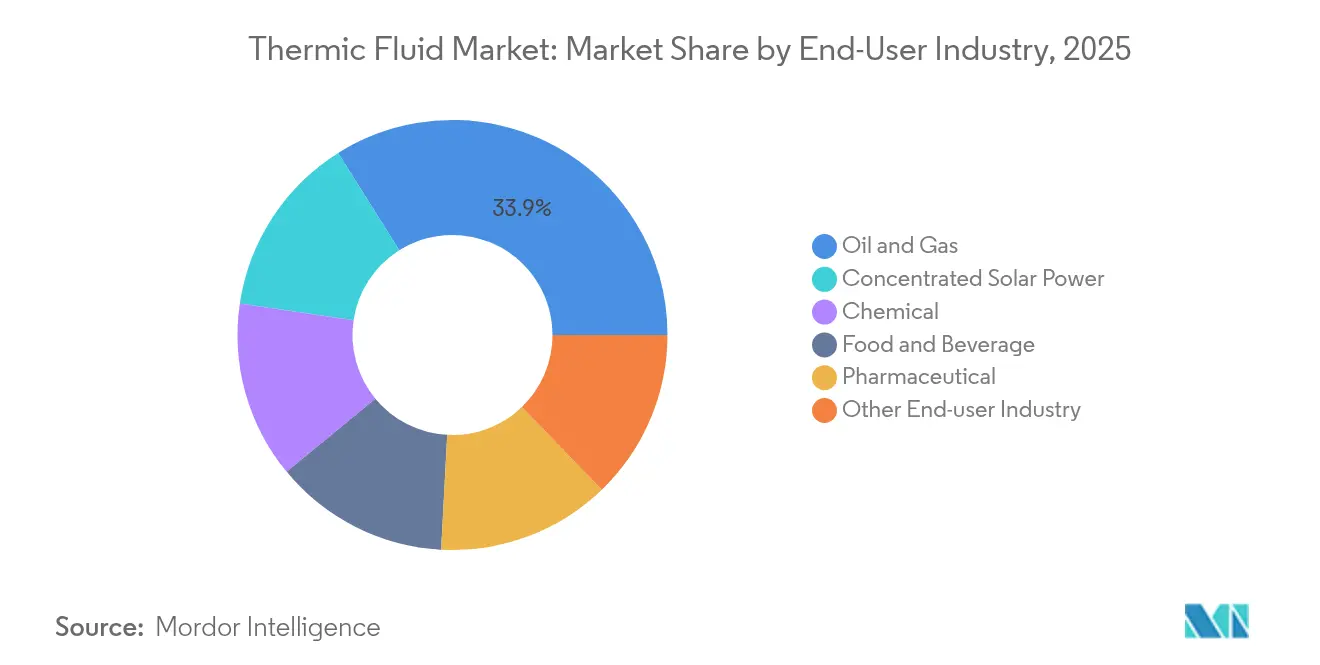
- By end-user industry, oil and gas accounted for 33.92% of the thermic fluids market size in 2025; concentrated solar power is set to grow at a 5.05% CAGR between 2026-2031.
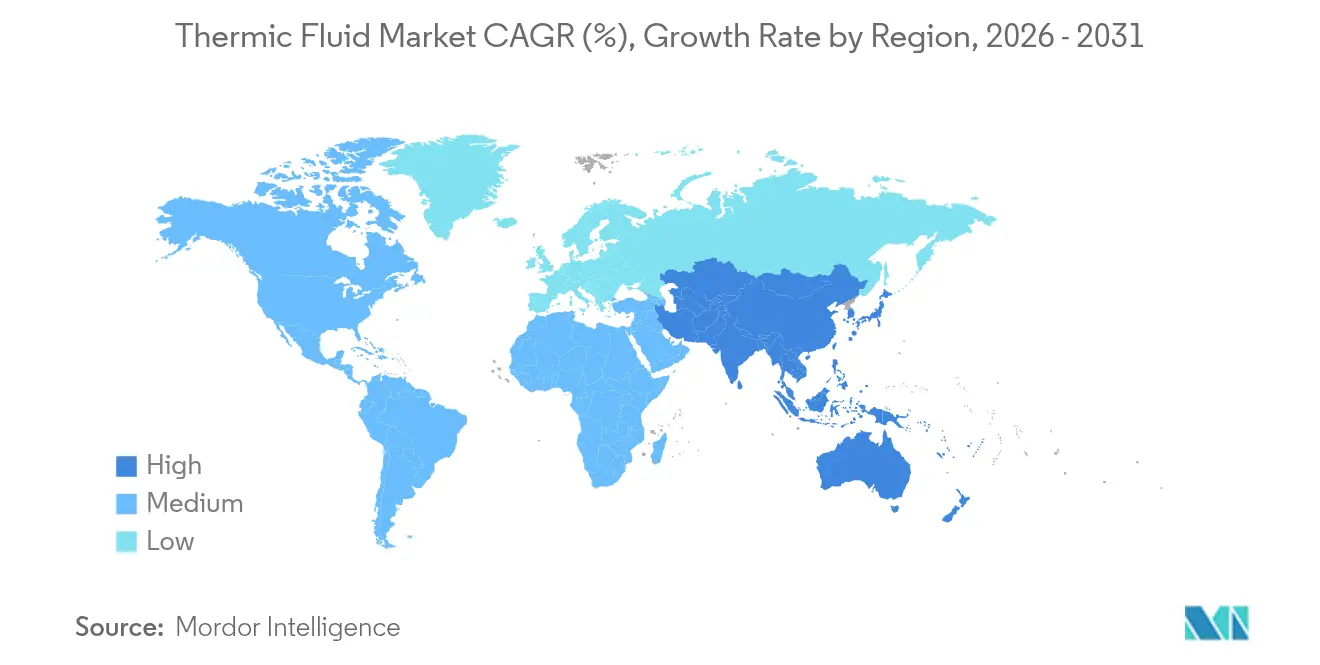
- By geography, Asia-Pacific led with a 37.40% thermic fluids market share in 2025 and is expanding at a 4.42% CAGR through 2031.
Note: Market size and forecast figures in this report are generated using Mordor Intelligence’s proprietary estimation framework, updated with the latest available data and insights as of 2026.
Market Trends and Insights
Drivers Impact Analysis of Thermic Fluid Market*
| Driver | (~) % Impact on CAGR Forecast | Geographic Relevance | Impact Timeline |
|---|---|---|---|
| Extensive demand from oil & gas | +1.20% | Global, with concentration in North America, Middle East, and Asia-Pacific | Medium term (2-4 years) |
| Growing adoption in concentrated solar power | +0.80% | Global, with early gains in India, Algeria, and southwestern United States | Long term (≥ 4 years) |
| Expansion in chemical & petrochemical processing | +0.90% | Asia-Pacific core, spill-over to North America and Europe | Medium term (2-4 years) |
| Food-grade formulations gain traction | +0.40% | North America and Europe, expanding to Asia-Pacific | Short term (≤ 2 years) |
| Data-center immersion cooling uptake | +0.60% | Global, with concentration in North America, Europe, and Asia-Pacific tech hubs | Short term (≤ 2 years) |
| Source: Mordor Intelligence | |||
Extensive demand from oil & gas
Heat-transfer duties in modern refineries have grown more complex as operators chase higher conversion rates and lower emissions. China’s throughput of 14.8 million bpd in 2023 illustrates sustained appetite for high-temperature synthetic fluids capable of stable service beyond 380 °C. ExxonMobil’s Singapore resid-upgrade project, due in 2025, will add 20,000 bpd of base stocks tuned for premium thermic fluids, targeting stringent Asian specifications. EPA Subpart OOOOb, enforced from May 2024, mandates zero-emission pneumatic equipment, nudging operators toward low-volatility, longer-life formulations that curb fugitive leaks. These shifts reinforce a two-tier market where synthetic blends command premium pricing while mineral oils retain price-sensitive niches.
Growing adoption in concentrated solar power
CSP plants see thermic fluids as a core storage medium enabling 24-hour renewable power. India’s 500 GW non-fossil goal underlines this outlook, and long-duration storage via molten salt or advanced silicone fluids is now integral to project economics. Laboratory work shows platinum-nanoparticle silicone fluids boosting plant efficiency by 44% at 425 °C without the toxicity concerns linked to legacy aromatics. Algeria’s CSP tower plants record levelized costs of USD 0.097/kWh, validating commercial feasibility and driving demand for high-temperature, low-degradation fluids. Thermal energy storage capacity is forecast to triple this decade, widening the downstream pull on innovative heat-transfer media[1].
Expansion in chemical & petrochemical processing
Regionalized supply chains and specialty-chemical focus demand tighter temperature control and cleaner operations. BASF’s USD 10 billion Zhanjiang complex, operational from late 2025, relies on renewable electricity and circular feedstocks, creating a premium for environmentally compatible fluids able to cycle between diverse reactors and exchangers. Chevron Oronite’s Ningbo expansion, finishing in 2026, mirrors the push to locate additive production near Asian OEMs while meeting strict purity standards. Specialty-chemical output favors synthetic fluids with wider thermal windows and lower vapor pressure, driving substitution away from commodity mineral oils.
Food-grade formulations gain traction
In food and pharmaceutical processes, incidental-contact rules supersede cost concerns. NSF HT-1 certification has become non-negotiable, prompting suppliers like Caldera to release purified white-oil blends for bakery ovens and extruders. Eastman’s Therminol XP offers FDA-compliant purity and stable operation to 315 °C, bridging the gap between mineral and synthetic options in edible-oil frying and aseptic packaging. Pharmaceutical plants adopt the same fluids for -115 °C lyophilization to 230 °C reaction steps, enlarging the customer base. Competitive advantage hinges on documented traceability and rapid supply as global processors internalize hygiene and energy mandates.
Restraints Impact Analysis of Thermic Fluid Market*
| Restraint | (~) % Impact on CAGR Forecast | Geographic Relevance | Impact Timeline |
|---|---|---|---|
| Volatile raw material pricing | -0.70% | Global, with acute impact in Asia-Pacific manufacturing centers | Short term (≤ 2 years) |
| Safety & environmental concerns over aromatics | -0.50% | North America and Europe, expanding to Asia-Pacific | Medium term (2-4 years) |
| Strict VOC regulations on mineral oils | -0.30% | North America and Europe, with emerging impact in Asia-Pacific | Long term (≥ 4 years) |
| Source: Mordor Intelligence | |||
Volatile raw material pricing
Rapid capacity additions outpaced demand after 2022, squeezing petrochemical margins and swinging base-oil prices. Clean-tech spending topping USD 2.8 trillion diverts naphtha feedstocks toward polymers for batteries and solar panels, tightening supply for thermic fluid producers. Caustic-soda shortages complicate de-acidification steps critical to fluid stability. Firms hedge exposure through vertical integration—Chevron’s pursuit of Phillips 66’s chemical stake exemplifies efforts to secure in-house feed—notwithstanding steep capital commitments.
Safety & environmental concerns over aromatics
EU REACH amendments effective September 2025 expand bans on CMR aromatics, forcing reformulation away from legacy heat-transfer blends. California’s PFAS rule AB 347 will require manufacturer registration by 2029, signaling broader scrutiny of fluorinated additives. OSHA’s July 2024 Hazard Communication update pushes clearer labeling, increasing compliance overhead[2]. Eastman’s Therminol FF synthetic flush with higher flash point addresses aromatics-phaseout needs while ensuring system cleanliness.
*Our forecasts treat driver/restraint impacts as directional, not additive. The impact forecasts reflect baseline growth, mix effects, and variable interactions.
Thermic Fluid Market Segment Analysis
By Product Type:
Synthetics challenge mineral-oil dominanceMineral oils remained the volume leader with 44.38% share in 2025, yet tightening VOC caps shrink their cost edge. Glycols, propelled by food-grade and server-farm demand, are growing 4.05% CAGR, narrowing the gap with hydrocarbons. Eastman’s Therminol FF and Dow’s SYLTHERM silicone line evidence a shift toward broad-temperature synthetics able to run from -40 °C to 400 °C, lengthening service life and boosting uptime. Nanoparticle-infused silicone prototypes raise conductivity by 24% at 200 °C, underscoring how R&D differentiates suppliers. As a result, the thermic fluids market sees larger customers specify synthetic alternatives during turnaround cycles, even when upfront prices rise.
Premium synthetics widen addressable niches in CSP, specialty chemicals and immersion cooling. Silicon and aromatic blends occupy high-temperature or narrow-boiling-range duties where mineral oils break down. New categories, such as platinum-doped silicone oils for 425 °C service, illustrate rapid progress.

By Temperature Range:
High-temperature applications drive innovationMedium-temperature systems supplied 51.88% of the thermic fluids market size in 2025, reflecting adoption across fryers, press-lines and batch reactors. Mineral-oil incumbency keeps cost low, maintaining preference where duty cycles and regulations permit. Conversely, greater than 300 °C loops exhibit the fastest 4.67% CAGR as CSP towers, residue hydrocrackers and high-severity polymer units proliferate. Eastman’s Therminol VP-1 operates vapor-phase to 400 °C, showing how synthetics displace costly molten salts in moderate ranges.
Research into polydimethylsiloxane carriers proves viability at 425 °C with lower toxicity, pointing to future crossover into industrial furnaces. The low-temperature less than 150 °C niche stays small but essential for pharma freeze-drying and environmental test chambers. Suppliers bundle glycol-water premixes with corrosion inhibitors to address condensation and biological fouling. Each cluster sharpens the segmentation of the thermic fluids market, fostering specialized supply contracts that mitigate commoditization.
By End-User Industry:
Energy transition reshapes demandOil and gas processes held 33.92% thermic fluids market share in 2025, notching replacement-driven volume but muted growth as refineries streamline energy intensity. CSP plants gain fastest at 5.05% CAGR, helped by policy targets and grid-storage economics that favor molten-salt or silicone thermal reservoirs. Chemical complexes sustain mid-single-digit growth tied to specialty chemical output, whereas food and beverage processors lift demand for NSF-certified fluids.
Data centers, though classified within industrial utilities, constitute an emergent vector as immersion cooling adoption rises from 10% in 2024 toward 20% in 2025. Chemours’ partnership with Navin Fluorine to produce two-phase liquids from 2026 underlines cross-industry talent sharing. Taken together, newer verticals fragment demand and lessen reliance on fossil-fuel cycles, supporting balanced expansion of the thermic fluids market.
Geography Analysis
APAC Thermic Fluid Market
Asia-Pacific owned 37.40% thermic fluids market share in 2025 and is advancing at a 4.42% CAGR through 2031, underpinned by China’s 14.8 million bpd crude runs, BASF’s Zhanjiang megasite and India’s CSP rollout. Policy incentives and local supply chains reinforce regional sales, although reshoring trends encourage multi-country diversification.
North America and Europe Thermic Fluid Market
North America and Europe rely on technology leadership and tight regulations to pull in higher-margin synthetics. EPA methane rules and EU REACH updates accelerate substitution away from aromatic mineral oils. ExxonMobil’s Singapore base-stock addition illustrates North American firms manufacturing in Asia yet retaining IP dominance.
South America, MEA and Oceania Thermic Fluid Market
South America, Middle East and Africa present emerging possibilities as energy infrastructure scales. Algeria’s CSP economics validate demand for 400 °C fluids, while Gulf refiners invest in residue conversion that needs stable heat carriers. Political risk and logistics gaps temper uptake, but governmental supply-chain resilience programs, such as Australia’s critical-minerals initiative, highlight a pivot toward diversified sourcing.
Regulatory Landscape
Regulation is increasingly shaping formulation choices for high-temperature and low-volatility thermic fluids, with the tightest pressure concentrated in Europe and the United States. In the EU, the European Commission advanced work in 2026 on restricting partly hydrogenated terphenyl (PHT, CAS 61788-32-7) under REACH Annex XVII, with a consultation closing on July 7, 2026 and adoption referenced for Q4 2026 in the evidence pack. This creates compliance urgency for suppliers and users of certain synthetic heat-transfer chemistries used in industrial closed-loop systems.
In the United States, EPA administration of TSCA continues to influence data and documentation requirements for thermic fluid ingredients and additive packages. A final rule published in 2026 extended the TSCA Section 8(d) Health and Safety Data Reporting Rule submission deadline to May 21, 2027 for covered substances, reinforcing the need for stronger SDS dossiers, substance traceability, and upstream supplier engagement. Alongside these requirements, the report context also highlights safety and labeling obligations (for example, OSHA hazard communication updates) that raise the cost of non-compliant aromatic or poorly characterized blends, which in turn accelerates substitution toward certified, lower-risk formulations in regulated end uses.
Value Chain Analysis
The thermic fluids value chain starts with feedstocks and intermediates (mineral base oils from crude distillation, synthetic hydrocarbons such as PAO, glycols, and silicone monomers) and then moves through formulation, blending, testing, packaging, and distribution into OEMs and end users operating closed-loop heat-transfer systems. Large players with broad manufacturing footprints and application laboratories can link production to qualification support; Eastman, for instance, positions Therminol production across multiple continents to support multi-region continuity for chemical processing, refining, food-grade operations, and CSP projects.
Downstream, channel strength and technical service capability are central to customer retention because thermic fluids are sold with commissioning support, condition monitoring, drain-and-fill planning, and system flush services that lower downtime risk. Logistics and storage infrastructure matter for both bulk and packaged delivery, particularly in major industrial corridors. Regulatory compliance documentation (REACH/TSCA) and end-use certifications (such as NSF HT-1 in food) add additional gating steps that influence supplier selection. Vertical integration into key inputs (for example, PAO base stocks produced by Chevron Phillips Chemical) and tighter coordination with equipment OEMs and EPCs help suppliers control quality, secure long-term contracts, and reduce exposure to feedstock volatility.
Competitive Landscape
The competitive field is moderately fragmented. BASF, Eastman and Dow maintain global networks and invest heavily in R&D; BASF earmarked USD 19.5 billion for 2024-2027 projects to protect share. ExxonMobil and Chevron deploy integration advantages, with the Singapore resid project and the bid for Phillips 66’s chemical arm showcasing feedstock control. Mid-tier players launch niche solutions: Castrol’s PG 25 for direct-to-chip loops and Sulzer’s molten-salt thermal storage partnership diversify product scopes.
Technology and compliance rather than raw price dictate differentiation. Eastman’s flush fluid introduces a new maintenance category, while Dow’s tie-up with Carbice addresses thermal interface materials for electronics. Partnerships between chemical suppliers and equipment OEMs shorten qualification cycles and lock in long-term volumes across the thermic fluids market.
Start-ups attract venture capital for modular thermal storage, signaling fresh competitive pressure at system level. Nevertheless, barriers remain steep: certifications, plant audits and after-sales engineering favor incumbents. Overall, competition coalesces around integrated value-chain control, environmental compliance and lifecycle performance guarantees.
Thermic Fluid Industry Leaders
-
BP plc
-
Dow
-
Eastman Chemical Company
-
Exxon Mobil Corporation
-
Shell plc
- *Disclaimer: Major Players sorted in no particular order
Thermic Fluid Market Companies Covered in this Report
- BASF SE
- BP plc
- Caldera
- Chevron Corporation
- Clariant
- Dow
- Duratherm Extended Life Fluids
- Eastman Chemical Company
- Exxon Mobil Corporation
- Global Heat Transfer
- HP Lubricants
- MultiTherm LLC
- Paratherm
- Radco Industries, LLC
- Shell plc
Market Opportunities and Future Outlook
A key opportunity area is high-temperature synthetic fluids that remain stable beyond 300 C, with demand linked to CSP buildouts and higher-severity chemical processing. The report context connects this pull to CSP economics and policy targets, including India’s 500 GW of non-fossil capacity, and to commercial validation signals such as Algeria CSP tower projects reporting levelized costs around USD 0.097/kWh. Together, these factors support continued procurement of advanced heat-transfer media, including silicone-based and other low-degradation options suited to thermal storage loops.
A second whitespace area is compliance-driven substitution in documentation-heavy end uses, where regulatory actions and certification requirements narrow the set of acceptable chemistries. EU REACH work in 2026 on a restriction proposal for partly hydrogenated terphenyl (PHT) and ongoing scrutiny of additional high-temperature heat-transfer fluid substances create room for suppliers that can provide compliant alternatives, validated conversion pathways, and robust traceability. The innovation pipeline also extends to next-generation fluids for demanding thermal management niches: academic work published in July 2025 reported ionic-liquid based IoNanofluids with 21-40% thermal conductivity improvements, and a Japan Patent Office publication in June 2026 described a novel heat-transfer fluid composition based on hexafluoropropene trimer. These disclosures point to active R&D focused on higher stability and performance while working within evolving chemical safety constraints.
Recent Industry Developments in Thermic Fluid Market
- May 2026: The US Environmental Protection Agency published a final rule extending the TSCA Section 8(d) Health and Safety Data Reporting Rule submission deadline to May 21, 2027 for covered substances. The extension keeps compliance programs active for chemical suppliers and formulators, reinforcing the need for stronger health-and-safety data governance and upstream coordination across thermic-fluid ingredient supply chains.
- September 2025: EU institutions continued execution of the REACH restriction roadmap, reinforcing the direction of travel toward tighter controls on hazardous substance classes used across industrial chemistries. For thermic fluid suppliers, this regulatory momentum increases reformulation and portfolio-screening activity, particularly for high-temperature synthetic blends where substance selection and documentation determine qualification timelines.
- December 2024: Castrol (BP plc) introduced Castrol ON Direct Liquid Cooling PG 25, a propylene glycol-based fluid engineered for direct-to-chip cooling in high-performance data centers. The launch broadened thermic fluid demand into electronics thermal management and supported the shift toward purpose-built, higher-purity fluids sold with application support rather than commodity-only pricing.
Thermic Fluid Market Report Scope and Research Methodology
Market Definition and Coverage
In this methodology, the thermic fluid market refers to heat transfer fluids sold for indirect heating and cooling loops used to move and control process heat in industrial equipment and systems.
Scope exclusions: This sizing does not count heat-exchange equipment, direct-fired fuels, steam as a utility, or refrigeration and cryogenic coolants.
Segments Covered in This Report
- By Product Type
- Mineral Oils
- Silicon and Aromatics
- Glycols
- Other Product Types
- By Temperature Range
- Low Temperature (less than 150 °C)
- Medium Temperature (150-300 °C)
- High Temperature (greater than 300 °C)
- By End-user Industry
- Chemical
- Oil and Gas
- Food and Beverage
- Pharmaceutical
- Concentrated Solar Power
- Other End-user Industry
- By Geography
- Asia-Pacific
- China
- India
- Japan
- South Korea
- Rest of Asia-Pacific
- North America
- United States
- Canada
- Mexico
- Europe
- Germany
- United Kingdom
- France
- Italy
- Russia
- Rest of Europe
- South America
- Brazil
- Argentina
- Rest of South America
- Middle East and Africa
- Saudi Arabia
- South Africa
- Rest of Middle East and Africa
- Asia-Pacific
Data Sources, Market Sizing, and Validation
Desk Research
Desk work was used to set the boundaries of what qualifies as thermic fluid revenue and to build realistic demand drivers by end-use operations. We relied on public references such as UN Comtrade trade statistics for base fluid flows, U.S. Energy Information Administration indicators for refinery and energy activity, U.S. EPA and EU REACH guidance for fluid handling and compliance context, and technical literature in peer-reviewed chemical engineering journals on temperature windows and degradation behavior.
To convert industry activity into fluid demand, we also reviewed company annual reports and product technical data sheets, association and standards materials such as ASTM method references, and credible news coverage on plant investments and outages. Where needed, a paid subscription covering company financials and a shipment-level import/export dataset were used to cross-check supplier presence and approximate pricing bands. These desk sources are illustrative only, and additional public documents were used for data collection, validation, and clarification during the research.
Primary Interviews and Surveys
Primary work focused on confirming how thermic fluids are procured, how often systems are drained or topped up, and how pricing moves with feedstock and performance grades. We spoke with a mix of producers, distributors, and plant-side users (maintenance and utilities teams) across major process industries, then used follow-up calls to stress-test assumptions when desk sources were thin or contradictory.
Distribution of primary research fieldwork respondents
| Company type | Respondent position | Region |
|---|---|---|
| Top tier: 28% | CXOs: 15% | APAC: 42% |
| Mid tier: 54% | Functional/Unit leaders: 34% | EMEA: 34% |
| Smaller Players: 18% | Managers: 51% | Americas: 24% |
Market-Sizing & Forecasting
The core model starts from a top-down demand pool, where process-industry operating activity is translated into circulating fluid volumes and annual replacement or top-up needs, then priced using grade-specific average selling prices. Totals were corroborated using selective bottom-up checks, including sampled supplier revenue splits, distributor channel feedback, and volume times ASP sanity tests for key end-use clusters, and then adjusted when mismatches were consistently observed.
Inputs used in the model include indicative installed heat-transfer loop intensity in chemical and refining sites, temperature-range mix (low, medium, and high temperature service), typical drain and refill intervals versus top-up behavior, feedstock-linked cost pass-through timing, and regional industry utilization cycles that affect make-up consumption. Where primary inputs were incomplete, gaps were handled by applying conservative ranges drawn from similar industrial fluids and then tightening those ranges through follow-up validation.
For forecasting, scenario analysis was applied around a baseline path, since demand is influenced by a small set of practical drivers that can shift with industrial cycles. The baseline scenario assumes steady process throughput, gradual mix shift toward higher performance fluids, and normalized replacement intervals, with the scenario bands set after checking consensus views from field respondents.
Data Validation & Update Cycle
Outputs are checked against independent signals, such as process industry activity indicators, trade movement direction, and whether implied per-site consumption stays within realistic operating ranges. When a region or end-use shows an unusual swing, the drivers are rechecked, then relevant assumptions are reworked and revalidated through additional outreach before sign-off.
Each report version goes through multi-step analyst reviews to confirm scope alignment, unit consistency, and currency conversion logic. The study is refreshed annually, and interim updates are triggered when material events occur, such as sharp feedstock shifts, major capacity additions, or regulatory changes impacting allowable fluid chemistries. Before delivery, we complete a final pass so clients receive the latest updated view.
Mordor Intelligence's Thermic Fluid Market Sizing Compared With Other Published Estimates
Published numbers for thermic fluids often do not line up, and this usually comes from timing and modeling choices rather than one simple mistake. Differences show up around which year is treated as the current benchmark, how prices are averaged across a year with volatile inputs, and how tightly the counted revenues are limited to fluids (instead of nearby thermal management items).
In practice, the spread is often driven by how frequently assumptions are refreshed, how currency conversion timing is handled for multi-region totals, and whether ASPs are built from grade mix versus a single blended price. When quarterly price moves are smoothed and rechecked using replacement behavior and operating rates, the estimate stays closer to real purchase patterns. This discipline is reflected in the refresh cadence and validation checks used by Mordor Intelligence.
Benchmark comparison
| Source | Market Size | Gaps in Research Methodology |
|---|---|---|
| Mordor Intelligence | USD 12.21 B (2026) | |
| Industry Publisher A | USD 12.07 B (2025) | This figure is anchored to a 2025 base year, so the gap can reflect different currency timing and a different way of averaging prices across the year, especially when feedstock-linked ASPs move quickly. |
| Industry Publisher B | USD 11.80 B (2025) | The estimate uses a 2025 benchmark and can differ based on how replacement cycles are converted into annual demand and whether higher-temperature and specialty grades are priced with a mix-based ASP or treated as part of a blended average. |
Looking across the table, the biggest explanation is not the long-term trend, but the near-term mechanics, namely the chosen benchmark year and the way prices and conversions are timed. By tying volumes to realistic top-up and drain behavior and then aligning ASPs to grade mix, the resulting number is easier to trace back to clear inputs and repeatable checks.
Key Questions Answered in the Report
What is the current size of the thermic fluids market?
The thermic fluids market size is USD 12.21 billion in 2026.
Which temperature range segment is growing fastest?
High-temperature applications above 300 °C show the highest 4.67% CAGR through 2031.
Why are synthetics gaining on mineral oils?
Stricter emission rules, higher operating temperatures and demands for longer fluid life are pushing users toward synthetic formulations that outperform mineral oils despite higher upfront costs.
Which end-user industry will add the most new demand?
Concentrated solar power is forecast to expand at 5.05% CAGR and will add the most incremental demand by 2031.
How does Asia-Pacific maintain its lead in the market?
Large-scale refining, massive petrochemical investments and aggressive renewable-energy targets give Asia-Pacific the largest 37.40% share and sustain 4.42% CAGR growth.
What role do data centers play in future demand?
Rising adoption of immersion cooling fluids for AI and high-performance computing racks positions data centers as an important emerging application that can diversify overall market growth.