Torque Vectoring Market Size and Share
Market Overview
| Study Period | 2019 - 2030 |
|---|---|
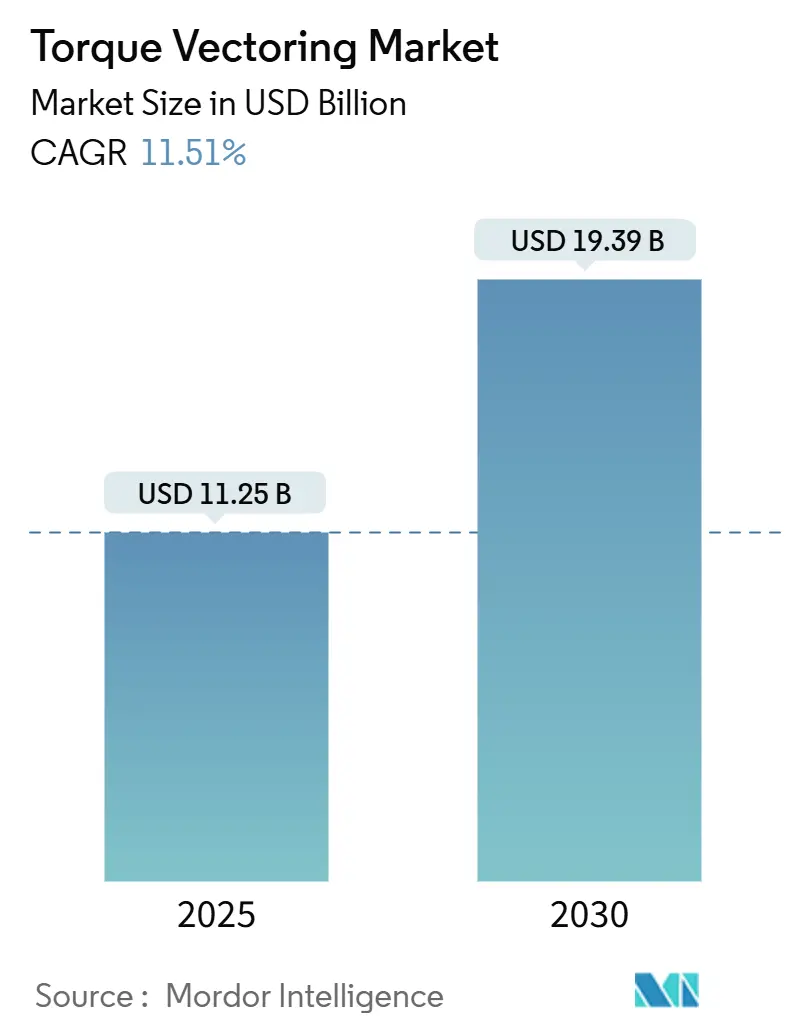
| Market Size (2025) | USD 11.25 Billion |
| Market Size (2030) | USD 19.39 Billion |
| Growth Rate (2025 - 2030) | 11.51% CAGR |
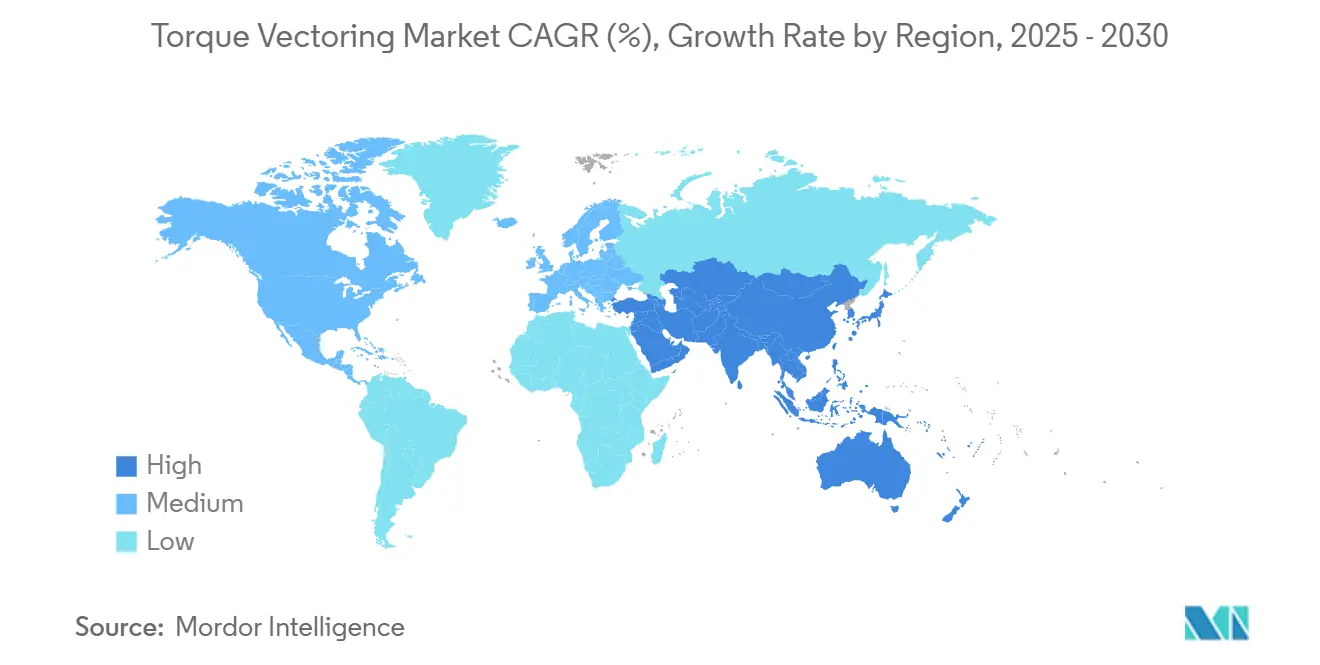
| Fastest Growing Market | Asia Pacific |
| Largest Market | North America |
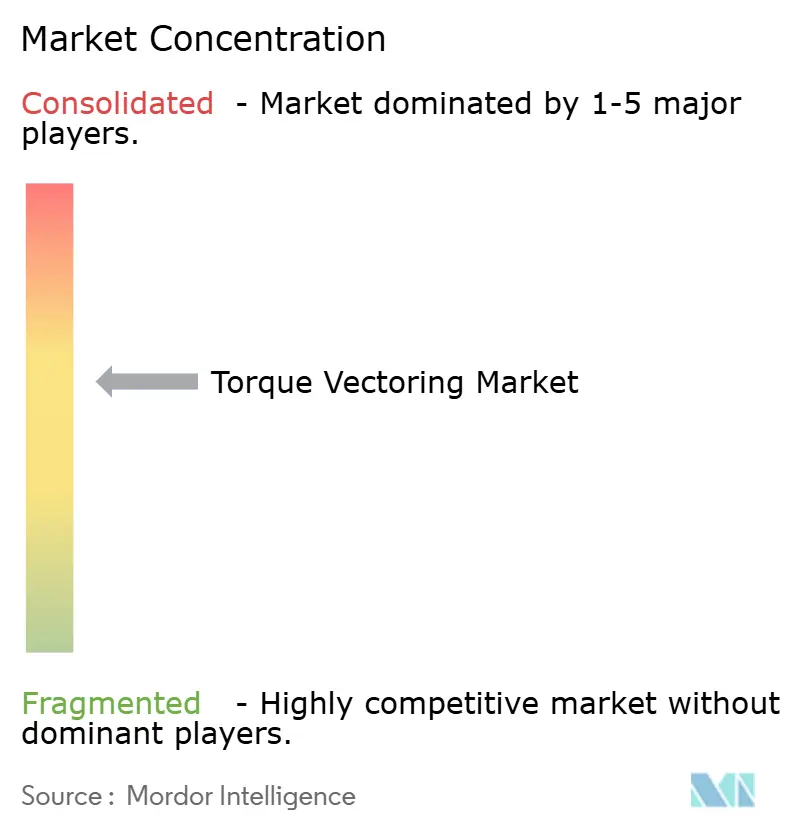
| Market Concentration | Medium |
Major Players *Disclaimer: Major Players sorted in no particular order Image © Mordor Intelligence. Reuse requires attribution under CC BY 4.0. | |
Torque Vectoring Market Analysis by Mordor Intelligence
The Torque Vectoring (TV) Market size is estimated at USD 11.25 billion in 2025, and is expected to reach USD 19.39 billion by 2030, at a CAGR of 11.51% during the forecast period (2025-2030). Strong growth reflects automakers’ pivot toward electrified drivetrains, software-defined vehicle architectures, and premium handling features that allow per-wheel torque control. Regulatory mandates for electronic stability control are already in place, giving suppliers a ready sensor suite to layer torque vectoring algorithms on top. Independent-motor electric vehicles widen the performance envelope by removing the mechanical lag constraining conventional differential-based systems. At the model-mix level, the SUV/crossover boom, rising popularity of performance-oriented luxury trims, and the industry shift to centralized E/E platforms combine to keep the torque vectoring market on an expansionary trajectory despite cyclical headwinds.
Key Report Takeaways
- By vehicle type, passenger cars held a 68.83% share of the torque vectoring market in 2024 and are expected to advance at an 11.55% CAGR during the forecast period (2025-2030).
- By drive type, all-wheel drive led with 53.47% of the torque vectoring market share in 2024, expected to maintain the fastest growth at 11.62% CAGR during the forecast period (2025-2030).
- By TV technology type, differential-based systems retained a 47.83% share of the torque vectoring market in 2024, while electronic torque vectoring is growing at an 11.57% CAGR during the forecast period (2025-2030).
- By propulsion type, internal combustion platforms still held a 56.71% share of the torque vectoring market in 2024, yet battery electric vehicles are registering an 11.53% CAGR during the forecast period (2025-2030).
- By region, North America commanded a 38.93% of the torque vectoring market size in 2024; Asia-Pacific is accelerating at an 11.58% CAGR during the forecast period (2025-2030).
Global Torque Vectoring Market Trends and Insights
Drivers Impact Analysis*
| Driver | (~) % Impact on CAGR Forecast | Geographic Relevance | Impact Timeline |
|---|---|---|---|
| Electrification Enables Independent-Motor TV | +3.2% | Asia Pacific core, spill-over to North America and Europe | Long term (≥ 4 years) |
| Surging AWD SUV/Crossover Production | +2.8% | Global, with strongest impact in North America and Europe | Medium term (2-4 years) |
| Mandatory Stability/Safety Regulations (ESC+) | +1.9% | Global, with regulatory harmonization across regions | Short term (≤ 2 years) |
| Premium-Vehicle Performance Differentiation | +1.7% | North America and Europe, emerging in Asia Pacific premium segments | Medium term (2-4 years) |
| EV Range-Extension Via Slip-Loss Reduction | +1.4% | Global, with emphasis on long-range EV markets | Long term (≥ 4 years) |
| OTA-Tunable Software-Defined Drivetrains | +0.8% | North America and Europe, expanding to Asia Pacific | Long term (≥ 4 years) |
| Source: Mordor Intelligence | |||
Electrification Enables Independent-Motor Torque Vectoring
Electric architectures replace cross-axle mechanical parts with software-directed motor pairs, yielding virtually instantaneous torque allocation. Multi-motor layouts can vector torque without clutch packs, so response latency falls from milliseconds to microseconds. The resulting precision supports predictive dynamic control algorithms that draw on navigation, sensor fusion, and machine learning to pre-position torque before a corner or traction event occurs. DeepDrive’s Series B round in September 2024, led by BMW i Ventures and Continental Corporate Venture Capital, underscores investor belief that dual-rotor e-motors will accelerate this shift[1]“DeepDrive Secures Series B for Dual-Rotor EV Traction Motors,” DeepDrive, deepdrive.io . As vehicle E/E architectures centralize, torque vectoring becomes a software feature that can be upgraded over the air, turning drivetrain behavior into a monetizable post-sale service.
Surging AWD SUV/Crossover Production
Global SUV and crossover output hit record highs in 2024, and a growing share uses AWD drivetrains. This surge gives torque vectoring system suppliers a ready mechanical footprint—multiple driven axles—that allows fine-grained wheel torque distribution. Automakers have discovered that software-enhanced AWD can move a family utility vehicle up-market by delivering handling once limited to sports sedans. For example, the 2025 BMW M5 PHEV blends an electronically controlled rear differential with variable front-to-rear torque split to differentiate itself in the crowded premium arena[2]“The New BMW M5 Plug-in Hybrid Showcases Next-Gen Drivetrain,” BMW Group, bmwgroup.com . The combination of perceived safety benefits, all-weather capability, and performance flair keeps OEMs investing in torque vectoring as a tangible upsell feature across high-volume body styles.
Mandatory Stability/Safety Regulations
United Nations DCAS rules, the EU General Safety Regulation 2019/2144, and NHTSA stability standards compel every new passenger vehicle to carry yaw, wheel-speed, and lateral acceleration sensors. Those same sensors form the backbone for torque vectoring logic, allowing suppliers to piggyback on an installed hardware base. Regulatory harmonization lowers incremental cost and accelerates time-to-market because suppliers can certify a single electronic control unit across major regions. Functional-safety clauses embedded in the rules also push algorithm robustness, indirectly boosting consumer trust in advanced torque manipulation.
Premium-Vehicle Performance Differentiation
Chassis finesse has become a fresh battleground in luxury segments where horsepower and 0-60 mph metrics have converged. Torque vectoring offers customers a visceral benefit on the test drive; hence, brands from BMW to Genesis position vectoring software as a hallmark of engineering prowess. Magna’s EtelligentCommand PHEV mule showed a one-tenth cornering safety margin improvement by combining twin-clutch hardware with model-based control software. Premium buyers’ willingness to pay for a feature that boosts safety and engagement ensures a ready profit pool for suppliers skilled in integrated control logic.
Restraints Impact Analysis*
| Restraint | (~) % Impact on CAGR Forecast | Geographic Relevance | Impact Timeline |
|---|---|---|---|
| High Up-Front System Cost & Complexity | -2.1% | Global, with strongest impact in price-sensitive markets | Short term (≤ 2 years) |
| Added Mass Hurts ICE Fuel Economy | -1.3% | North America and Europe, where fuel economy regulations are stringent | Medium term (2-4 years) |
| Durability & Maintenance Of Clutch-Based TV | -1.2% | Global, with heightened impact in harsh operating environments | Medium term (2-4 years) |
| Cyber-Security Exposure Of TV Algorithms | -0.9% | North America and Europe, expanding to Asia Pacific with regulatory development | Long term (≥ 4 years) |
| Source: Mordor Intelligence | |||
High Up-Front System Cost & Complexity
Torque vectoring packages can add USD 500–1,200 in bill-of-material cost, excluding the software validation expense needed for multicontinent homologation. Hardware volumes remain low because feature take-rate clusters in premium trims, preventing economies of scale. Integration also touches braking, powertrain, and stability modules, multiplying calibration loops and test mileage. In price-sensitive markets like India or Brazil, the cost delta tilts purchasing managers toward simpler traction aids, capping widespread adoption for at least two model cycles.
Added Mass Hurts ICE Fuel Economy
Advanced driveline technologies challenge automakers' efforts to meet fuel-efficiency and emissions targets. These technologies, such as torque-vectoring differentials and twin-clutch systems, add significant weight. While electric platforms can somewhat counterbalance this weight through regenerative braking, those relying on internal combustion face a compliance dilemma. Additionally, price fluctuations in steel and rare-earth materials make cost and mass optimization more challenging. As a result, some high-volume sedans and hatchbacks opt for simpler open-differential designs.
*Our forecasts treat driver/restraint impacts as directional, not additive. The impact forecasts reflect baseline growth, mix effects, and variable interactions.
Segment Analysis
By Vehicle Type: Passenger Cars Drive Innovation
Passenger cars held a 68.83% share of the torque vectoring market in 2024, a dominance rooted in their role as technology flag-bearers. OEMs unveil cutting-edge chassis control on sedans and coupes because retail buyers demand engaging handling as a differentiator in an otherwise commoditized segment. The Neue Klasse iX3, arriving for 2026, embeds a “Heart of Joy” ECU that processes sensor data 10 times faster than legacy controllers, translating to millisecond-level torque allocation. This pace underpins an 11.55% CAGR projection during the forecast period (2025-2030) for the passenger-car slice of the torque vectoring market.
Fleets are increasingly prioritizing total cost of ownership, leading to a surge in traction for commercial vehicles, despite their smaller segment size. Torque vectoring extends tire life and curbs cargo shifts, especially in high-roof vans. ZF’s eBeam axle highlights this trend and showcases the ability to deliver substantial power and torque with remarkable efficiency, indicating a shift of torque vectoring into light-duty trucks. With last-mile delivery fleets moving towards electrification, the integration of software-driven torque management is slashing maintenance costs, paving the way for consistent adoption growth even after 2027.


By Drive Type: AWD Dominance Accelerates
All-wheel drive configurations represented a 53.47% share of the torque vectoring market in 2024 and are expected to grow at a 11.62% CAGR during the forecast period (2025-2030). AWD inherently offers two driven axles, so vectoring controllers have more degrees of freedom to fine-tune yaw, making the feature a natural upsell. Consumers equate AWD with safety, and torque vectoring enhances that perception by trimming understeer or enabling tail-out dynamic modes on command.
Front-wheel drive remains popular in entry categories, but brake-based torque vectoring is often a cheaper interim solution. Rear-wheel drive caters to performance icons that seek drift-friendly behavior. Innovations such as Hyundai Mobis’s e-Corner module—an individually powered and steered wheel assembly slated for 2026—could blur the classic FWD/RWD/AWD taxonomy by enabling crab steering and zero-turn capability. However, conventional AWD retains the highest adoption odds for the next five years thanks to existing tooling and brand marketing around “xDrive,” “quattro,” and similar badges.
By Torque Vectoring Technology Type: Electronic Systems Gain Momentum
Differential-based torque vectoring controlled 47.83% share of the torque vectoring market in 2024, a testament to decades of mechanical robustness. Yet software-centric electronic vectoring is expected to grow at an 11.57% CAGR during the forecast period (2025-2030), lifted by centralized vehicle computers that support continuous algorithm enhancements. With fewer moving parts, electronic systems promise lower warranty exposure and the ability to download seasonal performance modes over the air.
Brake-based solutions maintain relevance for budget trims needing basic yaw control without an electronically limited-slip differential. Eaton’s latest ELocker bridges mechanical roots with electronic actuation to give PHEV SUVs selectable locking for off-road and torque-vectoring on pavement. Suppliers that can toggle between fully active, clutch-pack, and brake-based modes inside the same software stack stand to capture multi-segment contracts.


By Propulsion Type: BEV Growth Reshapes Market
Internal combustion platforms still commanded a 56.71% share of the torque vectoring market in 2024, reflecting the legacy fleet. However, battery electric vehicle drive is expected to grow with an 11.53% CAGR during the forecast period (2025-2030), segment expansion by eliminating propshafts, transfer cases, and associated parasitic drag. Independent-motor BEVs employ vectoring from the outset; hence, torque control becomes a core design requirement rather than an add-on.
Hybrid and fuel-cell applications sit mid-stream, benefiting from electric motors for low-speed torque distribution while keeping combustion engines for range. The rise of zonal E/E architectures—expected to be present in 30% of global production by 2032—will further cement software-first vectoring strategies, aligning well with high-voltage BEV platforms that rely on centralized compute for ADAS and infotainment.
Geography Analysis
North America led with 38.93% share of the torque vectoring market in 2024, anchored by premium SUV demand and existing ESC mandates that supply the sensor backbone for vectoring controllers. Detroit-based OEMs collaborate closely with local tier ones such as BorgWarner and American Axle to integrate e-drive modules that deliver traction and vectoring. Strong consumer appetite for performance-labeled trims like Ford’s ST line or Cadillac’s V-Series further primes the addressable base for advanced yaw control features.
Asia-Pacific is expected to be the fastest riser at 11.58% CAGR during the forecast period (2025-2030) as China’s NEV policy, Japan’s drivetrain heritage, and Southeast Asia’s fiscal incentives converge. Chinese EV start-ups routinely specify dual-motor AWD layouts that make torque vectoring table stakes for competitive differentiation. JTEKT and Aisin leverage deep gearbox portfolios to supply electronic limited-slip differentials tuned for high-torque motors. At the same time, local semiconductor capacity in Taiwan and South Korea shortens supply chains for control chips. Thailand’s subsidy program, offering up to 100,000 baht on eligible EVs, seeds early adoption in right-hand-drive markets that have historically lagged tech rollouts.
Europe sustains high feature penetration due to CO₂ norms and an outsized luxury car mix. The EU General Safety Regulation embeds yaw-rate baseline hardware, and German OEMs convert that install base into sophisticated vectoring functions branded as xDrive, quattro, or 4MATIC. Suppliers like ZF and Continental tie torque vectoring offerings into domain controllers hosting ADAS, enabling shared compute and power stages. Supply-chain maturity and proximity keep cost escalation in check, supporting widespread take-rates even in upper-mid trims.

Competitive Landscape
The torque vectoring market remains moderately fragmented, yet consolidation pressure is mounting. Legacy tier ones—ZF Friedrichshafen, GKN Automotive, BorgWarner—combine mechanical expertise with growing software teams to deliver turnkey e-axle modules. Their share is under siege from pure-play e-drive firms that supply software-heavy dual-motor solutions optimized for zonal architectures.
Competitive advantage is shifting toward the ability to push over-the-air torque maps and guarantee cyber-secure updates. Magna’s 800 V eDrive, revealed at CES 2024, packs 5,000 Nm axle torque with measured efficiency while lowering manufacturing CO₂ by one-fifth, a dual selling point in ESG-oriented procurement cycles[3]“New 800 V eDrive Sets Efficiency Benchmark,” Magna International, magna.com. Eaton, traditionally focused on mechanical lockers, won a PHEV SUV contract in May 2024 by redesigning its ELocker for low-viscosity e-fluids and dashboard integration, proving that hybrid mechanical-electronic solutions still win when cost targets loom.
Software-centric disruptors such as DeepDrive bet on high-RPM dual-rotor motors whose independent halves vector torque natively. OEMs aiming for skateboard platforms appreciate the packaging freedom because bulky clutch packs disappear. Meanwhile, white-space prospects exist in commercial vehicles where tire wear and stability hold more weight than sheer cornering speed; suppliers offering torque vectoring modules bundled with telematics-based ROI analytics could outmaneuver hardware-only rivals.
Torque Vectoring Industry Leaders
BorgWarner Inc.
ZF Friedrichshafen AG
GKN Automotive Ltd.
JTEKT Corporation
American Axle & Manufacturing
- *Disclaimer: Major Players sorted in no particular order

Recent Industry Developments
- September 2024: DeepDrive raised EUR 30 million Series B funding, led by BMW i Ventures and Continental CVC, to commercialize dual-rotor e-motors that enable software-based torque vectoring.
- May 2024: A leading electrified vehicle manufacturer has selected intelligent power management company Eaton to supply its ELocker® differential system for a new plug-in electric hybrid (PHEV) SUV. Unlike traditional PHEVs, this model uses an electric motor for the rear wheels and either an electric motor or an optional internal combustion engine (ICE) for the front wheels.
- January 2024: Magna unveiled its next-generation 800 V eDrive at CES 2024. It delivers 250 kW peak and 5,000 Nm axle torque with 93% efficiency while trimming production CO₂ by 20%.


Global Torque Vectoring Market Report Scope
| Passenger Car |
| Commercial Vehicle |
| Rear-Wheel Drive (RWD) |
| Front-Wheel Drive (FWD) |
| All-Wheel Drive (AWD) |
| Brake-Based Torque Vectoring |
| Differential-Based Torque Vectoring |
| Electronic Torque Vectoring |
| Internal Combustion Engine (ICE) |
| Hybrid Electric Vehicle (HEV) |
| Battery Electric Vehicle (BEV) |
| Fuel-Cell Electric Vehicle (FCEV) |
| North America | United States |
| Canada | |
| Rest of North America | |
| South America | Brazil |
| Argentina | |
| Rest of South America | |
| Europe | United Kingdom |
| Germany | |
| Spain | |
| Italy | |
| France | |
| Russia | |
| Rest of Europe | |
| Asia-Pacific | India |
| China | |
| Japan | |
| South Korea | |
| Rest of Asia-Pacific | |
| Middle East and Africa | United Arab Emirates |
| Saudi Arabia | |
| Turkey | |
| Egypt | |
| South Africa | |
| Rest of Middle-East and Africa |
| By Vehicle Type | Passenger Car | |
| Commercial Vehicle | ||
| By Drive Type | Rear-Wheel Drive (RWD) | |
| Front-Wheel Drive (FWD) | ||
| All-Wheel Drive (AWD) | ||
| By Torque Vectoring Technology Type | Brake-Based Torque Vectoring | |
| Differential-Based Torque Vectoring | ||
| Electronic Torque Vectoring | ||
| By Propulsion Type | Internal Combustion Engine (ICE) | |
| Hybrid Electric Vehicle (HEV) | ||
| Battery Electric Vehicle (BEV) | ||
| Fuel-Cell Electric Vehicle (FCEV) | ||
| By Geography | North America | United States |
| Canada | ||
| Rest of North America | ||
| South America | Brazil | |
| Argentina | ||
| Rest of South America | ||
| Europe | United Kingdom | |
| Germany | ||
| Spain | ||
| Italy | ||
| France | ||
| Russia | ||
| Rest of Europe | ||
| Asia-Pacific | India | |
| China | ||
| Japan | ||
| South Korea | ||
| Rest of Asia-Pacific | ||
| Middle East and Africa | United Arab Emirates | |
| Saudi Arabia | ||
| Turkey | ||
| Egypt | ||
| South Africa | ||
| Rest of Middle-East and Africa | ||


Key Questions Answered in the Report
What is the projected value of the torque vectoring market by 2030?
It is forecast to reach USD 19.39 billion, growing at an 11.51% CAGR from 2025.
Which region currently leads the adoption of torque vectoring technology?
North America held a 38.93% share in 2024, driven by premium AWD SUV demand and ESC regulations.
Why are electric vehicles accelerating torque vectoring uptake?
Independent-motor layouts remove mechanical lag and let software allocate torque instantly, improving handling and energy efficiency.
Which vehicle segment shows the fastest torque vectoring growth?
All-wheel drive configurations expand at 11.62% CAGR through 2030 due to their compatibility with advanced vectoring algorithms.
What is a key barrier to wider torque vectoring penetration in entry-level models?
Added hardware cost and integration complexity raise bill-of-material expenses, limiting adoption in price-sensitive segments.
How are suppliers differentiating torque vectoring solutions today?
Leading vendors bundle software-defined control, OTA update capability, and integrated e-axle hardware to offer turnkey performance and efficiency gains.
Page last updated on:


