
Automotive Differential Market Size and Share
Market Overview
| Study Period | 2019 - 2031 |
|---|---|
| Market Size (2026) | USD 22.20 Billion |
| Market Size (2031) | USD 27.81 Billion |
| Growth Rate (2026 - 2031) | 4.61 % |
| Fastest Growing Market | Middle East and Africa |
| Largest Market | Asia Pacific |
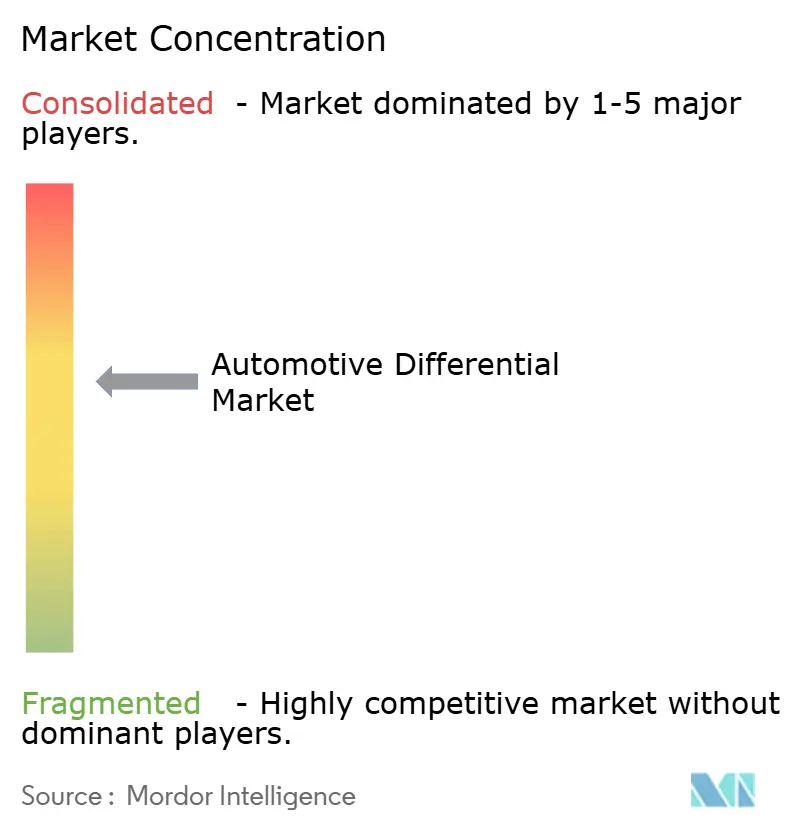
| Market Concentration | Medium |
Major Players *Disclaimer: Major Players sorted in no particular order Image © Mordor Intelligence. Reuse requires attribution under CC BY 4.0. | |
Automotive Differential Market Analysis by Mordor Intelligence
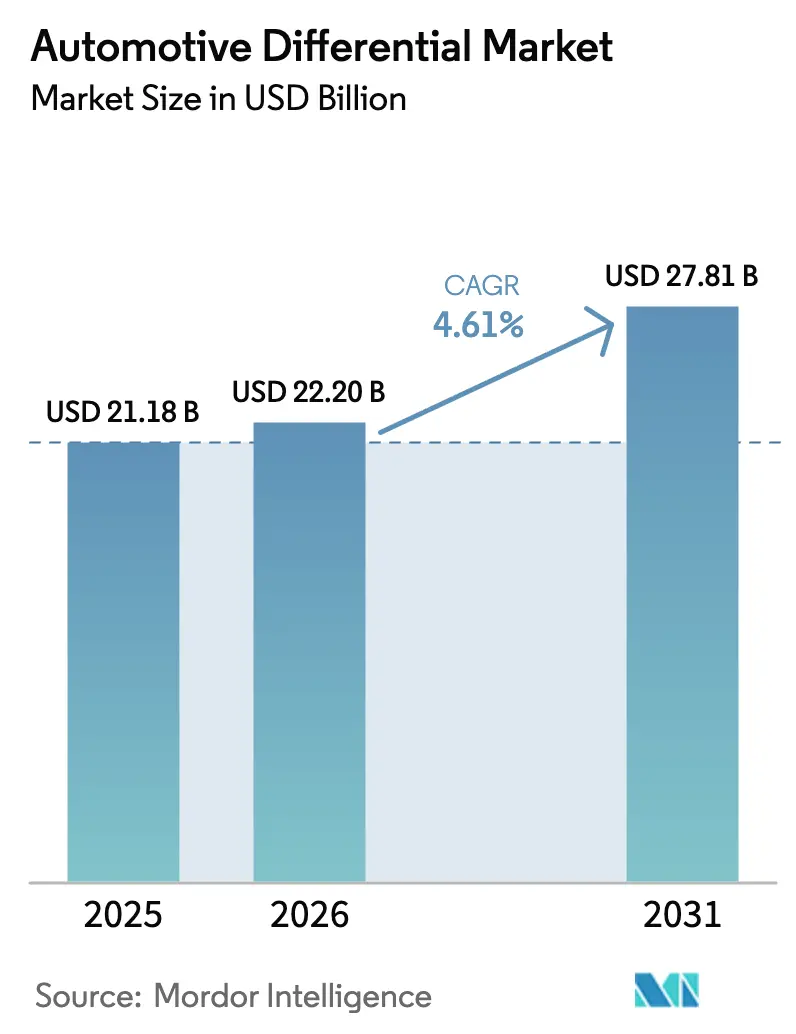
The automotive differential market size is expected to grow from USD 21.18 billion in 2025 to USD 22.20 billion in 2026 and is forecast to reach USD 27.81 billion by 2031 at a 4.61% CAGR during the forecast period (2026-2031). Strong replacement demand, rising installations of AWD and 4WD systems, and the enduring popularity of light trucks drive this trend. Meanwhile, electrified powertrains carve out new opportunities for electronically limited-slip and torque-vectoring units. Despite the surge in electric vehicle (EV) volumes, the demand for traditional systems remains robust. This is mainly because many hybrid and battery-electric SUVs still depend on mechanical or electromechanical differentials. These systems are crucial for managing torque, ensuring drivability, and adhering to regional traction regulations. The Asia-Pacific region is the primary hub for the production of both passenger and commercial vehicles. This centrality offers differential suppliers significant scale advantages. In contrast, North American buyers, with their penchant for pickups and performance-oriented SUVs, enjoy premium margins. These vehicles often come equipped with multiple differentials, underscoring their value.
Key Report Takeaways
- By drive type, all-wheel drive captured 44.08% of the automotive differential market share in 2025, and this segment is forecasted to grow at a 5.92% CAGR through 2031.
- By vehicle type, passenger cars accounted for 56.12% of the automotive differential market in 2025, and this segment is expected to continue expanding at the fastest CAGR of 6.86% through 2031.
- By propulsion type, internal-combustion platforms led the automotive differential market with a 68.33% share in 2025; electric models are projected to post the fastest 9.12% CAGR through 2031.
- By component, differential gears held 37.24% of the automotive differential market share in 2025, and this segment is expected to grow at a 5.41% CAGR through 2031.
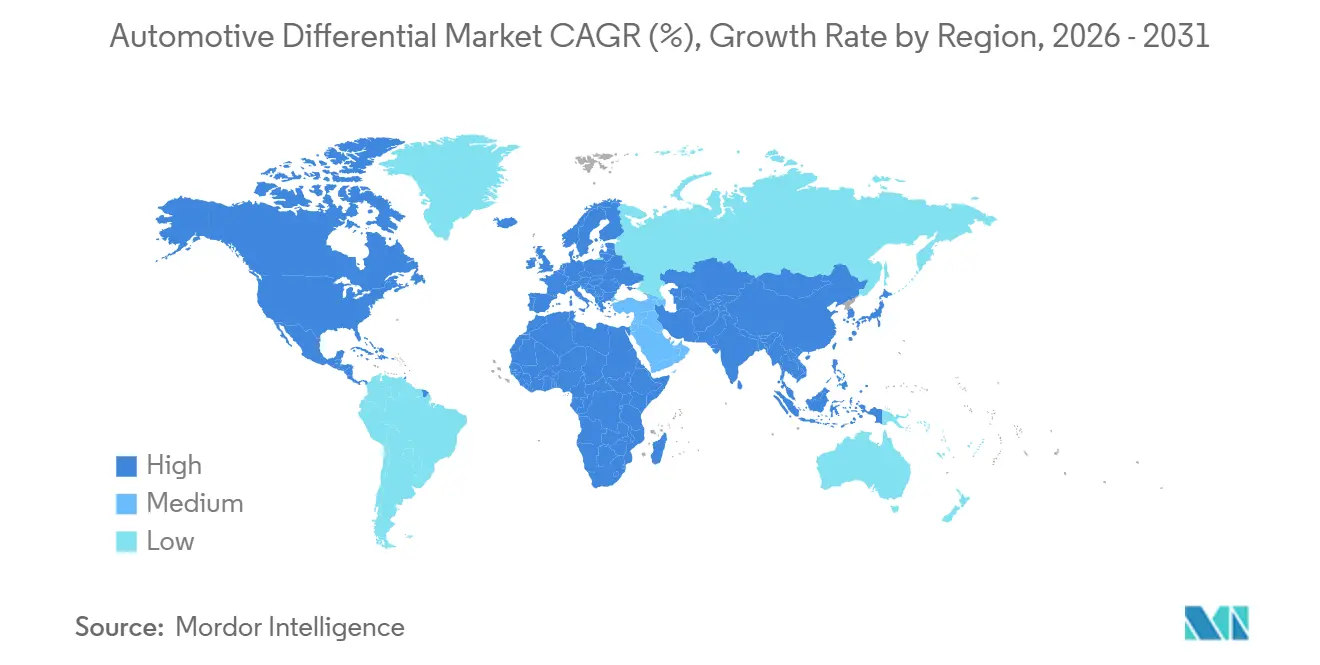
- By geography, Asia-Pacific held a 48.35% share in 2025, while the Middle East and Africa region is set to expand at a 6.33% CAGR through 2031.
Note: Market size and forecast figures in this report are generated using Mordor Intelligence’s proprietary estimation framework, updated with the latest available data and insights as of January 2026.
Market Trends and Insights
Drivers Impact Analysis of Automotive Differential Market*
| Driver | (~) % Impact on CAGR Forecast | Geographic Relevance | Impact Timeline |
|---|---|---|---|
| Rising Penetration of AWD/4WD | +1.2% | Global, strongest in North America and Europe | Medium term (2-4 years) |
| Growth in Global LCV Production | +0.9% | Asia-Pacific core, spill-over to Middle East and Africa | Long term (≥4 years) |
| Surge in Advanced Differential Adoption | +0.8% | North America and EU, expanding to Asia-Pacific | Medium term (2-4 years) |
| Expansion of APAC Car Output | +0.7% | Asia-Pacific, secondary effects in Middle East and Africa | Long term (≥4 years) |
| Telematics-Enabled Predictive-Maintenance | +0.4% | Global, led by North America and Europe | Long term (≥4 years) |
| Tariff-Driven North-American Near-Shoring | +0.3% | North America, limited global impact | Short term (≤2 years) |
| Source: Mordor Intelligence | |||


Rising Penetration of AWD/4WD Vehicles
In North America, buyers associate multi-axle drive (AWD) with enhanced safety, better resale value, and improved winter traction. This perception has bolstered its appeal among both premium and mainstream automotive brands. Transitioning from front-wheel drive (FWD) to AWD typically involves adding a rear and a center differential, a change that triples the content per vehicle and boosts average selling prices. Mainstream crossovers, like the Toyota RAV4, are now incorporating electronic on-demand AWD modules tied to stability control, underscoring this growing trend. Furthermore, commercial upfitters are increasingly opting for part-time 4WD in vocational pickups, often adding robust locking differentials to navigate off-road challenges. These trends in volume and content are bolstering the automotive differential market, even as demand for sedans wanes.
Growth in Global Light and Medium-Heavy-Commercial-Vehicle Production
In 2025, India increased its production of heavy-duty trucks, while China experienced significant growth across both its medium- and heavy-duty truck segments. Each truck chassis now boasts enhanced features: robust hypoid gearsets, thicker bearing sleeves, and increased lubricant capacity. These upgrades have tripled per-axle revenue compared to a compact car. Fleets that value extended service intervals often turn to established suppliers for remanufactured carriers and authentic repair kits, thereby ensuring repeat business. Meanwhile, export-driven assemblers in Vietnam and Thailand are expanding their reach, taking the automotive differential market beyond their home countries.
Surge in Advanced (eLSD / Torque-Vectoring) Differential Adoption
ZF's electronic limited-slip technology faces a significant increase in adoption among new European premium models compared to the previous year. Integrated sensors and microcontrollers apportion torque proactively, complementing lane-keeping and active stability systems. The electronics add high-margin printed circuit assemblies and actuators, doubling unit value. Performance-oriented plug-in hybrids rely on torque-vectoring to mask weight penalties, encouraging OEMs to specify such systems even as electrification accelerates. Suppliers who can co-develop control algorithms with OEM chassis teams are more likely to win long-term sourcing contracts.
Expansion of APAC Passenger-Car Output and Model Launches
China’s passenger-car volume advanced 5.8% to 27.56 million units in 2024, and model launches surged significantly[1]“Production Data 2024,” Society of Indian Automobile Manufacturers, Siam.in. Every new global platform released by Chinese, Japanese, or Korean automakers increasingly offers AWD derivatives, often bundled with turbocharged engines or dual-motor hybrid systems that mandate center differentials. Local Tier 1 suppliers partner with overseas gear specialists to raise gear-cutting quality, improving export competitiveness. As ASEAN plants pursue European and US safety ratings, demand for quieter, finer-pitch hypoid sets increases, driving up the average selling price across the automotive differential market.
Restraints Impact Analysis of Automotive Differential Market*
| Restraint | (~) % Impact on CAGR Forecast | Geographic Relevance | Impact Timeline |
|---|---|---|---|
| EV In-Wheel-Motor Architectures | -1.8% | Global, accelerating in China and Europe | Medium term (2-4 years) |
| Raw-Material Price Volatility | -0.6% | Global, severe in emerging markets | Short term (≤2 years) |
| Shortage of Gear-Cutting Equipment | -0.5% | Global, acute in Asia-Pacific hubs | Medium term (2-4 years) |
| EU Acoustic Rules Raising Costs | -0.4% | Europe, spillover to global platforms | Short term (≤2 years) |
| Source: Mordor Intelligence | |||
EV In-Wheel-Motor Architectures Reducing Need for Differentials
Tesla Model S Plaid and Lucid Air Dream Edition demonstrate that quad-motor propulsion can deliver finer torque management than a mechanical differential while removing mass and friction. Protean Electric shipped commercial-grade in-wheel hubs in 2024, and Elaphe secured passenger-car validation programs, showing the architecture is maturing [2]“In-Wheel Motor Launch Announcement 2024,” Protean Electric, proteanelectric.com. As costs fall, Luxury EVs may bypass center and axle carriers, posing a structural risk for conventional suppliers. Differential companies counter by offering electromechanical torque-vectoring modules for dual-motor EV axles, but market conversion speed remains a headwind.
Raw-Material (Steel, Al) Price Volatility
In 2025, prices for hot-rolled coils and aluminum fluctuated significantly. Given that steel plays a pivotal role in carrier assemblies, index-based contracts offer only a partial hedge against price surges, thereby tightening margins. Smaller Tier 2 machine shops often struggle to secure long-term billets, prompting buyers to turn to larger, vertically integrated multinationals. While some OEMs are open to mixed material specifications—trading nodular castings for forged steel—strict regulations on case thickness curtail this flexibility, perpetuating pricing pressures.
*Our forecasts treat driver/restraint impacts as directional, not additive. The impact forecasts reflect baseline growth, mix effects, and variable interactions.
Automotive Differential Market Segment Analysis
By Drive Type:
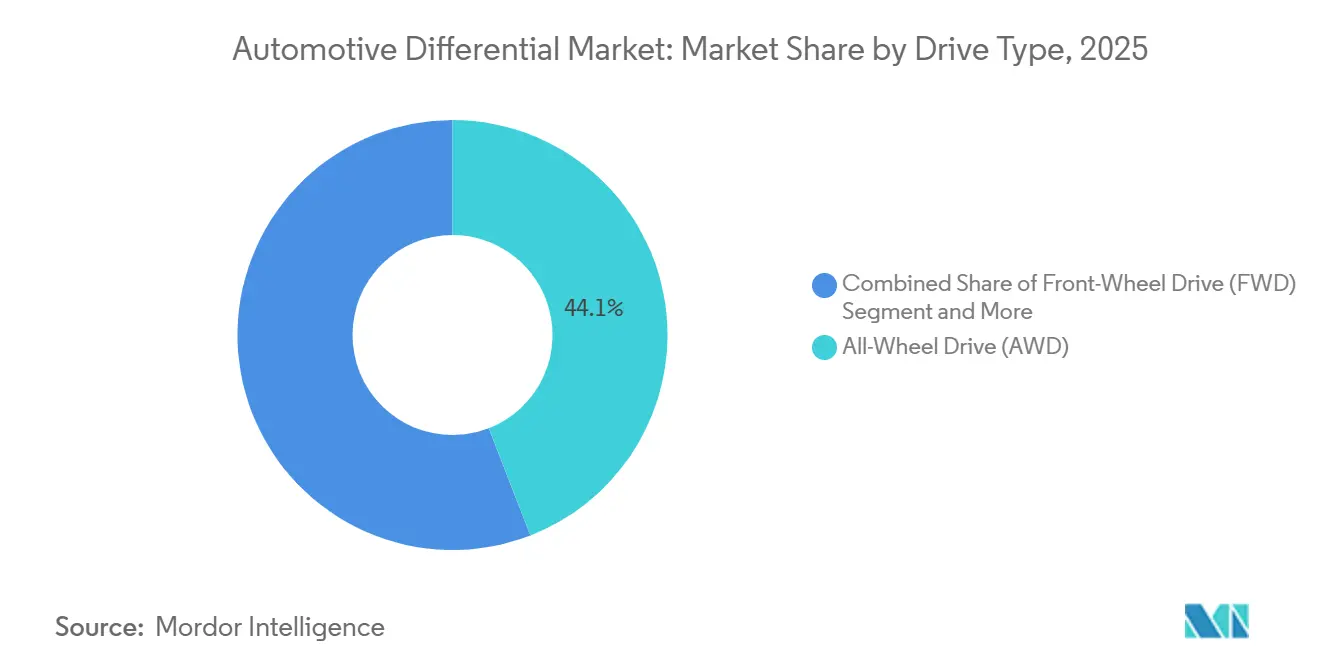
AWD Systems Command Premium Market PositionAll-wheel drive (AWD) systems captured 44.08% of the automotive differential market share in 2025, generating the largest revenue pool, as each vehicle typically carries at least two differentials and often an electronically controlled center unit. The automotive differential market for AWD is projected to grow at a 5.92% CAGR through 2031, driven by the global shift toward crossovers and the need to comply with active-safety mandates. AWD demand is robust in Canada, Scandinavia, and mountainous Asian provinces where harsh winters influence purchase decisions. Premium European sedans and Japanese grand tourers emphasize torque-vectoring rear differentials, which heighten the driving feel and justify their higher price tags.
Front-wheel drive retains a significant share as the foundation for cost-focused hatchbacks and sedans. Its component simplicity limits average selling price, but global unit volume remains high, preserving a steady baseline for suppliers. Rear-wheel drive holds a notable share, concentrated in luxury coupes and commercial vans that benefit from longitudinal packaging. Four-wheel drive, which utilizes part-time hubs and a transfer case, has seen significant growth, driven by full-size pickups and dedicated off-roaders. Collectively, shifting buyer tastes toward crossover body styles continues to amplify differential content per vehicle, underpinning the broader automotive differential market.


By Vehicle Type:
Passenger Cars Drive Volume While Commercial Vehicles Offer ValuePassenger cars accounted for 56.12% of the automotive differential market share in 2025 and are forecasted to grow at a 6.86% CAGR through 2031, driven by increasing middle-class demand in ASEAN and South America. High feature proliferation in compact SUVs means more vehicles carry two or three differentials, boosting dollar content. Meanwhile, light commercial vehicles log a significant share, as e-commerce requires agile delivery vans with multi-axle traction systems.
Medium and heavy trucks account for a notable share. Still, they deliver the highest unit price due to larger hypoid gear sets, planetary lockers, and specialized seals that function in extreme duty cycles. Fleet operators in the mining and construction segments demand long-life synthetic lubricants and remote monitoring, resulting in stable aftermarket and service revenue. The interplay of high-volume passenger-car supply and high-value commercial-vehicle demand keeps the automotive differential market balanced across economic cycles.
By Propulsion Type:
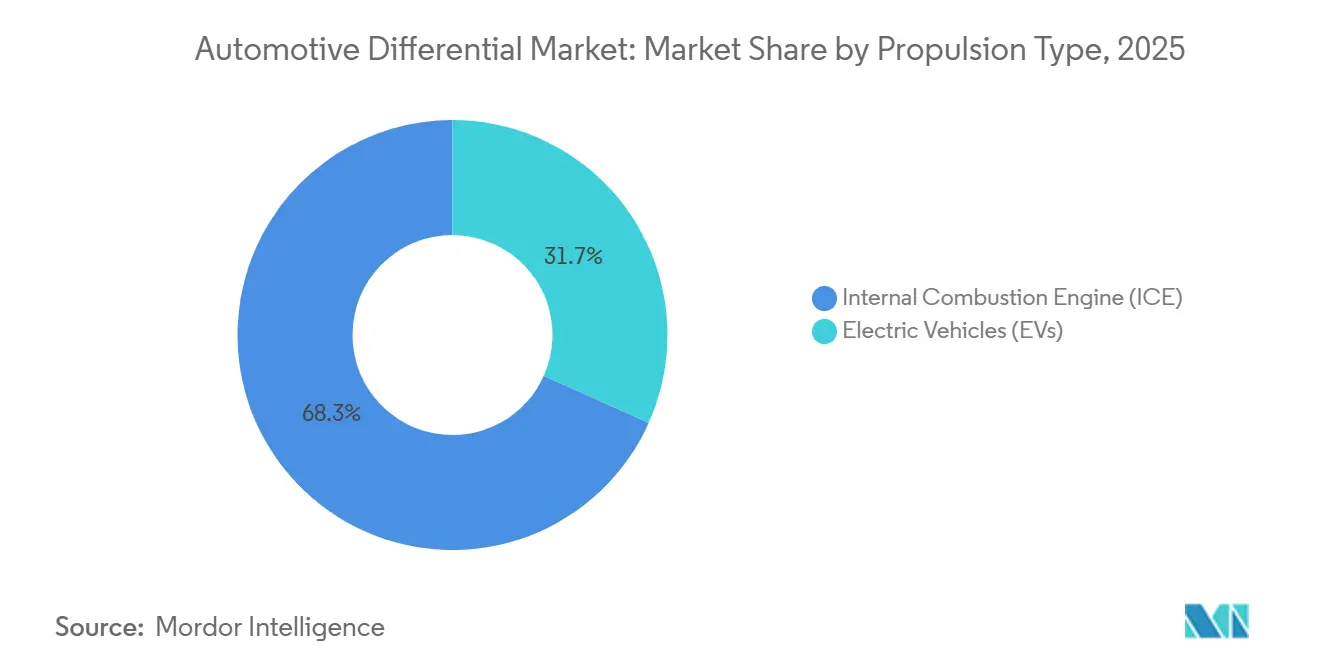
ICE Dominance Faces EV Disruption ChallengeInternal-combustion vehicles accounted for 68.33% of the automotive differential market in 2025, underscoring the continued demand for mechanical differentials in traditional drivetrains. Fuel-efficient turbocharged engines paired with compact AWD modules continue to push content upward. The automotive differential market size for battery-electric platforms, although smaller, is expected to expand at a 9.12% CAGR through 2031, as dual-motor SUVs, pickup trucks, and performance BEVs enter high-volume production.
Hybrid architectures blend engine and motor torque, requiring sophisticated AWD couplings that integrate clutch packs and sensors to maintain differential torque during the transition. Suppliers refine lightweight aluminum housings and helical gear tooth patterns to minimize drag losses and align with stringent energy consumption targets. Strategic R&D efforts focus on electromechanical e-axles that house compact differentials or electronic torque-vectoring units optimized for silent EV cabins.
By Component:
Differential Gears Lead Through Technical ComplexityIn 2025, differential gears captured 37.24% of the automotive differential market share, driven by the irreplaceable role of hypoid and spiral-bevel pairs in torque transfer at right angles. This segment is set to grow at a 5.41% CAGR through 2031. Techniques like precision grinding, shot-peen hardening, and isotropic finishing not only raise barriers to entry but also command premium margins. The growth of differential cases is closely linked to the demand for lightweight castings in EVs. While bearings, including tapered roller units, held a modest market share, hybrid ceramic variants, though pricier, offer enhanced efficiency and reduced NVH.
Pinions captured a significant share as finer pitch angles allow noise reduction. Component suppliers use powder metal and forged steel processes to tailor strength-to-weight ratios across passenger and commercial vehicle programs. Rising demand for integrated sensor bosses within housings further differentiates higher-value tiers, solidifying the automotive differential industry’s shift toward innovative, serviceable modules.
Geography Analysis
APAC Automotive Differential Market
The Asia-Pacific region maintained a 48.35% share of the automotive differential market in 2025, led by China, Japan, and South Korea, which serve as key hubs for vehicle production. China alone accounted for a significant share of regional differential demand, driven by domestically assembled luxury models featuring advanced torque-vectoring units. India’s significant jump in truck production boosts heavy-duty differential imports, while its indigenous machining capacity scales. Southeast Asian nations utilize free-trade zones to export fully built SUVs worldwide, thereby sustaining regional dominance in the automotive differential market.
North America Automotive Differential Market
North America accounted for a significant share, with a notable CAGR outlook through 2031. Full-size pickups averaging three differentials per chassis underpin revenue resilience. Near-shoring gear production to Mexico reduces lead times and currency exposure, aligning with USMCA content requirements. Canadian axle assembly plants supply Detroit Three programs, ensuring regional self-sufficiency.
Europe Automotive Differential Market
Europe is experiencing notable growth, characterized by premium models that feature electronically limited-slip units to meet cornering stability metrics. Strict NVH and CO₂ rules push suppliers to adopt lightweight housings and super-finished tooth flanks.
MEA Automotive Differential Market
The Middle East and Africa are expected to grow at the fastest rate of 6.33% CAGR through 2031, thanks to the establishment of new assembly lines in South Africa, Turkey, and the United Arab Emirates, which will localize SUV and pickup production for regional consumption [3]“Industrialize Africa Initiative Report 2024,” African Development Bank, afdb.org.

Regulatory Landscape
Differential design and validation increasingly fall under broader vehicle efficiency, emissions, and safety compliance regimes that vary by region, yet converge on requirements for measured drivetrain losses, durability, and NVH. In the United States, EPA rules and test procedures for heavy-duty vehicles shape axle and drivetrain specifications, including 40 CFR 1037.560 axle efficiency test procedures (with amendments published in February 2026) and additional EPA proposals during mid-2026 for model year 2027 and later heavy-duty requirements. Together, these changes raise the compliance bar for driveline efficiency, calibration, and in-use performance.
In Europe, sustainability and supply-chain transparency frameworks are also showing up in sourcing requirements for driveline components. These include obligations tied to upstream material and emissions data under mechanisms such as CBAM and due diligence expectations under CSDDD, linking differential housings, gears, bearings, and lubricant choices to auditable Scope 3 reporting and documented material provenance. As a result, documentation and supplier-qualification thresholds are rising alongside traditional technical approvals.
Value Chain Analysis
The value chain runs from steel and alloy inputs (for gears, pinions, and bearings) through casting or forging of cases and carriers, then precision machining and heat treatment, and finally assembly and testing at Tier 1 suppliers before shipment to OEM drivetrain plants or axle module integrators. As eLSD and torque-vectoring units add electronics (sensors, control modules, actuators) and software calibration, value shifts toward mechatronics integration, validation, and functional safety testing tied to OEM chassis-control architectures.
On the supply-chain side, origin tracking and trade compliance are becoming more operationally material as AD/CVD activity and Section 232 tariff risk increase documentation burdens for cross-border gearsets and machined components. This dynamic reinforces near-shoring and dual-sourcing in North America. At the same time, traceability and circularity requirements linked to OEM Scope 3 reporting and European sustainability rules are pushing Tier 2 and Tier 3 suppliers to provide energy and material-use data. Export-control sensitivity around rare earths and electrification-linked materials also adds procurement risk for differential-adjacent electrified modules, such as e-axle systems that integrate differential functions.
Competitive Landscape
The top suppliers controlled a significant share, reflecting moderate concentration in the automotive differential market. ZF Friedrichshafen leads premium eLSD programs, pairing gear design with proprietary control software for BMW and Mercedes lines.
Dana Incorporated utilizes vertical integration to supply axles, driveshafts, and differentials to Ford and GM truck platforms, leveraging North American near-shoring to mitigate tariff exposure. BorgWarner’s eCross-Differential for battery-electric rear axles has won contracts with GAC Motor and a major European OEM, aligning with its broader e-propulsion roadmap [4]“Electric Cross Differential Contract Release 2024,” BorgWarner, borgwarner.com.
Strategic themes include expanding software competence, acquiring IoT analytics startups, and securing a long-term, cobalt-free magnet supply to hedge against potential in-wheel motor encroachment. Smaller specialists target niche rally and off-road markets with locking differentials but face rising testing and certification costs. Patent filings for integrated sensor bearings and active preload mechanisms increased significantly, underscoring the intensity of innovation.
Automotive Differential Industry Leaders
Dana Incorporated
ZF Friedrichshafen AG
American Axle & Manufacturing, Inc.
Eaton Corporation plc
GKN Automotive Limited
- *Disclaimer: Major Players sorted in no particular order
Automotive Differential Market Companies Covered in this Report
- American Axle & Manufacturing, Inc.
- GKN Automotive Limited
- ZF Friedrichshafen AG
- Dana Incorporated
- BorgWarner Inc.
- Eaton Corporation plc
- JTEKT Corporation
- Schaeffler AG
- Magna International Inc.
- Continental AG
- Hyundai Wia Corporation
- Musashi Seimitsu Industry Co., Ltd.
- Auburn Gear LLC
- Neapco Holdings, LLC
- Drexler Automotive GmbH
- RT Quaife Engineering Ltd.
- Xtrac Limited
- Bharat Gears Limited

Market Opportunities and Future Outlook
Supplier portfolio integration is creating whitespace for bundled axle, driveshaft, and differential offerings that reduce OEM integration burden across ICE, hybrid, and BEV platforms. A clear signal is the June 2026 definitive agreement to combine Eaton's Mobility Group with Dana in a transaction valued at about USD 5.1 billion, aimed at building a larger powertrain systems provider with a broader drivetrain and electrification portfolio. This type of consolidation supports platform-level sourcing bids that bundle differentials, e-axle elements, and related software-enabled controls.
Opportunities are also building in high-content aftermarket and upgrade paths for pickups, SUVs, and off-road vehicles where traction hardware is a direct purchase driver. Eaton's March 2026 expansion of its differential lineup, including ELocker and Detroit Truetrac models for GM diesel trucks and Jeep Wrangler applications, points to continued demand for locking and limited-slip solutions despite changing propulsion mixes. Across OEM programs, the move toward electronically controlled torque management (eLSD and torque-vectoring) keeps demand high for suppliers that can deliver both mechanical gear efficiency and control integration. Compliance and sustainability reporting requirements further favor suppliers that can provide verified traceability, efficiency testing data, and documentation alongside hardware.
Recent Industry Developments in Automotive Differential Market
- June 2026: Dana Incorporated announced a definitive agreement to combine with Eaton Corporation plc Mobility business in a transaction valued at approximately $5.1 billion. This consolidation signals industry consolidation in powertrain and axle systems and creates a broader, integrated drivetrain supplier with enhanced scale and software-enabled differentiation.
- February 2026: ZF Friedrichshafen AG signed a long-term supply agreement with BMW Group for the continued development and supply of the 8-speed automatic transmission 8HP through the late 2030s. The contract secures long-term OEM relationship and planning stability amid electrification and transmission diversification.
- February 2026: American Axle & Manufacturing, Inc. expanded the QUANTUM technology platform to include modular AWD and RWD driveline units with architecture options including electronic limited-slip and torque-vectoring differentials. This broadens the reach of advanced driveline modules for EVs and hybrids and strengthens AAMs position in modular, software-enabled drivelines for next-gen platforms.


Automotive Differential Market Report Scope and Research Methodology
Market Definition and Coverage
For this methodology, the automotive differential market covers differential units used in road vehicles to split and manage torque between wheels and axles. This includes conventional differentials and electronically assisted designs sold into both OEM builds and replacement demand.
Scope exclusions: We exclude non-automotive industrial differentials and adjacent driveline parts that are not sold as differential systems.
Segments Covered in This Report
- By Drive Type
- Front-Wheel Drive (FWD)
- Rear-Wheel Drive (RWD)
- All-Wheel Drive (AWD)
- Four-Wheel Drive (4WD)
- By Vehicle Type
- Passenger Cars
- Light Commercial Vehicles
- Medium and Heavy Commercial Vehicles
- By Propulsion Type
- Internal Combustion Engine (ICE)
- Electric Vehicles (EVs)
- By Component
- Differential Case
- Differential Bearings
- Differential Gears
- Differential Pinion
- Others
- By Geography
- North America
- United States
- Canada
- Rest of North America
- South America
- Brazil
- Argentina
- Rest of South America
- Europe
- Germany
- United Kingdom
- France
- Italy
- Spain
- Rest of Europe
- Asia-Pacific
- China
- India
- Japan
- South Korea
- Rest of Asia-Pacific
- Middle East and Africa
- United Arab Emirates
- Saudi Arabia
- South Africa
- Turkey
- Rest of Middle East and Africa
- North America
Data Sources, Market Sizing, and Validation
Desk Research
Desk work starts with building the demand pool and the vehicle footprint where differentials are installed. We use public production and registration signals from sources such as OICA vehicle production statistics, national transport agencies, and trade statistics published by customs authorities, which help anchor unit volumes by region.
Next, we add technical and policy context so the model stays aligned with adoption patterns. Sources such as the U.S. EPA and European Commission publications, SAE papers, and patent databases are used to understand shifts like AWD penetration, axle architectures, and the growth of e-axles and torque-vectoring solutions. We also review company annual reports, investor presentations, and credible automotive press to track pricing direction and platform changes. Paid subscriptions are used selectively for company financials, shipment-level trade visibility, and patent landscaping. The desk sources named above are illustrative, and many other public references were consulted for data collection, cross-checking, and clarification.
Primary Interviews and Surveys
Primary work is used to pressure-test the build from production units to differential demand and then to revenue, especially where public data is thin. We speak with drivetrain and axle specialists across OEM-facing suppliers, aftermarket stakeholders, and engineering roles. Where fitment and pricing assumptions are unclear, follow-up questions and simple cross-checks across regions are used to close the gaps.
Distribution of primary research fieldwork respondents
| Company type | Respondent position | Region |
|---|---|---|
| Top tier: 35% | CXOs: 16% | APAC: 49% |
| Mid tier: 47% | Functional/Unit leaders: 40% | EMEA: 33% |
| Smaller Players: 18% | Managers: 44% | Americas: 18% |
Market-Sizing & Forecasting
Market sizing uses a top-down demand reconstruction, where vehicle production and parc signals are translated into differential fitment by drivetrain layout, then converted into value using regional pricing. To keep it grounded, the totals are corroborated with selective bottom-up approximations, such as supplier revenue roll-ups for differential related lines, sampled ASP-by-vehicle class checks, and channel feedback on replacement intensity.
A few inputs drive most of the model and are tracked explicitly. These include global light vehicle and commercial vehicle production by region, AWD and 4WD penetration in key nameplate clusters, the share of electrified axles that replace mechanical layouts, the aftermarket replacement cycle tied to vehicle age, and mix shifts between open, limited-slip, and electronically controlled units. Where direct splits are not visible, gaps are handled using proxy ratios discussed in interviews, then constrained by known vehicle architecture rules so shares do not move in an implausible way.
For forecasting, scenario analysis is used around drivetrain mix changes, since electrification speed and AWD adoption do not shift linearly across every region. The trend lines for production, electrified vehicle share, and differential content per vehicle are set first, then pricing is adjusted with moderated inflation and technology mix. The adjusted outlook is reviewed with expert feedback before finalizing the forecast.
Data Validation & Update Cycle
Validation is done through several checks so one weak data series does not dominate the output. Modeled revenue is compared against independent signals such as vehicle build trends, drivetrain mix shifts, and reported component revenue direction, and outliers are investigated before sign-off. When a variance is explained by a real change, such as a platform refresh or an electrified axle shift, the assumptions are updated and re-checked.
Reviews happen in steps, with one analyst rebuilding key calculations and another scanning for unusual movements by region or vehicle type. Reports are refreshed annually, and interim updates are triggered when material events occur, including production shocks or major regulatory changes. Before delivery, the latest public data is re-pulled and the model is re-run so the view reflects the most current available inputs.
Mordor Intelligence's Automotive Differential Market Sizing Compared With Other Published Estimates
Published market values for automotive differentials can look far apart, even when publishers start from similar vehicle production backdrops. The spread usually comes from how each publisher defines what is counted as a differential system, how technology bundling in electrified axles is treated, and which year is used as the start point for pricing and mix.
The main gap comes from whether integrated e-axle content is treated as full differential revenue or whether only the differential element is counted. In Mordor Intelligence's build, value is captured at the differential system level, without rolling the entire electric drive module into the total.
Benchmark comparison
| Source | Market Size | Gaps in Research Methodology |
|---|---|---|
| Mordor Intelligence | USD 22.20 B (2026) | |
| Industry Newswire A | USD 19.70 B (2025) | Uses a different base year and blends technology content more broadly, which can shift value between differential systems and integrated electric axle modules when converting units into revenue. |
| Trade Publisher B | USD 2.68 B (2024) | Appears narrower in product interpretation and often aligns closer to differential subcomponents or selected product types, which pulls down totals versus a full vehicle-installed differential system view. |
The table shows that year choice and what gets counted inside electrified axle packages are the biggest reasons totals do not match. By keeping the demand pool tied to vehicle output, drivetrain layouts, and replacement behavior, and then re-checking pricing with interview inputs, the result stays traceable to clear variables and repeatable steps.


Key Questions Answered in the Report
What is the projected value of the automotive differential market in 2031?
The market is forecast to reach USD 27.81 billion, reflecting a 4.61% CAGR during 2026-2031.
Which drive type is growing fastest within automotive differential demand?
All-wheel drive differentials are advancing at a 5.92% CAGR through 2031 as crossovers proliferate.
How will electric vehicles influence future differential sales?
Battery-electric models will post a 9.12% CAGR, boosted by dual-motor SUVs but constrained by emerging in-wheel motor designs.
Which region currently leads differential manufacturing volume?
Asia-Pacific commands 48.35% share due to large-scale production in China, Japan, and South Korea.
Page last updated on:


 Your data is secure and never sold or shared.


