Market Overview
| Study Period | 2018 - 2031 |
|---|---|
| Forecast Data Period | 2026 - 2031 |
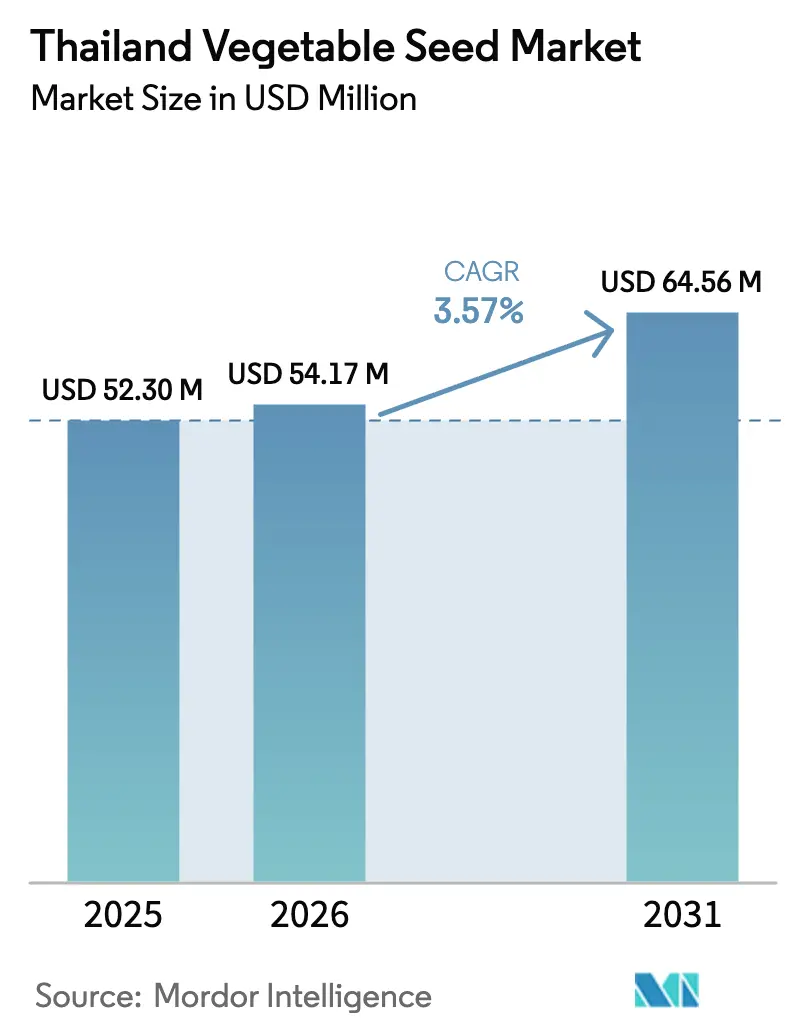
| Base Year Market Size (2025) | USD 52.3 Million |
| Market Size (2026) | USD 54.17 Million |
| Market Size (2031) | USD 64.56 Million |
| Growth Rate (2026 - 2031) | 3.57% CAGR |
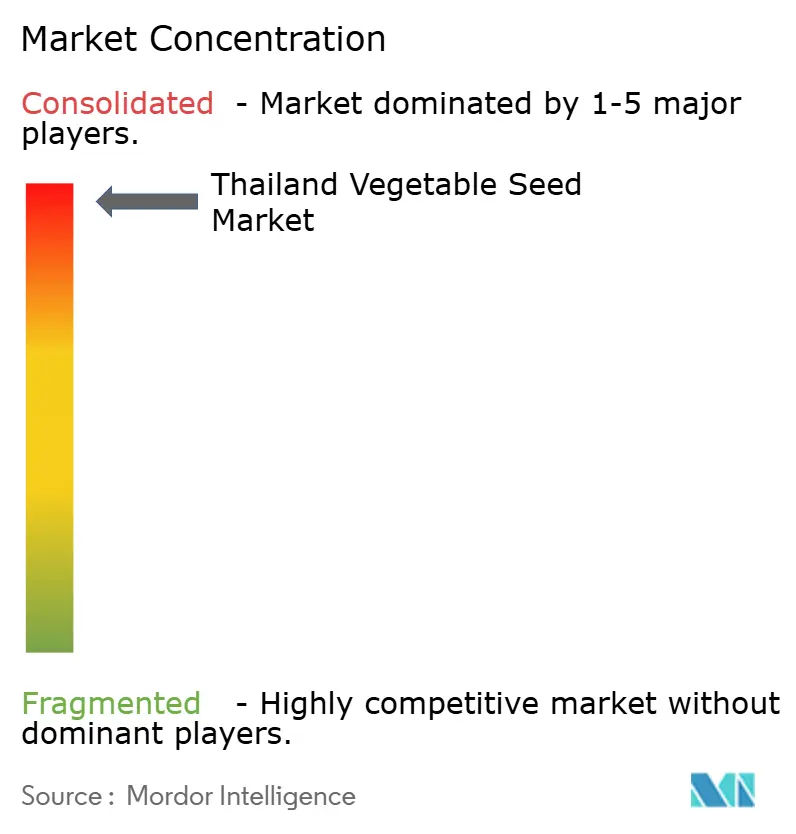
| Market Concentration | High |
Major Players *Disclaimer: Major Players sorted in no particular order Image © Mordor Intelligence. Reuse requires attribution under CC BY 4.0. | |
Thailand Vegetable Seed Market Analysis by Mordor Intelligence
Thailand vegetable seed market size in 2026 is estimated at USD 54.17 million, growing from 2025 value of USD 52.3 million with 2031 projections showing USD 64.56 million, growing at 3.57% CAGR over 2026-2031. Genome-editing policy reforms, rising adoption of drought-resilient hybrids, and greater protected-cultivation acreage support moderate expansion. Seed companies leverage Thailand’s export-friendly logistics to supply fast-growing markets across Southeast Asia, while local farmers increasingly shift from water-intensive rice to higher-value vegetables during dry spells. Climate variability still drives seasonal demand swings, and counterfeit seed inflows from neighboring countries challenge brand integrity, yet streamlined phytosanitary certification now allows quicker order fulfillment for the Association of Southeast Asian Nations (ASEAN) buyers.
Key Report Takeaways
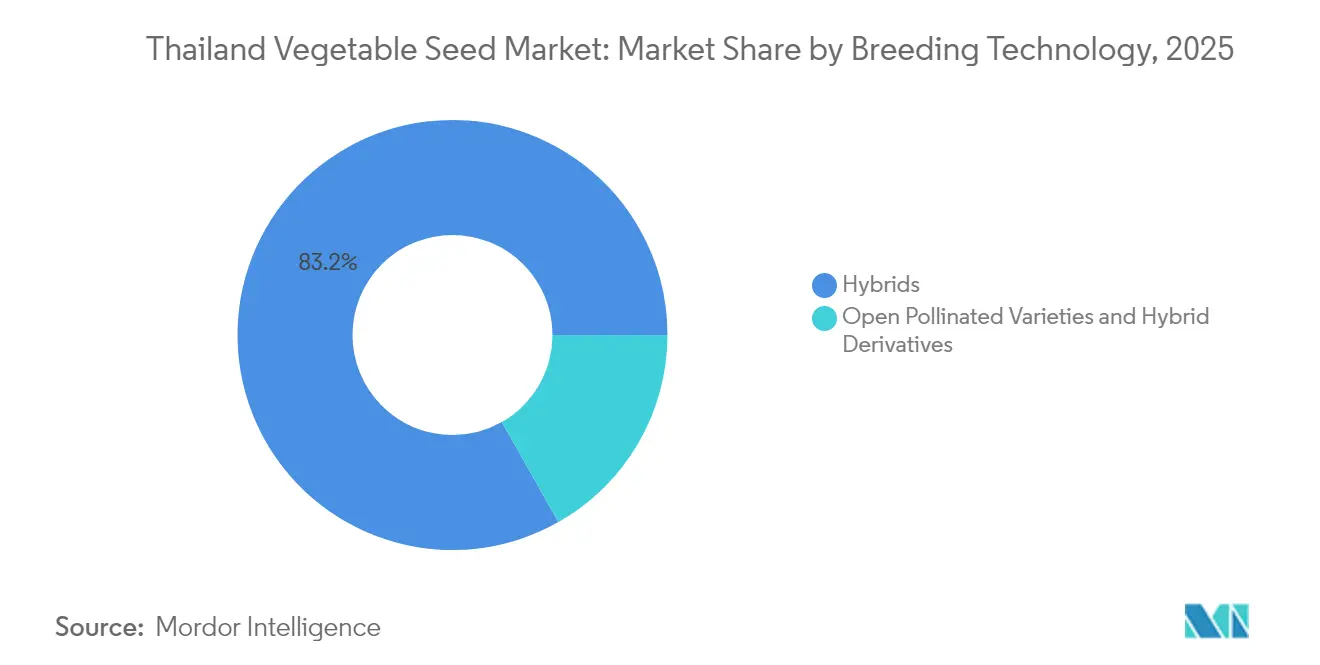
- By breeding technology, hybrids captured 83.20% of Thailand's vegetable seed market share in 2025, and are projected to grow at a 3.68% CAGR through 2031.
- By cultivation mechanism, the open field production still commands a 99.85% share in 2025, and protected cultivation is forecast to expand at a 6.50% CAGR through 2031.
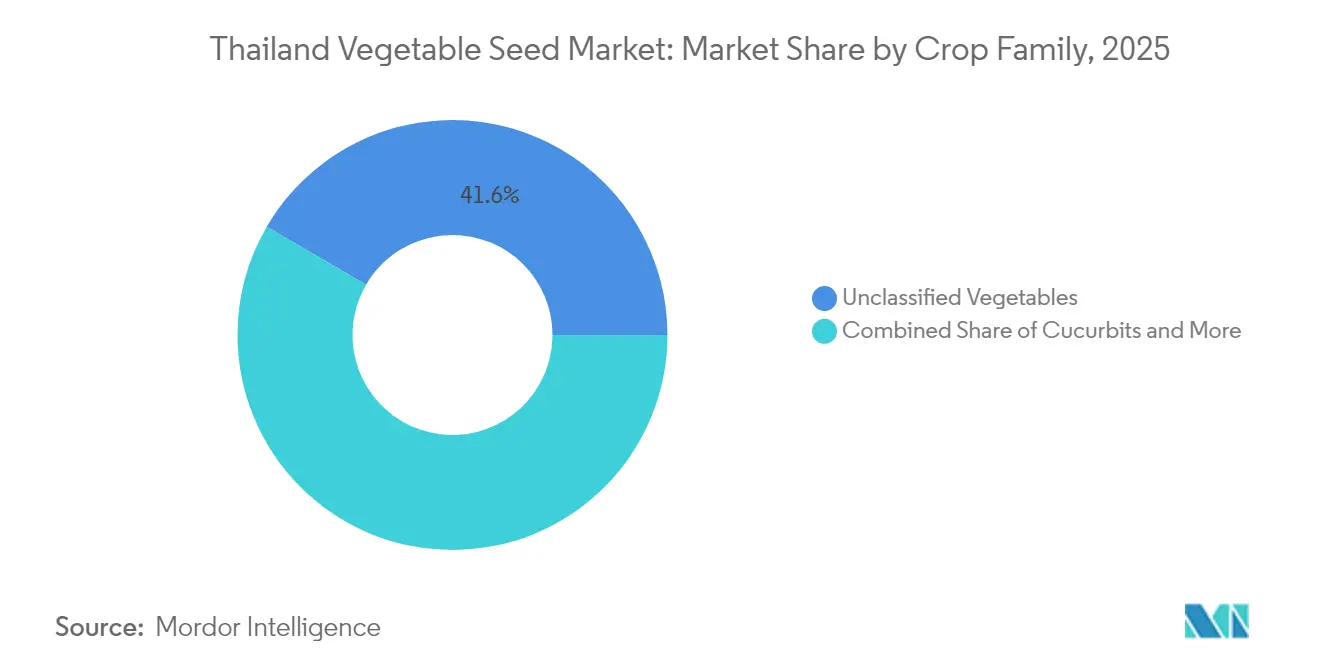
- By crop family, unclassified vegetables accounted for a 41.60% share of the Thailand vegetable seed market size in 2025, while roots and bulbs are poised to grow at a 4.29% CAGR through 2031.
Note: Market size and forecast figures in this report are generated using Mordor Intelligence’s proprietary estimation framework, updated with the latest available data and insights as of 2026.
Thailand Vegetable Seed Market Trends and Insights
Drivers Impact Analysis*
| Driver | (~) % Impact on CAGR Forecast | Geographic Relevance | Impact Timeline |
|---|---|---|---|
| Favorable government policy on genome-edited varieties | +0.8% | National, early uptake in Central Plains | Medium term (2-4 years) |
| Extreme weather-resilient hybrid adoption | +0.6% | National, strongest in drought-prone Northeast | Short term (≤2 years) |
| Expansion of protected cultivation acreage | +0.5% | Central and Northern peri-urban areas | Long term (≥4 years) |
| Private-lab phytosanitary accreditation streamlining exports | +0.4% | Export hubs: Chonburi, Rayong, and Prachuap Khiri Khan | Medium term (2-4 years) |
| Demand shift from water-intensive rice to vegetables in drought years | +0.3% | Northeast and Central Plains during dry seasons | Short term (≤2 years) |
| Rise of Participatory Guarantee System (PGS)/organic producers needing certified seed | +0.2% | Northern organic clusters | Long term (≥4 years) |
| Source: Mordor Intelligence | |||
Favorable Government Policy on Genome-Edited Varieties
Thailand's landmark decision in July 2024 to permit genome-edited crop varieties marks a strategic pivot toward agricultural biotechnology leadership in Southeast Asia.[1]Source: Thailand Board of Investment, “Thailand Approves Genome Editing for Agricultural Use,” BOI.GO.TH The legislation, administered by the Department of Agriculture under the Ministry of Agriculture and Cooperatives, establishes Thailand as the first ASEAN nation to create comprehensive regulatory pathways for gene-edited crops, positioning local seed companies to capture first-mover advantages in regional markets. This regulatory framework enables domestic breeding programs to accelerate development timelines for climate-adapted varieties, reducing dependence on imported germplasm while strengthening intellectual property positions.
Extreme Weather-Resilient Hybrid Adoption
Climate volatility intensification drives systematic shifts toward drought-tolerant and heat-resistant hybrid varieties across Thailand's vegetable production zones. The 2024 growing season witnessed unprecedented adoption rates for climate-resilient hybrids, particularly in tomato and cucumber segments, where farmers experienced 25-30% yield protection during extended dry periods. Advanced breeding programs now prioritize heat tolerance traits, with new releases capable of maintaining fruit set at temperatures exceeding 35°C, addressing critical production bottlenecks during Thailand's increasingly severe hot seasons.
Expansion of Protected Cultivation Acreage
Protected cultivation infrastructure expansion accelerates across Thailand's vegetable production regions, driven by government subsidies and private investment in climate-controlled growing systems. The Royal Initiative projects supported 847 new greenhouse installations in 2024, representing 23% year-over-year growth in protected cultivation capacity.[2]Source: Royal Development Projects Board, “Protected Agriculture Initiative 2024,” RDPB.GO.TH This expansion creates distinct market opportunities for specialized greenhouse varieties, which are optimized for controlled environments and command price premiums of 40-60% over open-field seeds.
Private-Lab Phytosanitary Accreditation Streamlining Exports
Thailand's 2024 expansion of private laboratory accreditation for phytosanitary testing significantly reduces export certification bottlenecks, enhancing competitiveness in regional seed markets. The Department of Agriculture authorized 12 additional private facilities for seed health testing, reducing average certification timelines from 14 days to 5 days for standard export shipments.[3]Source: Plant Quarantine Research Group, “Private Laboratory Accreditation Program,” DOA.GO.TH This efficiency improvement particularly benefits seed exporters targeting just-in-time delivery schedules for neighboring countries' planting seasons, creating competitive advantages over regional suppliers with longer certification processes.
Restraints Impact Analysis*
| Restraint | (~) % Impact on CAGR Forecast | Geographic Relevance | Impact Timeline |
|---|---|---|---|
| Climate-driven seed demand volatility | -0.4% | National, highest in rain-fed zones | Short term (≤2 years) |
| Counterfeit/low-quality seed inflow from neighboring countries | -0.3% | Border provinces: Tak, Mukdahan, Sa Kaeo | Medium term (2-4 years) |
| Smallholder price sensitivity to hybrid seed | -0.2% | Rural areas with limited credit | Long term (≥4 years) |
| Complex Good Agricultural Practice (GAP) certification raising grower costs | -0.1% | Export-oriented production belts | Medium term (2-4 years) |
| Source: Mordor Intelligence | |||
Climate-Driven Seed Demand Volatility
Unpredictable weather patterns create substantial fluctuations in demand for vegetable seeds, complicating inventory planning and revenue forecasting for seed companies operating in Thailand. The 2024 monsoon season's irregular precipitation patterns resulted in 35% demand swings between drought-resistant and flood-tolerant varieties within single growing seasons, straining distribution networks and creating inventory obsolescence risks. Seed retailers report increasing difficulty maintaining optimal stock levels as farmers delay purchasing decisions until weather patterns stabilize, compressing order fulfillment windows and increasing logistics costs.
Counterfeit/Low-Quality Seed Inflow from Neighboring Countries
Illegal importation of substandard and counterfeit vegetable seeds from neighboring countries undermines market confidence and erodes legitimate suppliers' market share across Thailand's border regions. Department of Agriculture enforcement actions in 2024 identified counterfeit seed operations affecting an estimated 15-20% of the market in border provinces, with fake varieties often containing 30-50% lower germination rates than authentic products. The counterfeit trade particularly targets high-value hybrid varieties where price differentials create attractive profit margins for illegal operators, damaging brand reputation for legitimate seed companies, and reducing farmer willingness to invest in premium products.
*Our forecasts treat driver/restraint impacts as directional, not additive. The impact forecasts reflect baseline growth, mix effects, and variable interactions.
Segment Analysis
By Breeding Technology: Hybrids Drive Premium Market Expansion
Hybrids accounted for 83.20% of Thailand's vegetable seed market size in 2025 and are projected to grow at a 3.68% CAGR through 2031. Farmers prefer hybrids for uniformity and disease resistance, and the genome-editing framework now accelerates releases with stacked tolerance traits. The hybrid portfolio tackles bacterial wilt and multiple viruses prevalent across tropical provinces. Open-pollinated varieties and hybrid derivatives keep a modest 16.80% share, serving price-conscious growers who save seed across planting cycles. Commercial hubs near Bangkok and Chiang Mai illustrate how supermarket contracts reward hybrid consistency with higher farmgate prices.
Second-generation hybrids feature extended shelf life and better color retention, reducing post-harvest losses in humid logistics chains. Domestic seed companies collaborate with the National Center for Genetic Engineering and Biotechnology to hasten registration of heat-proof hybrids, aligning with the Department of Agriculture’s streamlined 2024 approval process. Field demonstrations confirm performance under temperatures climbing past 35 °C, strengthening adoption during hotter seasons.


By Cultivation Mechanism: Protected Systems Lead Innovation Adoption
Open field production still commands a 99.85% share in 2025 because Thailand enjoys year-round sunlight and multiple crop cycles. The protected-cultivation slice, though just 0.15% by value, posts a category-leading 6.50% CAGR to 2031. Greenhouse vegetables meet demand from urban health-conscious consumers who pay premiums for pesticide-safe produce. Hydroponic lettuce, basil, and cherry tomato operations around Bangkok use specialized seeds bred for uniform internode length and compact habit.
The Thailand vegetable seed market share for protected-environment hybrids is small yet lucrative. Varieties engineered for soilless media emerge from international breeders that run local screening trials to assess tolerance to high humidity and low light during monsoon months. The Royal Initiative’s subsidy scheme offsets upfront greenhouse costs, and peri-urban growers leverage shorter supply routes to maintain freshness, reinforcing the protected segment’s growth trajectory.
By Crop Family: Diversification Drives Specialty Segments
Unclassified vegetables, a basket that includes iceberg lettuce, asparagus, and snow peas, delivered 41.60% of 2025 sales as restaurants and hotels diversify menus to attract tourists. Premium dining outlets influence farmer crop choice, steering acreage toward higher-value specialties. Roots and bulbs, led by garlic and onion, are the fastest climbers at a 4.29% CAGR to 2031 because regional cuisines require a year-round supply, and exporters favor Thai varieties adapted to tropical curing conditions.
Solanaceae crops remain staple revenue drivers given Thai cuisine’s heavy use of chili and tomato. Breeding pipelines emphasize fruit-set stability under extreme heat, and pick-up in paste tomato processing spurs demand for high-solids hybrids. Brassicas and cucurbits maintain stable niches, with gourd varieties tweaked for virus resistance to cut pesticide applications in humid lowlands. Newly released asparagus cultivars tailored to Thai daylength underline the industry’s shift toward higher-margin minor crops.
Geography Analysis
Domestic sales dominate the Thailand vegetable seed market, but export volume keeps rising as accredited private labs slash phytosanitary wait times. Seed shipments to Vietnam and Cambodia expanded 18% after accreditation reforms. Climate parallels across Indochina let Thai-bred hybrids perform reliably in neighboring fields, giving local firms a competitive edge. Academic hubs such as Kasetsart University foster breeding talent that neighboring countries lack, reinforcing Thailand’s status as a regional seed nucleus.
Bangkok’s metropolitan food scene pulls premium produce from Central and Northern greenhouses, validating protected cultivation investments. Border provinces face unique challenges: legitimate trade routes coexist with counterfeit inflows that tarnish brand reputation. Joint patrols and QR-code seed traceability projects aim to protect growers in Tak and Mukdahan from fraudulent stock.
Border provinces play crucial roles in both legitimate trade and counterfeit seed challenges, requiring enhanced enforcement coordination with neighboring countries to protect market integrity. The government's 2024 expansion of private laboratory accreditation for phytosanitary testing significantly improves export competitiveness by reducing certification timelines from 14 days to 5 days for standard shipments. This efficiency improvement enables Thailand-based companies to capture time-sensitive export opportunities and emergency replacement orders during regional crop failures, generating premium pricing for rapid-delivery services.
Competitive Landscape
The five largest players, Groupe Limagrain, Known You Seed Co. Ltd., Syngenta Group, Rijk Zwaan Zaadteelt en Zaadhandel B.V., and Enza Zaden Beheer B.V., held a significant combined share in 2024, leaving little room for newcomers. Dominance stems from deep R and D budgets, proprietary germplasm, and nationwide dealer networks. Syngenta installed artificial-intelligence holographic labels on hybrid tomato packets in 2025 to combat counterfeiting.
Rijk Zwaan certified seven Thai facilities under Good Seed and Plant Practices, reinforcing its quality claim in export deals. Groupe Limagrain expanded greenhouse screening plots near Chiang Mai to fast-track heat-tolerant lettuce. White-space opportunities persist in niche crops such as okra and yard-long bean for protected systems, where smaller domestic firms can build early market positions.
Thailand’s genome-editing law further differentiates companies with CRISPR pipelines that promise precise trait stacking. Consolidation prospects remain high because local brands lacking biotech capacity may license genetics from larger multinationals rather than fund costly breeding programs.
Thailand Vegetable Seed Industry Leaders
Groupe Limagrain
Enza Zaden Beheer B.V.
Known You Seed Co. Ltd.
Rijk Zwaan Zaadteelt en Zaadhandel B.V.
Syngenta Group
- *Disclaimer: Major Players sorted in no particular order

Recent Industry Developments
- June 2025: East-West Seed Thailand introduced new vegetable varieties: Chok Anan 2 (bitter gourd), Phupa 2 (wax gourd), and Khao Yai 2 (pumpkin). These varieties are developed to increase yield, disease resistance, and market value while meeting the specific requirements of Thai farmers.
- April 2025: Source.ag and Axia Vegetable Seeds formed a partnership to optimize tomato breeding programs through artificial intelligence-based cultivation methods. The collaboration enhances Axia's breeding operations in Thailand and other regions by improving trial data collection and crop yield performance.
- February 2025: Advanta Seeds and KPAGRO established a sweet corn seed drying facility in Lopburi, Thailand, to improve seed quality and processing efficiency. This facility reinforces Thailand's position as a global center for tropical sweet corn seed production.


Thailand Vegetable Seed Market Report Scope
Hybrids, Open Pollinated Varieties & Hybrid Derivatives are covered as segments by Breeding Technology. Open Field, Protected Cultivation are covered as segments by Cultivation Mechanism. Brassicas, Cucurbits, Roots & Bulbs, Solanaceae, Unclassified Vegetables are covered as segments by Crop Family.Breeding Technology
| Hybrids |
| Open Pollinated Varieties and Hybrid Derivatives |
Cultivation Mechanism
| Open Field |
| Protected Cultivation |
Crop Family
| Brassicas | Cabbage |
| Cauliflower and Broccoli | |
| Other Brassicas | |
| Cucurbits | Cucumber and Gherkin |
| Pumpkin and Squash | |
| Other Cucurbits | |
| Roots and Bulbs | Garlic |
| Onion | |
| Potato | |
| Other Roots and Bulbs | |
| Solanaceae | Chilli |
| Eggplant | |
| Tomato | |
| Other Solanaceae | |
| Unclassified Vegetables | Asparagus |
| Lettuce | |
| Peas | |
| Other Unclassified Vegetables |
| Breeding Technology | Hybrids | |
| Open Pollinated Varieties and Hybrid Derivatives | ||
| Cultivation Mechanism | Open Field | |
| Protected Cultivation | ||
| Crop Family | Brassicas | Cabbage |
| Cauliflower and Broccoli | ||
| Other Brassicas | ||
| Cucurbits | Cucumber and Gherkin | |
| Pumpkin and Squash | ||
| Other Cucurbits | ||
| Roots and Bulbs | Garlic | |
| Onion | ||
| Potato | ||
| Other Roots and Bulbs | ||
| Solanaceae | Chilli | |
| Eggplant | ||
| Tomato | ||
| Other Solanaceae | ||
| Unclassified Vegetables | Asparagus | |
| Lettuce | ||
| Peas | ||
| Other Unclassified Vegetables | ||


Market Definition
- Commercial Seed - For the purpose of this study, only commercial seeds have been included as part of the scope. Farm-saved Seeds, which are not commercially labeled are excluded from scope, even though a minor percentage of farm-saved seeds are exchanged commercially among farmers. The scope also excludes vegetatively reproduced crops and plant parts, which may be commercially sold in the market.
- Crop Acreage - While calculating the acreage under different crops, the Gross Cropped Area has been considered. Also known as Area Harvested, according to the Food & Agricultural Organization (FAO), this includes the total area cultivated under a particular crop across seasons.
- Seed Replacement Rate - Seed Replacement Rate is the percentage of area sown out of the total area of crop planted in the season by using certified/quality seeds other than the farm-saved seed.
- Protected Cultivation - The report defines protected cultivation as the process of growing crops in a controlled environment. This includes greenhouses, glasshouses, hydroponics, aeroponics, or any other cultivation system that protects the crop against any abiotic stress. However, cultivation in an open field using plastic mulch is excluded from this definition and is included under open field.
| Keyword | Definition |
|---|---|
| Row Crops | These are usually the field crops which include the different crop categories like grains & cereals, oilseeds, fiber crops like cotton, pulses, and forage crops. |
| Solanaceae | These are the family of flowering plants which includes tomato, chili, eggplants, and other crops. |
| Cucurbits | It represents a gourd family consisting of about 965 species in around 95 genera. The major crops considered for this study include Cucumber & Gherkin, Pumpkin and squash, and other crops. |
| Brassicas | It is a genus of plants in the cabbage and mustard family. It includes crops such as carrots, cabbage, cauliflower & broccoli. |
| Roots & Bulbs | The roots and bulbs segment includes onion, garlic, potato, and other crops. |
| Unclassified Vegetables | This segment in the report includes the crops which don’t belong to any of the above-mentioned categories. These include crops such as okra, asparagus, lettuce, peas, spinach, and others. |
| Hybrid Seed | It is the first generation of the seed produced by controlling cross-pollination and by combining two or more varieties, or species. |
| Transgenic Seed | It is a seed that is genetically modified to contain certain desirable input and/or output traits. |
| Non-Transgenic Seed | The seed produced through cross-pollination without any genetic modification. |
| Open-Pollinated Varieties & Hybrid Derivatives | Open-pollinated varieties produce seeds true to type as they cross-pollinate only with other plants of the same variety. |
| Other Solanaceae | The crops considered under other Solanaceae include bell peppers and other different peppers based on the locality of the respective countries. |
| Other Brassicaceae | The crops considered under other brassicas include radishes, turnips, Brussels sprouts, and kale. |
| Other Roots & Bulbs | The crops considered under other roots & bulbs include Sweet Potatoes and cassava. |
| Other Cucurbits | The crops considered under other cucurbits include gourds (bottle gourd, bitter gourd, ridge gourd, Snake gourd, and others). |
| Other Grains & Cereals | The crops considered under other grains & cereals include Barley, Buck Wheat, Canary Seed, Triticale, Oats, Millets, and Rye. |
| Other Fibre Crops | The crops considered under other fibers include Hemp, Jute, Agave fibers, Flax, Kenaf, Ramie, Abaca, Sisal, and Kapok. |
| Other Oilseeds | The crops considered under other oilseeds include Ground nut, Hempseed, Mustard seed, Castor seeds, safflower seeds, Sesame seeds, and Linseeds. |
| Other Forage Crops | The crops considered under other forages include Napier grass, Oat grass, White clover, Ryegrass, and Timothy. Other forage crops were considered based on the locality of the respective countries. |
| Pulses | Pigeon peas, Lentils, Broad and horse beans, Vetches, Chickpeas, Cowpeas, Lupins, and Bambara beans are the crops considered under pulses. |
| Other Unclassified Vegetables | The crops considered under other unclassified vegetables include Artichokes, Cassava Leaves, Leeks, Chicory, and String beans. |


Research Methodology
Mordor Intelligence follows a four-step methodology in all our reports.
- Step-1: IDENTIFY KEY VARIABLES: In order to build a robust forecasting methodology, the variables and factors identified in Step-1 are tested against available historical market numbers. Through an iterative process, the variables required for market forecast are set and the model is built on the basis of these variables.
- Step-2: Build a Market Model: Market-size estimations for the forecast years are in nominal terms. Inflation is not a part of the pricing, and the average selling price (ASP) is kept constant throughout the forecast period.
- Step-3: Validate and Finalize: In this important step, all market numbers, variables and analyst calls are validated through an extensive network of primary research experts from the market studied. The respondents are selected across levels and functions to generate a holistic picture of the market studied.
- Step-4: Research Outputs: Syndicated Reports, Custom Consulting Assignments, Databases, and Subscription Platforms


