Market Overview
| Study Period | 2021 - 2031 |
|---|---|
| Forecast Data Period | 2026 - 2031 |
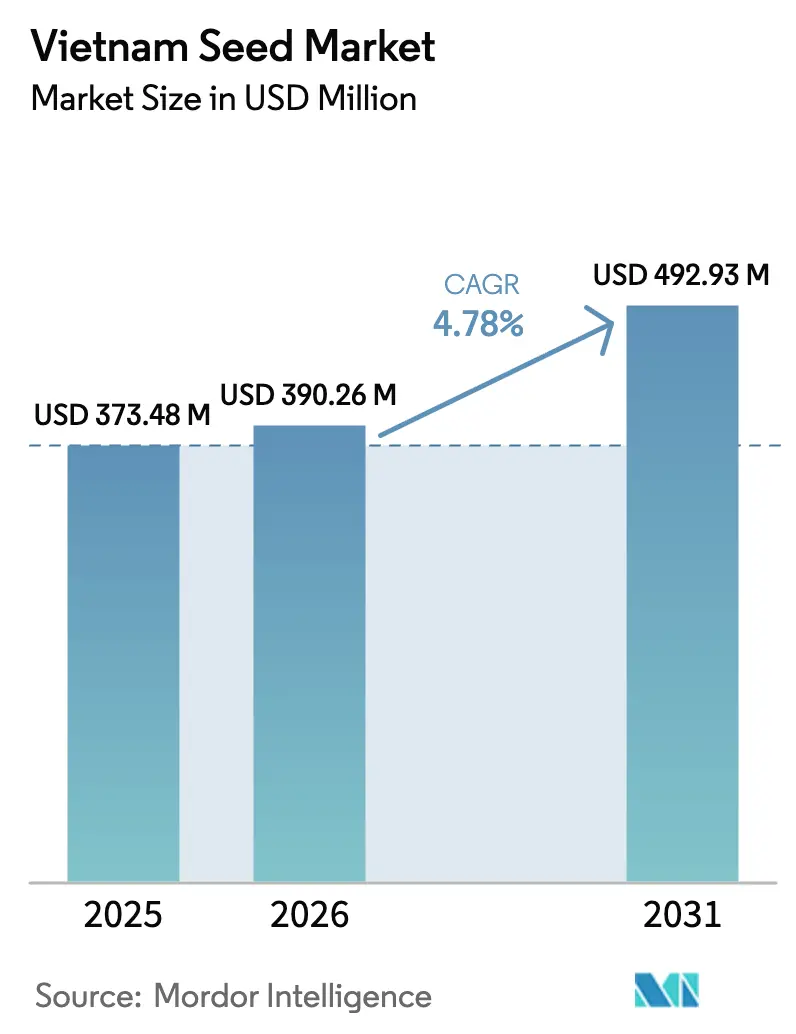
| Base Year Market Size (2025) | USD 373.48 Million |
| Market Size (2026) | USD 390.26 Million |
| Market Size (2031) | USD 492.93 Million |
| Growth Rate (2026 - 2031) | 4.78% CAGR |
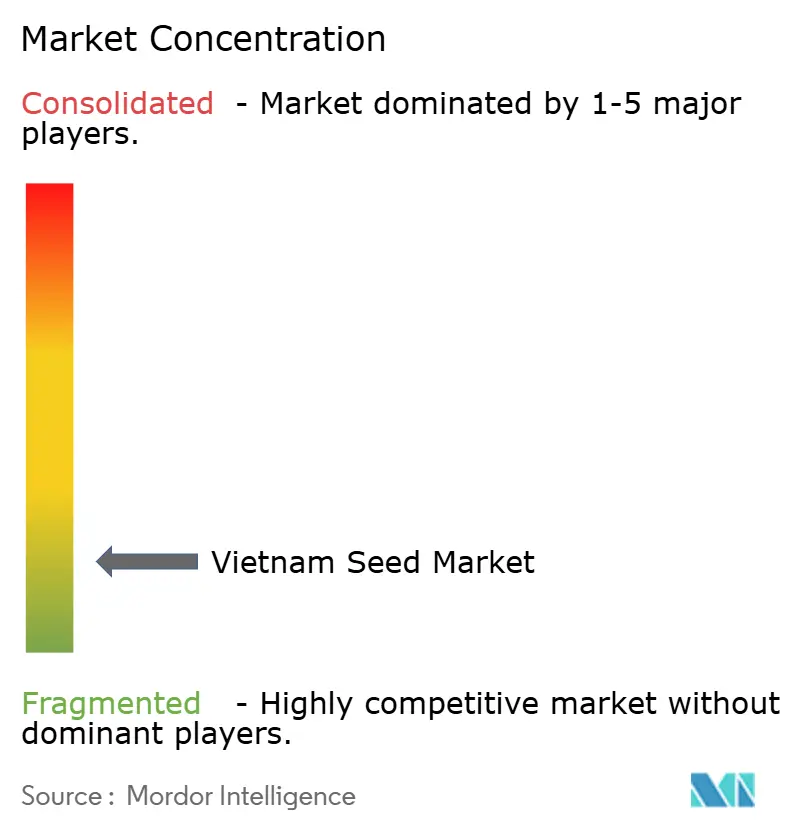
| Market Concentration | Low |
Major Players *Disclaimer: Major Players sorted in no particular order Image © Mordor Intelligence. Reuse requires attribution under CC BY 4.0. | |
Vietnam Seed Market Analysis by Mordor Intelligence
The Vietnam seed market size was valued at USD 373.48 million in 2025 and estimated to grow from USD 390.26 million in 2026 to reach USD 492.93 million by 2031, at a CAGR of 4.78% during the forecast period (2026-2031). Steady growth in rice exports, rising demand for vegetables, and the adoption of climate-smart cultivation practices are driving moderate expansion in Vietnam's seed market. For instance, in 2025, Vietnam was a key player in rice exports. According to the Vietnam Customs Department (VCA), the country exported over 8.06 million metric tons of rice in 2025, generating approximately USD 4.1 billion in foreign exchange earnings[1]Source: General Department of Vietnam Customs, “Vietnam Rice Export Statistics 2025,” customs.gov.vn. Genetically modified (GM) corn is increasingly being adopted across national maize acreage, raising the share of hybrid seed and reshaping competitive dynamics around trait access. Vegetable exporters pursuing European Union buyers are driving seed demand toward high-traceability hybrids, while protected cultivation is increasing seed use per hectare in peri-urban zones. Counterfeit seed networks and cold-chain gaps still suppress market potential, but digital traceability mandates starting July 2026 are tipping the balance toward certified suppliers.
Key Report Takeaways
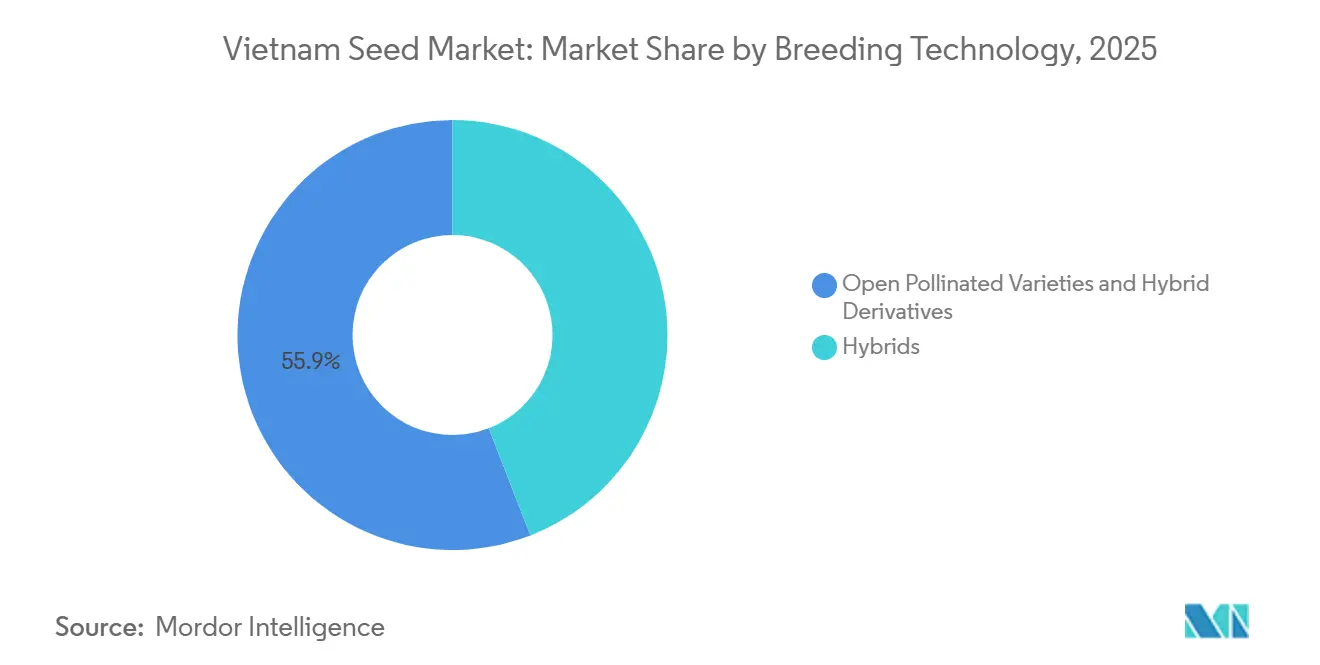
- By breeding technology, open-pollinated varieties and hybrid derivatives accounted for the largest share of the Vietnam seed market in 2025, representing 55.9% of total revenue. Meanwhile, hybrid seeds are anticipated to be the fastest-growing segment, with a projected CAGR of 4.8% through 2031.
- By cultivation mechanism, open-field cultivation accounted for 99.8% of the Vietnam seed market share in 2025. Meanwhile, protected cultivation represents the fastest-growing segment and is projected to expand at a CAGR of 12.6% through 2031.
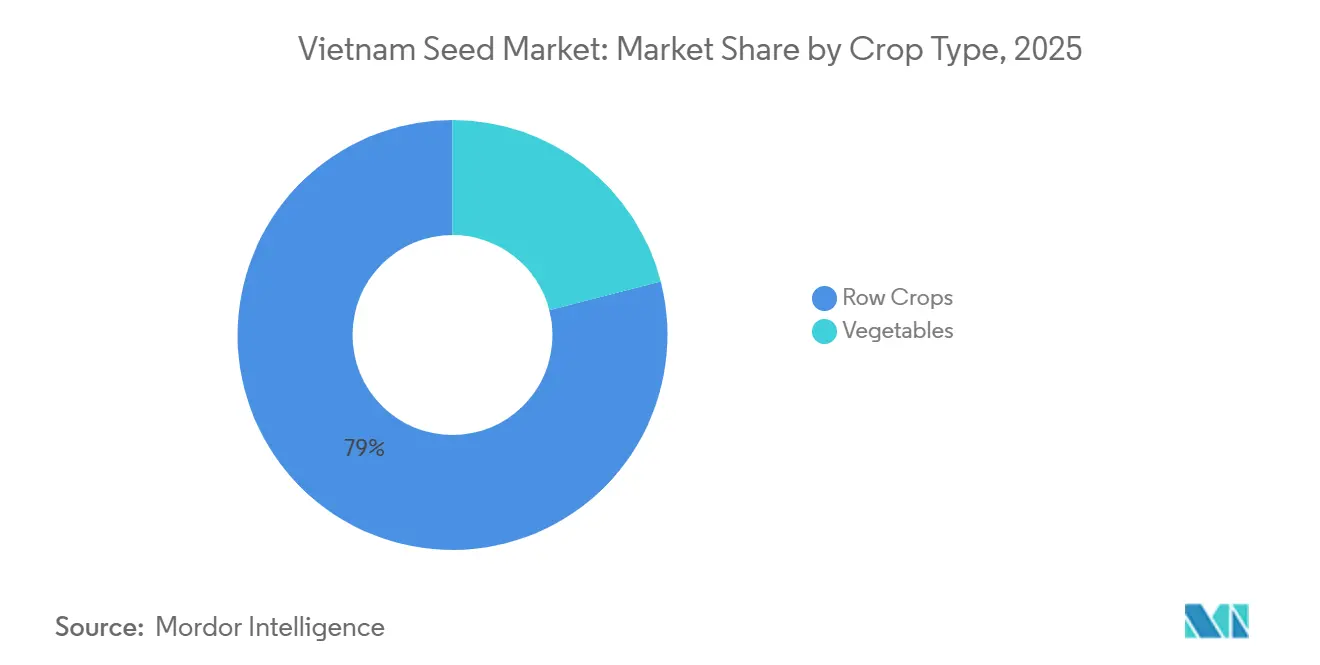
- By crop type, row crops were the largest segment, contributing 79.0% share of the Vietnam seed market size in 2025, while vegetables are the fastest growing segment, moving at a 7.0% CAGR through 2031.
Note: Market size and forecast figures in this report are generated using Mordor Intelligence’s proprietary estimation framework, updated with the latest available data and insights as of 2026.
Vietnam Seed Market Trends and Insights
Drivers Impact Analysis*
| Driver | (~) % Impact on CAGR Forecast | Geographic Relevance | Impact Timeline |
|---|---|---|---|
| Government subsidies for certified seeds | +1.2% | National, with the highest uptake in the Mekong Delta and the Red River Delta | Short term (≤ 2 years) |
| Hybrid and Genetically modified (GM) seed adoption for yield gains | +1.5% | National, concentrated in corn-growing provinces (Tây Nguyên, and Đông Nam Bộ) | Medium term (2-4 years) |
| Export-led demand for vegetables and rice | +0.8% | Southern Vietnam, the Central Highlands for vegetables, and the Mekong Delta for rice | Short to Medium term |
| Mekong Delta salt-tolerant rice trials | +0.4% | Mekong Delta provinces (Cà Mau, Bạc Liêu, Sóc Trăng, and Kiên Giang) | Medium term (2-4 years) |
| Digital seed traceability pilots | +0.3% | Export-oriented provinces (Lâm Đồng, Đà Lạt, and Long An) | Short term (≤ 2 years) |
| Agricultural technology venture capital-backed domestic seed start-ups | +0.2% | Urban innovation hubs (Hanoi, Ho Chi Minh City) with field trials nationwide | Long term (≥ 4 years) |
| Source: Mordor Intelligence | |||
Government Subsidies for Certified Seeds
Government-backed subsidies for certified seeds are a foundational driver of Vietnam’s seed market growth. The Ministry of Agriculture and Rural Development (MARD) has consistently promoted the use of certified seed to improve crop productivity, varietal purity, and climate resilience. In 2024, International Rice Research Institute (IRRI) joins forces with Vietnam Seed Corporation to develop premium rice seed varieties[2]Source: International Rice Research Institute, “IRRI and Vietnam Seed Corporation Partner on Premium Rice Varieties,” irri.org. Through provincial-level agricultural extension programs and seed distribution schemes, farmers are encouraged to shift from farm-saved seeds to certified hybrid and improved varieties. In key agricultural zones such as the Mekong Delta and Red River Delta, subsidy-supported programs focus heavily on rice seed replacement cycles. Certified seed use improves germination rates, uniformity, and disease resistance, translating into higher yields and export-quality output.
Hybrid and Genetically modified (GM) Seed Adoption for Yield Gains
Vietnam has experienced steady growth in hybrid seed adoption, particularly in maize and vegetables. Hybrid seeds offer higher yield potential, uniform crop maturity, and better stress tolerance, attributes that are critical in a country vulnerable to climate variability. While genetically modified (GM) adoption remains regulated, hybrid seed penetration in corn exceeds 80%, reflecting strong farmer acceptance of yield-enhancing technologies. In provinces such as Tây Nguyên (Central Highlands) and Đông Nam Bộ (Southeast), commercial crop production encourages farmers to adopt higher-performing hybrid varieties. Rising labor costs and shrinking farm sizes further incentivize farmers to maximize yield per hectare using improved seed genetics.
Export-Led Demand Growth for Vegetables and Rice
Vietnam is among the world’s largest rice exporters and a rapidly expanding exporter of fruits and vegetables. According to the General Department of Customs, Vietnam’s fruit and vegetable exports reached USD 1.91 billion in 2025, a 15.1% increase from 2024[3]Source: General Department of Vietnam Customs, “Fruit and Vegetable Export Performance 2025,” customs.gov.vn. Export markets, particularly China, the European Union, Australia, Brunei, Canada, Chile, Japan, Malaysia, and Mexico, require high-quality, traceable, and uniform crop outputs. This has driven demand for certified, high-performance seed varieties that comply with phytosanitary and quality standards. Southern Vietnam and the Central Highlands have emerged as key regions for export-oriented vegetable cultivation, while the Mekong Delta remains a major hub for rice exports. Export-focused production necessitates seeds with consistent performance and disease resistance, encouraging farmers to rely on formal seed suppliers.
Mekong Delta Salt-Tolerant Rice Trials
Salinity intrusion caused by climate change in the Mekong Delta has increased the demand for salt-tolerant rice varieties. Rising sea levels and upstream dam activities have intensified saltwater intrusion, impacting millions of hectares of agricultural land. In response, seed companies are developing salt-tolerant and climate-resilient rice hybrids. Provincial governments in Cà Mau, Bạc Liêu, Sóc Trăng, and Kiên Giang are actively supporting climate-adaptive seed trials. These efforts are creating new demand segments within the rice seed market and encouraging research and development investments by both domestic and international firms. According to the World Bank and Vietnam’s Institute of Agricultural Sciences, salinity intrusion affects over 1.5 million hectares in the Mekong Delta, driving the adoption of salt-tolerant rice varieties.
Restraints Impact Analysis*
| Restraint | (~) % Impact on CAGR Forecast | Geographic Relevance | Impact Timeline |
|---|---|---|---|
| Counterfeit seeds and informal distribution networks | -1.1% | National, most severe in remote provinces (Northwest and Central Highlands) | Short term (≤ 2 years) |
| High R&D cost and Genetically modified (GM) approval delays | -0.6% | National affecting multinational seed developers and domestic biotech start-ups | Long term (≥ 4 years) |
| Fragmented cold-chain for vegetable seed last-mile delivery | -0.4% | Central Highlands and Northern mountain provinces | Medium term (2-4 years) |
| Declining farm size suppressing per-unit seed spend | -0.3% | National accelerating in the Red River Delta and peri-urban zones | Long term (≥ 4 years) |
| Source: Mordor Intelligence | |||
Counterfeit Seeds and Informal Distribution Networks
Counterfeit seeds pose a significant short-term challenge to Vietnam's seed market. Informal distribution channels, especially in remote provinces and mountainous areas, supply low-quality or counterfeit seeds, eroding farmers' trust in branded suppliers. These counterfeit products compromise yield reliability and harm varietal integrity. The Northwest provinces and parts of the Central Highlands are particularly affected due to fragmented supply chains. This situation hampers the growth of the formal seed sector and discourages investment in premium hybrid and biotech varieties. Unofficial trading channels often distribute mislabeled paddy and maize seeds with germination rates well below acceptable standards, diminishing farmer confidence and reducing the likelihood of repeat purchases.
High R&D Cost and Genetically Modified (GM) Approval Delays
Developing new hybrid or biotech seed varieties demands substantial investment in research and development, extensive multi-year field trials, and compliance with regulatory approval processes. In Vietnam, obtaining approvals for Genetically Modified (GM) seeds involves biosafety assessments and public consultations, which prolong commercialization timelines. These regulatory requirements increase capital intensity, discouraging smaller domestic firms from pursuing biotech seed development. Multinational companies also encounter delays in obtaining approvals, which hinders the expansion of their product pipelines. Consequently, the commercialization process becomes both resource-intensive and time-consuming. This underscores the importance of implementing streamlined procedures to assist smaller firms in overcoming these challenges effectively.
*Our forecasts treat driver/restraint impacts as directional, not additive. The impact forecasts reflect baseline growth, mix effects, and variable interactions.
Segment Analysis
By Breeding Technology: Hybrid Momentum Builds on Traditional Base
Open-pollinated varieties and hybrid derivatives were the largest segment, holding 55.9% of the Vietnam seed market share in 2025, signaling a gradual pivot away from traditional open-pollinated cultivars. Open-pollinated varieties and hybrids dominate traditional agricultural systems. Hybrid derivatives, such as improved hybrid lines, three-way crosses, or farmer-recycled hybrid offspring, maintain a significant market presence because they offer moderate yield improvements at a lower cost than full hybrids. Vietnam has seen a rapid increase in the adoption of hybrid seeds for crops like maize and certain vegetables. For instance, hybrid maize can achieve yields 15–30% higher than those of traditional open-pollinated varieties and hybrids under optimal management conditions.
Hybrid seeds are the fastest growing segment, projected to expand at a 4.8% CAGR through 2031. Pure hybrid seeds, including F1 corn, hybrid rice, and hybrid vegetable seeds, are growing faster, albeit from a smaller base. The Vietnam seed market for hybrids is poised to grow alongside rising export-quality thresholds. Rice hybrids with cytoplasmic male sterility and two-line systems gain traction due to labor savings in seed multiplication, while triple-stacked corn hybrids integrate insect resistance and herbicide tolerance traits suited for mechanized Red River Delta farms.


By Cultivation Mechanism: Protected Cultivation Generates Premium Demand
Open field cultivation dominated the Vietnam seed market in 2025, accounting for the overwhelming majority of total cultivation practices. This dominance is primarily supported by the country’s strong performance in rice production and exports, which continue to reinforce large-scale open field farming systems. As Vietnam remains a key global rice supplier, sustained export growth has strengthened demand for high-quality, high-yielding seed varieties suited to open field conditions.
Protected cultivation is set to register the highest growth rate among cultivation mechanisms, posting a 12.6% CAGR to 2031, driven by the continued development of greenhouse and shade-house infrastructure. Protected cultivation supports 3-4 vegetable crop cycles per year compared to 2 cycles in open fields, tripling seed demand per hectare. It also shifts varietal preferences toward hybrids such as indeterminate tomato, European cucumber, and colored bell pepper, which perform well in controlled environments.
By Crop Type: Vegetables Lead Growth as Row Crops Stabilize
Row crops accounted for the largest contribution to the Vietnam seed market size in 2025, capturing 79.0% of the total market share, driven primarily by strong rice exports during the year. Hybrid corn seed sales rose in 2024, and genetically modified (GM) hybrids accounted for nearly half of total plantings, significantly boosting the size of the Vietnam corn seed market. The sustained expansion of export-oriented rice cultivation continues to reinforce certified seed replacement rates across key producing regions. Meanwhile, increasing farmer preference for higher-yielding and pest-resistant GM corn hybrids is accelerating varietal upgrades and supporting premium seed adoption across major maize-growing provinces.
Rising steadily at a 7.0% CAGR through 2031, vegetables are emerging as the fastest-growing crop segment, gaining ground on row crops amid growing export expectations for consistent quality and full traceability. Vegetable demand bifurcates into premium export hybrids versus low-cost domestic open-pollinated seed. Export-oriented growers in Lâm Đồng, Đà Lạt, and Long An provinces purchase hybrid tomato, cucumber, pepper, and cabbage seed from East-West Seed, Rijk Zwaan, and Takii, paying in the range of USD 80–120 per hectare for seed that delivers uniform fruit size, color, and shelf life required by European and Japanese buyers.
Geography Analysis
Vietnam's seed demand is closely tied to region-specific crop portfolios. In 2024, the Mekong Delta remained Vietnam's primary rice-producing area, with the spring crop covering 1,487.7 thousand hectares. In the Red River Delta provinces, farmers cultivate two rice crops and a winter maize crop, necessitating the use of short-duration seeds to fit within tight harvest schedules. The Red River Delta, which includes Hanoi and its surrounding provinces, features a more diverse crop mix, including rice, vegetables, and flowers. This diversity limits per-farm seed expenditure and encourages the use of informal distribution channels. In the northern mountain zones, sticky rice and temperate vegetables are preferred, but farmers often rely on farm-saved seeds due to the region's distance from markets and its varied microclimates.
Protected cultivation centers in Ha Nam, Hai Duong, and Da Lat benefit from altitude and cool nighttime temperatures, making them suitable for high-value crops such as lettuce and strawberries. Ho Chi Minh City serves as the largest seed distribution hub, channeling imported vegetable seeds from countries like the Netherlands and Japan through bonded warehouses and repackaging centers. Additionally, cross-border seed flows with Cambodia and Laos contribute to the regional market, supported by Association of Southeast Asian Nations trade facilitation measures and harmonized phytosanitary certification processes.
Government policies reflect regional agricultural priorities. For instance, the Mekong Delta benefits from digital extension tablets provided under the RiceMoRe program, while northern provinces receive subsidies for greenhouse development. The Central Highlands is supported through coffee seed research grants. Infrastructure improvements, including the development of four-lane expressways and cold storage facilities at seaports, enhance seed distribution efficiency to both local farms and export markets. Geographic growth dynamics are influenced by factors such as export market access, climate adaptation requirements, and ongoing infrastructure investments.
Competitive Landscape
The Vietnam seed market exhibits moderate fragmentation, with the top five companies being Vietnam National Seed Group (Vinaseed), East-West Seed, Syngenta Group, Bayer AG, and Corteva Agriscience. Vietnam National Seed Group (Vinaseed) is the leading domestic player, offering a diverse product portfolio that includes rice, corn, and vegetable seeds. Competitive strategies in the market are divided into two main approaches. Multinational companies are focusing on investments in local breeding infrastructure, digital traceability platforms, and biosafety dossier development to target premium market segments.
Opportunities are emerging in areas such as climate-resilient genetics, digital seed authentication, and protected cultivation varieties. Companies participate in the seed market through vertically integrated grain businesses, leveraging their operational structures to supply seeds. ThaiBinh Seed specializes in the production and distribution of premium rice seeds and holds a significant share of the rice segment. Foreign companies, including Enza Zaden, Known-You Seed, Bayer, and Groupe Limagrain, actively compete by offering advanced products such as protected vegetable hybrids and corn trait stacks.
Digital transformation is gaining momentum as companies introduce dealer apps featuring live germination test results, expiry alerts, and loyalty coupons to combat counterfeit seed trade. Regulatory compliance is becoming a key competitive advantage, driven by the Ministry of Agriculture and Rural Development's plan to address counterfeit seeds, fertilizers, and pesticides. This initiative favors formal channel players who can meet certification audits and traceability requirements over informal traders.
Vietnam Seed Industry Leaders
Vietnam National Seed Group (Vinaseed)
East-West Seed
Syngenta Group
Bayer AG
Corteva Agriscience
- *Disclaimer: Major Players sorted in no particular order

Recent Industry Developments
- August 2025: Vinaseed enhanced its international collaboration in plant breeding. The three parties presented their respective capabilities, development strategies, and discussed opportunities for cooperation in the research, breeding, production, and commercialization of rice, maize, and vegetable seed varieties.
- October 2025: Vietnam will supply rice seeds to Cuba for its 2026 crop season, strengthening agricultural cooperation between the two countries. This agreement reflects Vietnam’s growing role in the international seed trade and support for food security initiatives in allied nations.


Vietnam Seed Market Report Scope
A seed is a small unit containing an embryo, a food supply, and a protective seed coat, enabling it to develop into a new plant under suitable conditions.
The Vietnam Seed Market Report categorizes the market by breeding technology, cultivation mechanism, and crop type. It covers hybrids, open-pollinated varieties, and hybrid derivatives under breeding technology; open field and protected cultivation under cultivation mechanism; and row crops and vegetables under crop type. Market projections are presented in both value (USD) and volume (metric tons).
Breeding Technology
| Hybrids | Non-Transgenic Hybrids | |
| Transgenic Hybrids | Herbicide Tolerant Hybrids | |
| Insect Resistant Hybrids | ||
| Open Pollinated Varieties and Hybrid Derivatives | ||
Cultivation Mechanism
| Open Field |
| Protected Cultivation |
Crop Type
| Row Crops | Fiber Crops | Cotton |
| Other Fiber Crops | ||
| Forage Crops | Alfalfa | |
| Forage Corn | ||
| Other Forage Crops | ||
| Grains and Cereals | Corn | |
| Rice | ||
| Other Grains and Cereals | ||
| Oilseeds | Canola, Rapeseed and Mustard | |
| Soybean | ||
| Other Oilseeds | ||
| Pulses | ||
| Vegetables | Brassicas | Cabbage |
| Carrot | ||
| Cauliflower and Broccoli | ||
| Other Brassicas | ||
| Cucurbits | Cucumber and Gherkin | |
| Pumpkin and Squash | ||
| Other Cucurbits | ||
| Roots and Bulbs | Garlic | |
| Onion | ||
| Potato | ||
| Other Roots and Bulbs | ||
| Solanaceae | Chilli | |
| Eggplant | ||
| Tomato | ||
| Other Solanaceae | ||
| Unclassified Vegetables | Asparagus | |
| Spinach | ||
| Other Unclassified Vegetables | ||
| Breeding Technology | Hybrids | Non-Transgenic Hybrids | |
| Transgenic Hybrids | Herbicide Tolerant Hybrids | ||
| Insect Resistant Hybrids | |||
| Open Pollinated Varieties and Hybrid Derivatives | |||
| Cultivation Mechanism | Open Field | ||
| Protected Cultivation | |||
| Crop Type | Row Crops | Fiber Crops | Cotton |
| Other Fiber Crops | |||
| Forage Crops | Alfalfa | ||
| Forage Corn | |||
| Other Forage Crops | |||
| Grains and Cereals | Corn | ||
| Rice | |||
| Other Grains and Cereals | |||
| Oilseeds | Canola, Rapeseed and Mustard | ||
| Soybean | |||
| Other Oilseeds | |||
| Pulses | |||
| Vegetables | Brassicas | Cabbage | |
| Carrot | |||
| Cauliflower and Broccoli | |||
| Other Brassicas | |||
| Cucurbits | Cucumber and Gherkin | ||
| Pumpkin and Squash | |||
| Other Cucurbits | |||
| Roots and Bulbs | Garlic | ||
| Onion | |||
| Potato | |||
| Other Roots and Bulbs | |||
| Solanaceae | Chilli | ||
| Eggplant | |||
| Tomato | |||
| Other Solanaceae | |||
| Unclassified Vegetables | Asparagus | ||
| Spinach | |||
| Other Unclassified Vegetables | |||


Market Definition
- Commercial Seed - For the purpose of this study, only commercial seeds have been included as part of the scope. Farm-saved Seeds, which are not commercially labeled are excluded from scope, even though a minor percentage of farm-saved seeds are exchanged commercially among farmers. The scope also excludes vegetatively reproduced crops and plant parts, which may be commercially sold in the market.
- Crop Acreage - While calculating the acreage under different crops, the Gross Cropped Area has been considered. Also known as Area Harvested, according to the Food & Agricultural Organization (FAO), this includes the total area cultivated under a particular crop across seasons.
- Seed Replacement Rate - Seed Replacement Rate is the percentage of area sown out of the total area of crop planted in the season by using certified/quality seeds other than the farm-saved seed.
- Protected Cultivation - The report defines protected cultivation as the process of growing crops in a controlled environment. This includes greenhouses, glasshouses, hydroponics, aeroponics, or any other cultivation system that protects the crop against any abiotic stress. However, cultivation in an open field using plastic mulch is excluded from this definition and is included under open field.
| Keyword | Definition |
|---|---|
| Row Crops | These are usually the field crops which include the different crop categories like grains & cereals, oilseeds, fiber crops like cotton, pulses, and forage crops. |
| Solanaceae | These are the family of flowering plants which includes tomato, chili, eggplants, and other crops. |
| Cucurbits | It represents a gourd family consisting of about 965 species in around 95 genera. The major crops considered for this study include Cucumber & Gherkin, Pumpkin and squash, and other crops. |
| Brassicas | It is a genus of plants in the cabbage and mustard family. It includes crops such as carrots, cabbage, cauliflower & broccoli. |
| Roots & Bulbs | The roots and bulbs segment includes onion, garlic, potato, and other crops. |
| Unclassified Vegetables | This segment in the report includes the crops which don’t belong to any of the above-mentioned categories. These include crops such as okra, asparagus, lettuce, peas, spinach, and others. |
| Hybrid Seed | It is the first generation of the seed produced by controlling cross-pollination and by combining two or more varieties, or species. |
| Transgenic Seed | It is a seed that is genetically modified to contain certain desirable input and/or output traits. |
| Non-Transgenic Seed | The seed produced through cross-pollination without any genetic modification. |
| Open-Pollinated Varieties & Hybrid Derivatives | Open-pollinated varieties produce seeds true to type as they cross-pollinate only with other plants of the same variety. |
| Other Solanaceae | The crops considered under other Solanaceae include bell peppers and other different peppers based on the locality of the respective countries. |
| Other Brassicaceae | The crops considered under other brassicas include radishes, turnips, Brussels sprouts, and kale. |
| Other Roots & Bulbs | The crops considered under other roots & bulbs include Sweet Potatoes and cassava. |
| Other Cucurbits | The crops considered under other cucurbits include gourds (bottle gourd, bitter gourd, ridge gourd, Snake gourd, and others). |
| Other Grains & Cereals | The crops considered under other grains & cereals include Barley, Buck Wheat, Canary Seed, Triticale, Oats, Millets, and Rye. |
| Other Fibre Crops | The crops considered under other fibers include Hemp, Jute, Agave fibers, Flax, Kenaf, Ramie, Abaca, Sisal, and Kapok. |
| Other Oilseeds | The crops considered under other oilseeds include Ground nut, Hempseed, Mustard seed, Castor seeds, safflower seeds, Sesame seeds, and Linseeds. |
| Other Forage Crops | The crops considered under other forages include Napier grass, Oat grass, White clover, Ryegrass, and Timothy. Other forage crops were considered based on the locality of the respective countries. |
| Pulses | Pigeon peas, Lentils, Broad and horse beans, Vetches, Chickpeas, Cowpeas, Lupins, and Bambara beans are the crops considered under pulses. |
| Other Unclassified Vegetables | The crops considered under other unclassified vegetables include Artichokes, Cassava Leaves, Leeks, Chicory, and String beans. |


Research Methodology
Mordor Intelligence follows a four-step methodology in all our reports.
- Step-1: IDENTIFY KEY VARIABLES: In order to build a robust forecasting methodology, the variables and factors identified in Step-1 are tested against available historical market numbers. Through an iterative process, the variables required for market forecast are set and the model is built on the basis of these variables.
- Step-2: Build a Market Model: Market-size estimations for the forecast years are in nominal terms. Inflation is not a part of the pricing, and the average selling price (ASP) is kept constant throughout the forecast period.
- Step-3: Validate and Finalize: In this important step, all market numbers, variables and analyst calls are validated through an extensive network of primary research experts from the market studied. The respondents are selected across levels and functions to generate a holistic picture of the market studied.
- Step-4: Research Outputs: Syndicated Reports, Custom Consulting Assignments, Databases, and Subscription Platforms


