Market Overview
| Study Period | 2018 - 2031 |
|---|---|
| Forecast Data Period | 2026 - 2031 |
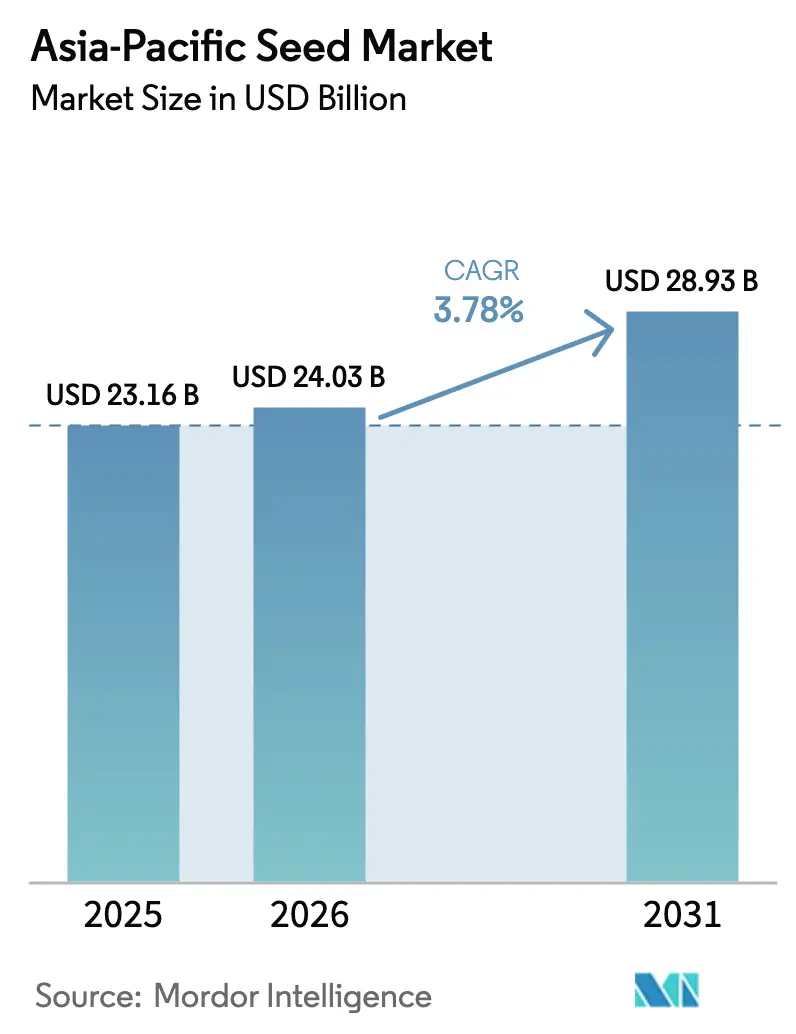
| Base Year Market Size (2025) | USD 23.16 Billion |
| Market Size (2026) | USD 24.03 Billion |
| Market Size (2031) | USD 28.93 Billion |
| Growth Rate (2026 - 2031) | 3.78% CAGR |
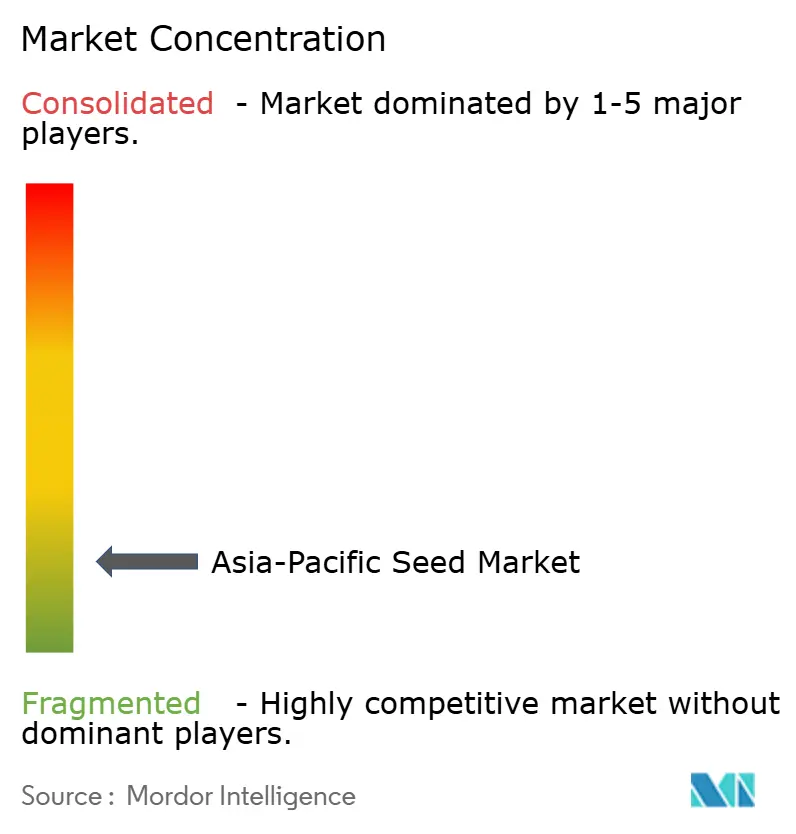
| Market Concentration | Low |
Major Players *Disclaimer: Major Players sorted in no particular order Image © Mordor Intelligence. Reuse requires attribution under CC BY 4.0. | |
Asia-Pacific Seed Market Analysis by Mordor Intelligence
The Asia-Pacific seed market size was valued at USD 23.16 billion in 2025 and estimated to grow from USD 24.03 billion in 2026 to reach USD 28.93 billion by 2031, at a CAGR of 3.78% during the forecast period (2026-2031). This growth reflects a shift from volume expansion to value creation, as government programs, precision agriculture investments, and biotechnology adoption reshape seed demand across the region.[1]Source: Ministry of Agriculture and Rural Affairs China, “Agricultural Development Policies,” MOA.GOV.CN Farmers are gravitating toward hybrid and gene-edited lines that deliver higher yields, climate resilience, and input-use efficiency. Intensifying food security targets in China, India, and Southeast Asia sustains demand for premium traits, while venture funding and public-private partnerships accelerate research and development (R&D) pipelines. The Asia-Pacific seed market is highly fragmented, with the top five companies holding a relatively small combined share, leaving significant room for regional specialists.
Key Report Takeaways
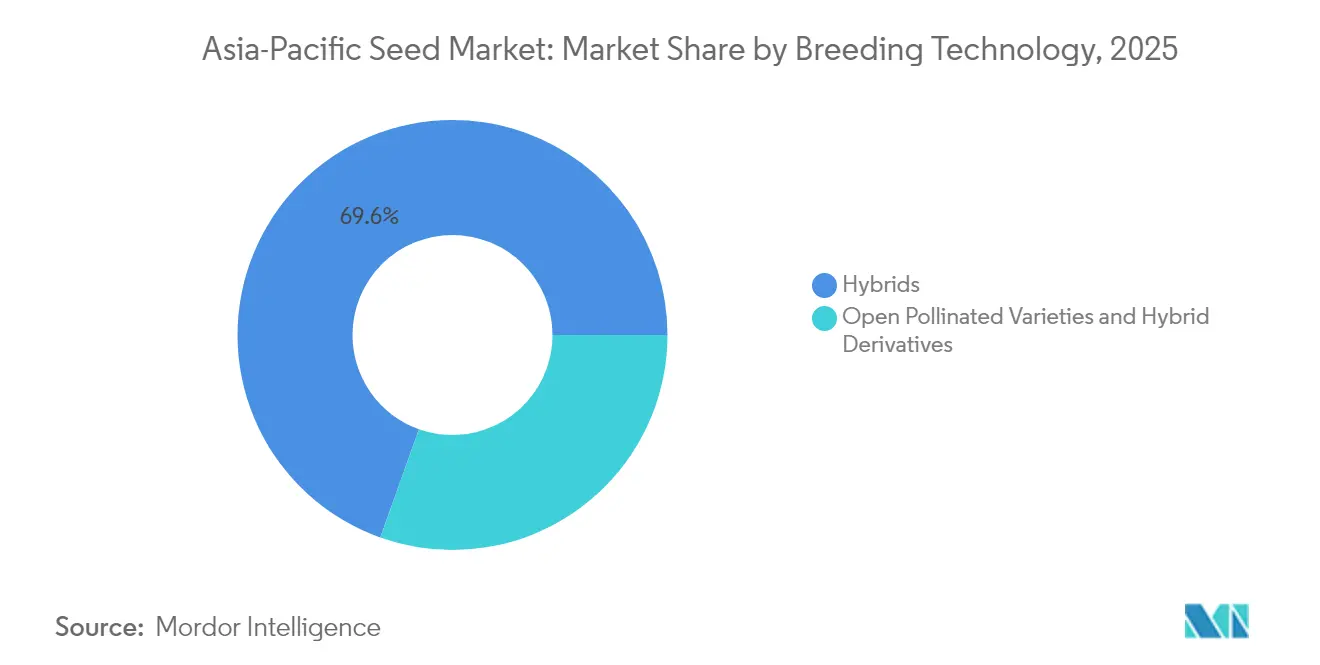
- By breeding technology, hybrids captured 69.55% of Asia-Pacific seed market size in 2025, and open-pollinated varieties and hybrid derivatives are advancing at a 3.98% CAGR to 2031.
- By cultivation mechanism, open-field systems commanded only 98.95% of the Asia-Pacific seed market size in 2025, and protected cultivation is registering the fastest 6.78% CAGR through 2031.
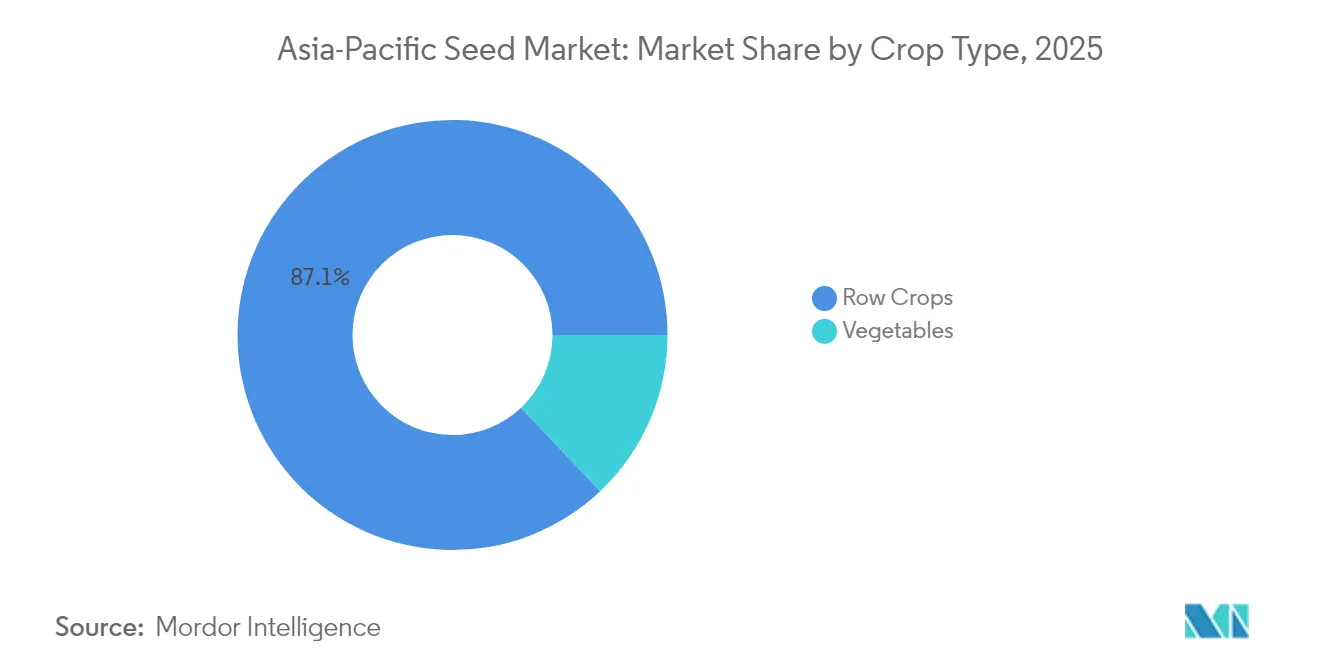
- By crop type, row crops accounted for 87.05% of the Asia-Pacific seed market size in 2025, while the vegetables segment is expanding at a 4.66% CAGR.
- By geography, China led with a 52.95% Asia-Pacific seed market share in 2025, but Australia is projected to record the highest 5.53% CAGR to 2031.
Note: Market size and forecast figures in this report are generated using Mordor Intelligence’s proprietary estimation framework, updated with the latest available data and insights as of 2026.
Asia-Pacific Seed Market Trends and Insights
Drivers Impact Analysis*
| Driver | (~) % Impact on CAGR Forecast | Geographic Relevance | Impact Timeline |
|---|---|---|---|
| Rising adoption of protected cultivation | +0.6% | China, Japan, Australia, and Southeast Asia | Medium term (2–4 years) |
| Government hybrid-seed subsidy programs | +0.5% | India, China, Bangladesh, and Vietnam | Short term (≤ 2 years) |
| Expansion of seed treatment and coating technologies | +0.4% | Australia, Japan, and South Korea | Medium term (2–4 years) |
| Climate-resilient varietal R&D pipelines | +0.3% | Core Asia-Pacific markets | Long term (≥ 4 years) |
| Gene-editing (CRISPR) deregulation momentum | +0.3% | India, Australia, Japan, and Southeast Asia | Long term (≥ 4 years) |
| Digital seed marketplaces and traceability platforms | +0.2% | Urban-adjacent farming regions across Asia-Pacific | Medium term (2–4 years) |
| Source: Mordor Intelligence | |||
Rising Adoption of Protected Cultivation
Protected cultivation is expanding quickly as climate volatility pushes growers toward controlled-environment systems. China recorded around 4.2 million hectares under greenhouses in 2024, marking 15% annual growth. Japan subsidizes 50% of smart-greenhouse installation costs, enabling yield gains of 30-40%. Southeast Asian governments designate greenhouse zones near major cities, drawing investment from Japanese and Dutch technology firms. These initiatives spur demand for seed lines engineered for high humidity, diffused light, and rapid crop cycles, lifting seed margins across the Asia-Pacific seed market.
Government Hybrid-Seed Subsidy Programs
National subsidy programs are lowering farmers’ upfront costs and accelerating hybrid adoption. India covers 75% of certified hybrid seed prices through the Pradhan Mantri Fasal Bima Yojana, boosting hybrid usage by 23% in 2024.[2]Source: Ministry of Agriculture and Farmers Welfare India, “Crop Insurance and Seed Subsidy Programs,” AGRICOOP.NIC.IN China’s National Modern Seed Industry Development Plan earmarks RMB 50 billion (USD 7.0 billion) for hybrid R&D and farmer incentives through 2030. Bangladesh’s Hybrid Rice Expansion Program provides free seeds to 2.5 million growers, delivering 18% higher yields. Vietnam subsidizes 60% of hybrid corn costs while extending technical support. These measures create stable demand in the Asia-Pacific seed market and cushion price sensitivity.
Expansion of Seed Treatment and Coating Technologies
Biological and polymer seed treatments are unlocking premium price points. Microbial coatings grew 25% in Asia-Pacific during 2024.[3]Source: International Seed Federation, “Global Seed Treatment Market Analysis,” WORLDSEED.ORG Japanese suppliers pioneered nano-encapsulation that delivers nutrients through crop growth. Australia’s Commonwealth Scientific and Industrial Research Organisation patented polymer films that lift germination by up to 20% under drought stress. Regulatory agencies classify most biological coatings as low risk, enabling rapid approvals. As a result, treated seeds command price premiums of 20-30% and offer clear yield advantages, fortifying revenue streams in the Asia-Pacific seed market.
Climate-Resilient Varietal R&D Pipelines
Extreme weather is steering R&D toward resilience traits. The International Rice Research Institute and national partners released 47 flood-tolerant and salt-resistant rice lines in 2024. China lifted university research budgets 35% for drought-tolerant wheat and corn. Australia’s Grains Research and Development Corporation invests each year to create heat-tolerant cereals. Intellectual-property portfolios built on these efforts carry significant royalty potential and position suppliers for long-term gains in the Asia-Pacific seed market.
Restraints Impact Analysis*
| Restraint | (~) % Impact on CAGR Forecast | Geographic Relevance | Impact Timeline |
|---|---|---|---|
| Counterfeit seed trade across regional borders | −0.3% | India, Bangladesh, Myanmar, China–Southeast Asia corridors | Short term (≤ 2 years) |
| Regulatory delays for trait approvals | −0.2% | ASEAN (Association of Southeast Asian Nations) markets | Medium term (2–4 years) |
| Smallholder affordability gap for biotech traits | −0.2% | Rural India, Bangladesh, Myanmar, Indonesia | Long term (≥ 4 years) |
| Biodiversity-driven NGO opposition to GM crops | −0.2% | Philippines, Thailand, Indonesia | Medium term (2–4 years) |
| Source: Mordor Intelligence | |||
Counterfeit Seed Trade Across Regional Borders
Illicit seed flows erode trust and profitability. Indian authorities seized 2,400 metric tons of fake hybrid rice worth USD 12 million in 2024. Limited coordination among border agencies lets counterfeit products slip into Myanmar and Bangladesh, triggering crop failures and dampening hybrid uptake. China is piloting blockchain tags on seed bags entering from Southeast Asia to verify authenticity. Without stronger enforcement, the underground market will keep weighing on legitimate growth in the Asia-Pacific seed market.
Biodiversity-driven NGO opposition to GM crops
Environmental nongovernmental organizations (NGOs) continue to lobby against genetically modified introductions. Legal challenges and public campaigns in the Philippines, Thailand, and Indonesia compel regulators to apply extra caution, delaying field trials or market launches. The uncertainty builds compliance risk and can deter private investment in these markets.
*Our forecasts treat driver/restraint impacts as directional, not additive. The impact forecasts reflect baseline growth, mix effects, and variable interactions.
Segment Analysis
By Breeding Technology: Hybrids Drive Premium Uptake
Hybrid seeds held 69.55% of Asia-Pacific seed market share in 2025. Non-transgenic hybrids remain the volume engine because they meet yield goals while sidestepping biotech regulations. In China and India, heterosis advantages deliver 15-25% yield lifts at affordable price points. Transgenic hybrids are gaining traction in herbicide-tolerant corn and insect-resistant cotton, especially where regulatory pathways are clearer. Meanwhile, open-pollinated varieties and hybrid derivatives are posting a 3.98% CAGR as cost-sensitive growers aim to save seed and reduce annual purchases. Suppliers balance premium hybrids with lower-priced lines, ensuring broad coverage across farm sizes and income groups. Marker-assisted selection and genomic tools shorten breeding cycles, letting companies stack traits faster and sustain differentiation in the Asia-Pacific seed market.
Open-pollinated solutions are furthering rural development goals, particularly in China’s grain self-sufficiency plan. State enterprises channel grant funding to enhance stress tolerance and nutrient-use efficiency in public-domain germplasm. Private firms, by contrast, focus on stacking herbicide, insect, and drought traits in proprietary hybrids, seizing higher margins. The coexistence of both strategies underscores the diversity of the Asia-Pacific seed market.


By Cultivation Mechanism: Protected Systems Transform Economics
By cultivation mechanism, open-field systems accounted for only 98.95% of the Asia-Pacific seed market size in 2025, while protected cultivation is anticipated to register the fastest growth rate of 6.78% through 2031. Japan covers 52,000 hectares with greenhouses backed by subsidies and smart controls. China’s greenhouse gas footprint is growing at a rate of 18% per year to meet urban demand. Seeds tailored for high humidity, limited light, or vertical racks command premiums, boosting supplier profitability. Breeding priorities include compact architecture, rapid maturity, and disease resistance suitable for closed environments.
Open-field systems still dominate because they service extensive acreage of grain and oilseed crops. Even here, modernization is visible through satellite-guided planters in Australia and drone spraying in India. As government programs promote climate-smart agriculture, demand for open-field seeds is shifting toward drought-tolerant and nutrient-efficient varieties, ensuring the Asia-Pacific seed market remains responsive to climate realities.
By Crop Type: Row Crops Anchor Value but Vegetables Accelerate
Row crops represented 87.05% of Asia-Pacific seed market share in 2025, reflecting the region’s staple-grain focus. Rice, wheat, corn, and soybeans are essential to food security agendas. China’s national targets, India’s rice self-sufficiency, and Indonesia’s corn programs all funnel public funding into high-yielding row-crop varieties. Trait priorities revolve around yield stability, pest resistance, and mechanization compatibility.
Conversely, vegetables are rising fastest at a 4.66% CAGR as consumers pursue fresh, nutrient-rich diets and urban middle-class spending grows. Protected cultivation accentuates this trend by enabling year-round harvests. Southeast Asian exporters seek disease-resistant tomato, pepper, and leafy lines with extended shelf life to meet destination-market standards. Vegetable breeding emphasizes flavor, color, and antioxidant content, widening the product gap between commodity cereals and high-value produce. Suppliers able to balance bulk row-crop volume with niche vegetable genetics will capture disproportionate returns in the Asia-Pacific seed market.
Geography Analysis
China controlled 52.95% of Asia-Pacific seed market share in 2025 through state-directed consolidation. China’s policy integration gives domestic suppliers scale and regulatory advantages. The government accelerated trait approvals for locally developed lines in 2025, ensuring quicker time-to-market. Provincial subsidies for climate-smart varieties further lift adoption. Counterfeit control is improving via QR-based traceability, helping to restore farmer confidence. India’s market is shaped by its smallholder majority.
The Seed Replacement Rate still lags global peers, signaling latent demand. Liberalizing gene-editing rules and expanding hybrid subsidies in rice and wheat are unlocking buyer willingness. Local champions, such as Kaveri Seeds and Nuziveedu, use deep distributor networks to penetrate remote areas. Australia is the fastest-growing geography at a 5.53% CAGR. Australia’s export-driven mindset necessitates superior genetics. Public research institutions partner with Corteva and Bayer on drought resilience and grain quality. Strong intellectual-property regimes allow breeders to capture royalties, reinforcing premium positioning in the Asia-Pacific seed market.
Southeast Asian countries are in a rapid modernization phase. Thailand and Vietnam channel foreign direct investment into protected cultivation and seed processing. Indonesia is opening its trait-approval pathway to accelerate corn and soybean yield lifts. Collectively, these markets provide incremental demand and diversification.
Competitive Landscape
The Asia-Pacific seed market is highly fragmented, with the top five companies holding a relatively small combined share, leaving significant room for regional specialists. Global majors, Bayer AG, Corteva Agriscience, Syngenta Group, Advanta Seeds (UPL Ltd.), and Yuan Longping High-Tech Agriculture Co. Ltd, deploy biotechnology portfolios, digital agronomy tools, and outcome-based offerings to defend and extend positions.
Regional leaders such as East-West Seed dominate vegetable niches through farmer training and strong retail presence. Strategic shifts favor platform competition. Companies integrate seed genetics with crop-monitoring apps, satellite imagery, and yield-based insurance. Corteva’s 2024 acquisition of Pacific Seeds extended its drought-tolerant wheat lines.
Bayer’s research investment in China and India accelerates local trait adaptation. East-West Seed expanded capacity in Vietnam to meet vegetable demand in fast-urbanizing zones. The white space lies in climate resilience, biological seed treatments, and digital marketplaces that curb counterfeit trade, all vital to the Asia-Pacific seed market outlook.
Asia-Pacific Seed Industry Leaders
Bayer AG
Corteva Agriscience
Syngenta Group
Yuan Longping High-Tech Agriculture Co. Ltd
Advanta Seeds (UPL Ltd.)
- *Disclaimer: Major Players sorted in no particular order

Recent Industry Developments
- November 2025: The Asian Seed Congress 2025 was inaugurated in Mumbai by Shivraj Singh Chouhan, bringing together global and regional stakeholders from the seed industry. Organized by the Asia and Pacific Seed Association (APSA), the event serves as a major platform for collaboration, trade, and innovation in the Asia-Pacific seed market.
- July 2025: UPL Ltd., through its subsidiary Advanta Seeds International Mauritius, has acquired full ownership of Wuhan Advanta Seeds Company Limited (Advanta China). This strategic move, marks UPL’s entry into the Chinese agri-inputs and seed market, reinforcing its presence in Asia and signaling long-term growth ambitions
- March 2024: Syngenta Vegetable Seeds opened a state-of-the-art Seed Health Lab in Nuthankal, near Hyderabad, India. This is India’s first dedicated seed health lab, designed to provide internationally accredited testing and strengthen Syngenta’s global quality control network, supporting both domestic growers and export ambitions.


Asia-Pacific Seed Market Report Scope
Hybrids, Open Pollinated Varieties & Hybrid Derivatives are covered as segments by Breeding Technology. Open Field, Protected Cultivation are covered as segments by Cultivation Mechanism. Row Crops, Vegetables are covered as segments by Crop Type. Australia, Bangladesh, China, India, Indonesia, Japan, Myanmar, Pakistan, Philippines, Thailand, Vietnam are covered as segments by Country.Breeding Technology
| Hybrids | Non-Transgenic Hybrids | |
| Transgenic Hybrids | Herbicide Tolerant Hybrids | |
| Insect Resistant Hybrids | ||
| Other Traits | ||
| Open Pollinated Varieties and Hybrid Derivatives | ||
Cultivation Mechanism
| Open Field |
| Protected Cultivation |
Crop Type
| Row Crops | Fiber Crops | Cotton |
| Other Fiber Crops | ||
| Forage Crops | Alfalfa | |
| Forage Corn | ||
| Forage Sorghum | ||
| Other Forage Crops | ||
| Grains and Cereals | Corn | |
| Rice | ||
| Sorghum | ||
| Wheat | ||
| Other Grains and Cereals | ||
| Oilseeds | Canola, Rapeseed and Mustard | |
| Soybean | ||
| Sunflower | ||
| Other Oilseeds | ||
| Pulses | Pulses | |
| Vegetables | Brassicas | Cabbage |
| Cauliflower and Broccoli | ||
| Other Brassicas | ||
| Cucurbits | Cucumber and Gherkin | |
| Pumpkin and Squash | ||
| Other Cucurbits | ||
| Roots and Bulbs | Garlic | |
| Onion | ||
| Potato | ||
| Other Roots and Bulbs | ||
| Solanaceae | Chilli | |
| Eggplant | ||
| Tomato | ||
| Other Solanaceae | ||
| Unclassified Vegetables | Asparagus | |
| Lettuce | ||
| Okra | ||
| Peas | ||
| Spinach | ||
| Other Unclassified Vegetables | ||
Geography
| Australia |
| Bangladesh |
| China |
| India |
| Indonesia |
| Japan |
| Myanmar |
| Pakistan |
| Philippines |
| Thailand |
| Vietnam |
| Rest of Asia-Pacific |
| Breeding Technology | Hybrids | Non-Transgenic Hybrids | |
| Transgenic Hybrids | Herbicide Tolerant Hybrids | ||
| Insect Resistant Hybrids | |||
| Other Traits | |||
| Open Pollinated Varieties and Hybrid Derivatives | |||
| Cultivation Mechanism | Open Field | ||
| Protected Cultivation | |||
| Crop Type | Row Crops | Fiber Crops | Cotton |
| Other Fiber Crops | |||
| Forage Crops | Alfalfa | ||
| Forage Corn | |||
| Forage Sorghum | |||
| Other Forage Crops | |||
| Grains and Cereals | Corn | ||
| Rice | |||
| Sorghum | |||
| Wheat | |||
| Other Grains and Cereals | |||
| Oilseeds | Canola, Rapeseed and Mustard | ||
| Soybean | |||
| Sunflower | |||
| Other Oilseeds | |||
| Pulses | Pulses | ||
| Vegetables | Brassicas | Cabbage | |
| Cauliflower and Broccoli | |||
| Other Brassicas | |||
| Cucurbits | Cucumber and Gherkin | ||
| Pumpkin and Squash | |||
| Other Cucurbits | |||
| Roots and Bulbs | Garlic | ||
| Onion | |||
| Potato | |||
| Other Roots and Bulbs | |||
| Solanaceae | Chilli | ||
| Eggplant | |||
| Tomato | |||
| Other Solanaceae | |||
| Unclassified Vegetables | Asparagus | ||
| Lettuce | |||
| Okra | |||
| Peas | |||
| Spinach | |||
| Other Unclassified Vegetables | |||
| Geography | Australia | ||
| Bangladesh | |||
| China | |||
| India | |||
| Indonesia | |||
| Japan | |||
| Myanmar | |||
| Pakistan | |||
| Philippines | |||
| Thailand | |||
| Vietnam | |||
| Rest of Asia-Pacific | |||


Market Definition
- Commercial Seed - For the purpose of this study, only commercial seeds have been included as part of the scope. Farm-saved Seeds, which are not commercially labeled are excluded from scope, even though a minor percentage of farm-saved seeds are exchanged commercially among farmers. The scope also excludes vegetatively reproduced crops and plant parts, which may be commercially sold in the market.
- Crop Acreage - While calculating the acreage under different crops, the Gross Cropped Area has been considered. Also known as Area Harvested, according to the Food & Agricultural Organization (FAO), this includes the total area cultivated under a particular crop across seasons.
- Seed Replacement Rate - Seed Replacement Rate is the percentage of area sown out of the total area of crop planted in the season by using certified/quality seeds other than the farm-saved seed.
- Protected Cultivation - The report defines protected cultivation as the process of growing crops in a controlled environment. This includes greenhouses, glasshouses, hydroponics, aeroponics, or any other cultivation system that protects the crop against any abiotic stress. However, cultivation in an open field using plastic mulch is excluded from this definition and is included under open field.
| Keyword | Definition |
|---|---|
| Row Crops | These are usually the field crops which include the different crop categories like grains & cereals, oilseeds, fiber crops like cotton, pulses, and forage crops. |
| Solanaceae | These are the family of flowering plants which includes tomato, chili, eggplants, and other crops. |
| Cucurbits | It represents a gourd family consisting of about 965 species in around 95 genera. The major crops considered for this study include Cucumber & Gherkin, Pumpkin and squash, and other crops. |
| Brassicas | It is a genus of plants in the cabbage and mustard family. It includes crops such as carrots, cabbage, cauliflower & broccoli. |
| Roots & Bulbs | The roots and bulbs segment includes onion, garlic, potato, and other crops. |
| Unclassified Vegetables | This segment in the report includes the crops which don’t belong to any of the above-mentioned categories. These include crops such as okra, asparagus, lettuce, peas, spinach, and others. |
| Hybrid Seed | It is the first generation of the seed produced by controlling cross-pollination and by combining two or more varieties, or species. |
| Transgenic Seed | It is a seed that is genetically modified to contain certain desirable input and/or output traits. |
| Non-Transgenic Seed | The seed produced through cross-pollination without any genetic modification. |
| Open-Pollinated Varieties & Hybrid Derivatives | Open-pollinated varieties produce seeds true to type as they cross-pollinate only with other plants of the same variety. |
| Other Solanaceae | The crops considered under other Solanaceae include bell peppers and other different peppers based on the locality of the respective countries. |
| Other Brassicaceae | The crops considered under other brassicas include radishes, turnips, Brussels sprouts, and kale. |
| Other Roots & Bulbs | The crops considered under other roots & bulbs include Sweet Potatoes and cassava. |
| Other Cucurbits | The crops considered under other cucurbits include gourds (bottle gourd, bitter gourd, ridge gourd, Snake gourd, and others). |
| Other Grains & Cereals | The crops considered under other grains & cereals include Barley, Buck Wheat, Canary Seed, Triticale, Oats, Millets, and Rye. |
| Other Fibre Crops | The crops considered under other fibers include Hemp, Jute, Agave fibers, Flax, Kenaf, Ramie, Abaca, Sisal, and Kapok. |
| Other Oilseeds | The crops considered under other oilseeds include Ground nut, Hempseed, Mustard seed, Castor seeds, safflower seeds, Sesame seeds, and Linseeds. |
| Other Forage Crops | The crops considered under other forages include Napier grass, Oat grass, White clover, Ryegrass, and Timothy. Other forage crops were considered based on the locality of the respective countries. |
| Pulses | Pigeon peas, Lentils, Broad and horse beans, Vetches, Chickpeas, Cowpeas, Lupins, and Bambara beans are the crops considered under pulses. |
| Other Unclassified Vegetables | The crops considered under other unclassified vegetables include Artichokes, Cassava Leaves, Leeks, Chicory, and String beans. |


Research Methodology
Mordor Intelligence follows a four-step methodology in all our reports.
- Step-1: IDENTIFY KEY VARIABLES: In order to build a robust forecasting methodology, the variables and factors identified in Step-1 are tested against available historical market numbers. Through an iterative process, the variables required for market forecast are set and the model is built on the basis of these variables.
- Step-2: Build a Market Model: Market-size estimations for the forecast years are in nominal terms. Inflation is not a part of the pricing, and the average selling price (ASP) is kept constant throughout the forecast period.
- Step-3: Validate and Finalize: In this important step, all market numbers, variables and analyst calls are validated through an extensive network of primary research experts from the market studied. The respondents are selected across levels and functions to generate a holistic picture of the market studied.
- Step-4: Research Outputs: Syndicated Reports, Custom Consulting Assignments, Databases, and Subscription Platforms


