Market Overview
| Study Period | 2018 - 2031 |
|---|---|
| Forecast Data Period | 2026 - 2031 |
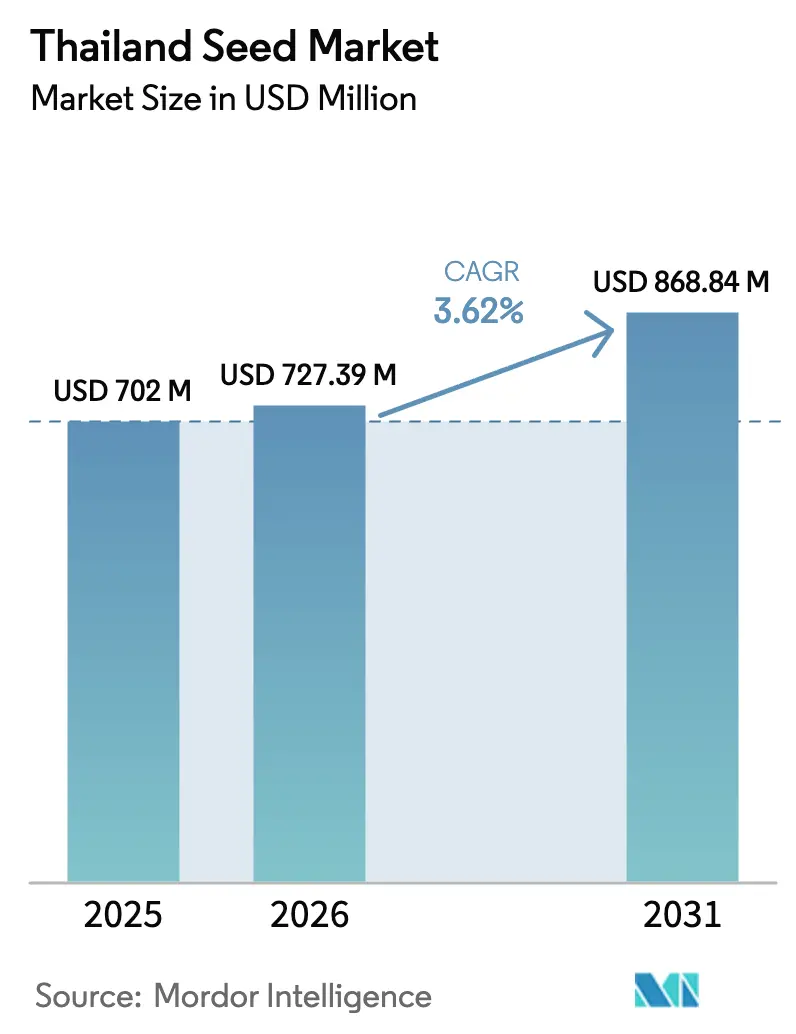
| Base Year Market Size (2025) | USD 702 Million |
| Market Size (2026) | USD 727.39 Million |
| Market Size (2031) | USD 868.84 Million |
| Growth Rate (2026 - 2031) | 3.62% CAGR |
| Market Concentration | Low |
Major Players *Disclaimer: Major Players sorted in no particular order Image © Mordor Intelligence. Reuse requires attribution under CC BY 4.0. | |
Thailand Seed Market Analysis by Mordor Intelligence
Thailand seed market size in 2026 is estimated at USD 727.39 million, growing from 2025 value of USD 702 million with 2031 projections showing USD 868.84 million, growing at 3.62% CAGR over 2026-2031. Ongoing government subsidies for hybrid rice, rapid greenhouse construction in the Eastern Economic Corridor (EEC), and rising demand for certified seed under Thai Good Agricultural Practice (Thai GAP) standards propel growth despite a maturing base. Currency volatility and water scarcity restrain planting intensity, yet protected cultivation, ag-ecommerce distribution, and offshore contract multiplication continue to open fresh revenue streams for both domestic and international suppliers. These forces illustrate how policy support and technological adoption jointly reshape production models, giving the Thailand seed market ample headroom for specialized hybrids, greenhouse-specific genetics, and export-oriented varieties.
Key Report Takeaways
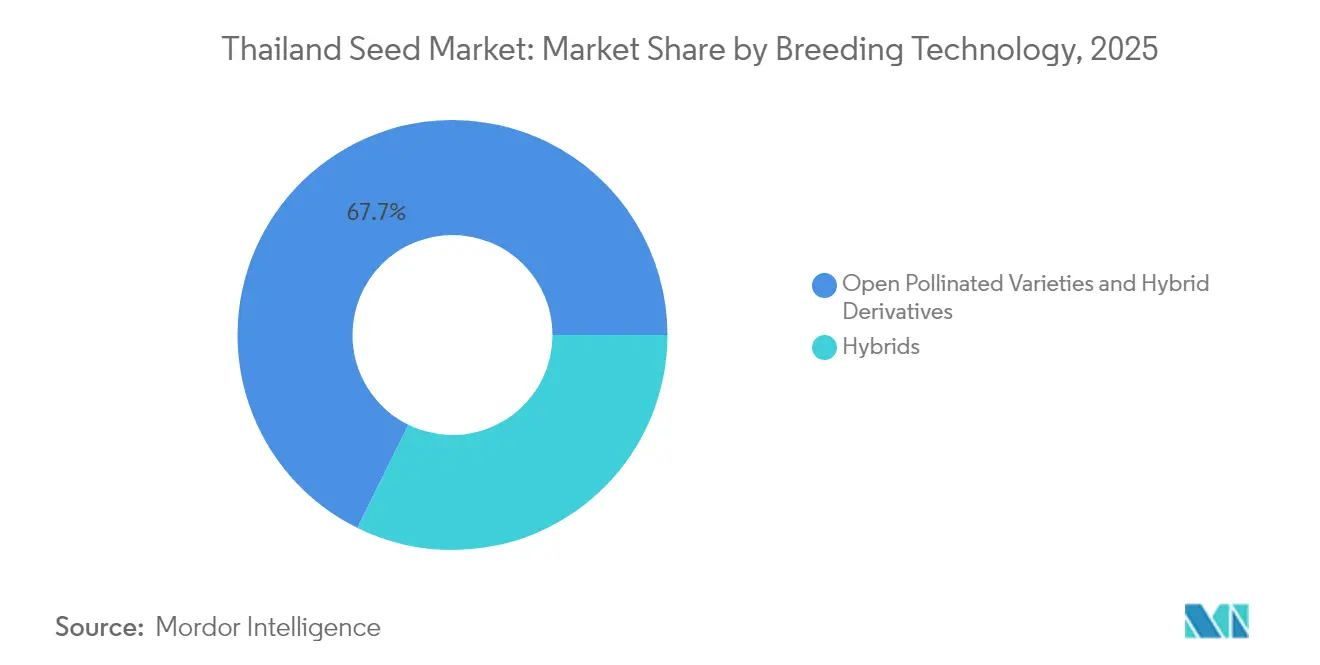
- By breeding technology, Open Pollinated Varieties and Hybrid Derivatives held 67.72% of Thailand's seed market share in 2025, while Hybrids are advancing at a 5.18% CAGR through 2031.
- By cultivation mechanism, Open Field accounted for 99.86% of the Thailand seed market size in 2025, and Protected Cultivation is expanding at a 6.55% CAGR through 2031.
- By crop type, Row Crops controlled 92.55% revenue share in 2025, while Vegetables exhibited the highest projected CAGR at 3.74% to 2031.
Note: Market size and forecast figures in this report are generated using Mordor Intelligence’s proprietary estimation framework, updated with the latest available data and insights as of 2026.
Thailand Seed Market Trends and Insights
Drivers Impact Analysis*
| Driver | (~) % Impact on CAGR Forecast | Geographic Relevance | Impact Timeline |
|---|---|---|---|
| Government subsidy continuance for hybrid rice seeds | +0.8% | Nationwide rice-growing belts | Medium term (2-4 years) |
| Rapid expansion of protected greenhouses in EEC (Eastern Economic Corridor) | +1.2% | Chonburi, Rayong, and Chachoengsao | Short term (≤ 2 years) |
| Seed replacement initiatives under Thai GAP standards | +0.6% | Commercial farming hubs | Long term (≥ 4 years) |
| Penetration of high-oleic sunflower hybrids for snack processing | +0.4% | Central and northern clusters | Medium term (2-4 years) |
| Offshore contract multiplication demand from Japan | +0.3% | Specialized production zones | Short term (≤ 2 years) |
| Ag-eCommerce platforms bundling micro-pack vegetable seeds | +0.5% | Urban and peri-urban areas | Short term (≤ 2 years) |
| Source: Mordor Intelligence | |||
Government subsidy continuance for hybrid rice seeds
The Ministry of Agriculture and Cooperatives extends hybrid rice seed incentives under its nine-point strategy aimed at tripling farmer income by 2027.[1]Source: PRD, “Hybrid Rice Incentive Program,” prd.go.th The subsidy lowers adoption risk for the country’s smallholders, ensuring stable yearly demand for certified hybrids. Seed firms benefit from a predictable offtake that justifies breeding investment, while ancillary services such as extension training improve hybrid performance in the field. The Thailand seed market thus secures a dependable revenue pillar anchored in national food-security priorities. Yet real impact hinges on parallel upgrades in irrigation and mechanization that unlock the yield ceiling of the new genetics.
Rapid expansion of protected greenhouses in the EEC
Industrial Estate Authority of Thailand approvals accelerate greenhouse construction near Laem Chabang port, clustering demand for climate-controlled vegetable seeds. Investors target year-round supply for export channels, pushing breeders to release cultivars tailored to high humidity and intensive fertigation. The localized boom magnifies economies of scale for distributors and encourages in-country multiplication of specialty varieties. In turn, the Thailand seed market gains a premium sub-segment characterized by higher margins and shorter product life cycles that reward rapid innovation.
Seed replacement initiatives under Thai GAP standards
The National Bureau of Agricultural Commodity and Food Standards enforces documented seed sourcing within Thai GAP audits, transforming seed purchases from discretionary to legally mandated for certified producers.[2]Source: ACFS, “Thai GAP Compliance Framework,” acfs.go.th The rule institutionalizes repeat buying cycles and strengthens the branding advantage of suppliers with verifiable quality protocols. Commercial farms exporting to Japan and the European Union now view certified seed lots as non-negotiable inputs, giving larger companies leverage over informal market participants. Smallholders face higher compliance costs, which may slow universal adoption but also stimulate micro-pack solutions via digital platforms.
Penetration of high-oleic sunflower hybrids for snack processing
Growth in packaged snacks raises demand for high-oleic oil with extended shelf life, spurring processors to contract with growers for premium sunflower hybrids.[3]Source: USDA Foreign Agricultural Service, “Oilseeds Annual 2024,” usda.gov Farmers secure price premiums that offset higher seed outlays, while breeders expand oilseed portfolios targeting oxidative stability traits. This alignment of upstream genetics and downstream processing standards infuses the Thailand seed market with a value-added niche less sensitive to bulk commodity price swings.
Restraints Impact Analysis*
| Restraint | (~) % Impact on CAGR Forecast | Geographic Relevance | Impact Timeline |
|---|---|---|---|
| Rising counterfeit vegetable seed circulation | -0.7% | Border provinces and informal markets | Short term (≤ 2 years) |
| Smallholder reluctance toward GM traits amid labeling debates | -0.4% | Traditional farming communities | Long term (≥ 4 years) |
| Volatile baht affecting imported parent lines | -0.6% | Nationwide importers | Short term (≤ 2 years) |
| Water-scarcity induced shift away from double-cropping | -0.9% | Northern and northeastern provinces | Medium term (2-4 years) |
| Source: Mordor Intelligence | |||
Rising counterfeit vegetable seed circulation
Royal Thai Customs recorded 1,100 intellectual-property filings by August 2024, yet informal channels still flood markets with spurious packets that erode farmer trust. Yield losses from mislabeled varieties reduce willingness to invest in premium genetics, especially for high-value greenhouse crops. Authentic producers incur extra hologram and blockchain traceability costs, squeezing margins. In response, large firms collaborate with enforcement agencies and deploy QR-based verification to protect brand equity across the Thailand seed market.
Smallholder reluctance toward GM traits amid labeling debates
Ongoing debates around GMO labeling, led by the Food and Drug Administration (FDA), sustain consumer skepticism. Producers fear buyer backlash and thus avoid GM seeds, limiting the commercial pathway for genetically engineered crops. While hybrids thrive under subsidy, transgenic innovations remain confined to research plots. Breeders divert R&D budgets toward non-transgenic traits such as drought tolerance, delaying broader technological leaps in the Thailand seed market.
*Our forecasts treat driver/restraint impacts as directional, not additive. The impact forecasts reflect baseline growth, mix effects, and variable interactions.
Segment Analysis
By Breeding Technology: Hybrids Drive Premium Adoption
Hybrids accelerated at a 5.18% CAGR through 2031, though open-pollinated and derivative lines still comprised 67.72% of Thailand's seed market share in 2025. The Thailand seed market size for hybrids is poised to expand as government subsidies lower smallholder entry barriers and as organized processors demand traceable, uniform outputs. Non-transgenic hybrids dominate due to biosafety concerns, yet their yield edge over traditional varieties remains compelling. Corn and sunflower lead in hybrid penetration, whereas rice adoption advances more slowly because cultural preferences favor glutinous local cultivars. Research alliances with public institutions shorten breeding cycles and enhance disease resistance portfolios.
Local champion Chia Tai markets 485 varieties across 42 species, underscoring portfolio breadth as a success factor in fragmented demand settings. Licensing deals with multinational gene-editing startups could further elevate trait diversity should regulatory frameworks evolve. Overall, breeder agility in balancing cost, performance, and regulatory compliance will dictate hybrid growth velocity within the Thailand seed market.


By Cultivation Mechanism: Protected Systems Transform Production
Open-field farming retained 99.86% of acreage in 2025, yet protected cultivation posted a 6.55% CAGR forecast, signaling a structural pivot toward greenhouse and net-house operations. The Thailand seed market size for greenhouse-specific genetics is small but rising, driven by investors seeking higher yields per square meter and stable year-round harvests. Climate-controlled units support premium vegetables such as cherry tomato, bell pepper, and lettuce, which command lucrative export and domestic retail prices. Seed companies respond with cultivars tolerant to reduced light and tailor root-architecture for hydroponic systems.
Government-backed platforms like AGROWTH channel grants to agritech startups that develop modular greenhouses and sensor-based fertigation solutions. These innovations shorten learning curves for new entrants and increase the addressable base for high-value seeds. Meanwhile, open-field farmers adopt drought-resilient varieties to mitigate weather volatility. Over time, adoption of protected cultivation is likely to accelerate most in peri-urban belts where land prices justify the capital investment.
By Crop Type: Vegetables Accelerate Despite Row-Crop Dominance
Row crops, notably rice, corn, and cassava, comprised 92.55% of 2025 revenue. Yet, vegetables are expanding at a 3.74% CAGR on the back of intensifying greenhouse deployment and rising household consumption of fresh produce. The Thailand seed market size for tomatoes, cucumbers, and leafy greens attracts multinational breeders eager to capture premium margins. Large processors sourcing for quick-freeze and snack segments contract acreage, enabling farmers to absorb costlier hybrid seeds.
Advanta and KPAGRO’s sweet corn seed drying facility in Lopburi underscores the country’s export-oriented specialization in niche crops that demand precise quality control. In parallel, highland provinces test temperate brassicas aimed at Asian megacity consumers. Within row crops, the Thailand seed market now prizes short-maturity rice lines aligned with single-season planting and drought-tolerant corn hybrids that offset water deficits. Oilseeds benefit from snack and feed processing, while pulses gain incremental acreage in crop rotation programs.

Geography Analysis
Central plains concentrate rice seed demand, leveraging extensive irrigation but confronting baht volatility on imported parent lines. Northern highlands specialize in temperate vegetables and contract sunflowers for high-oleic oil, while Northeastern provinces reduce double-cropping due to water stress, switching to cassava and pulses that require lower seed rates. Southern coastal areas explore tropical fruit seeds targeting export packhouses.
The Eastern Economic Corridor represents the fastest-growing region in the Thailand seed market due to integrated logistics, proximity to Laem Chabang deep-sea port, and generous investment incentives. Greenhouse clusters here demand specialized genetics and nurture a vibrant agritech startup scene funded through venture vehicles such as Betagro Ventures’ USD 30 million allocation. Northern border provinces see significant cross-border trade in small seed packets, which complicates enforcement of counterfeit crackdowns.
Contract multiplication for Japanese clients spans the central and Western valleys, where phytosanitary controls and isolation distances meet stringent import requirements. The Ministry of Agriculture deploys the Phaya Nakarat task force to limit illegal seed inflows, protecting local breeders from unfair competition. Such regional heterogeneity forces companies to tailor portfolio, pricing, and distribution mechanics to micro-market realities within the broader Thailand seed market.
Competitive Landscape
Top suppliers, Groupe Limagrain, Charoen Pokphand, and other top players held a minor share of combined revenue in 2024, making the Thailand Seed Market fragmented. Multinationals leverage proprietary traits and global research pipelines, yet local firms excel in region-specific adaptation and grassroots distribution. Bayer’s new inspection and quality control lab in Phitsanulok elevates germination and purity standards, reinforcing brand credibility among export-oriented growers.
Limagrain capitalizes on vegetable hybrid depth, while Syngenta advances biological pest control through a collaboration with Provivi that will bring pheromone solutions for fall armyworm by 2026. Charoen Pokphand integrates blockchain tracing in upstream Myanmar corn operations to secure provenance and may replicate similar technology in Thai seed channels. East-West Seed remains a benchmark for smallholder-focused extension programs and package sizes, giving it reach beyond large commercial farms.
Investment trends highlight the role of venture capital in filling innovation gaps. Betagro Ventures seeks to fund digital farm-data tools, microbiome inputs, and next-gen phenotyping to sustain pipeline freshness. Meanwhile, state-funded AGROWTH accelerators distribute grants and testing facilities to young companies, gradually raising the technological ceiling across the Thailand seed market. Competitive positioning thus relies on an agile blend of R&D heft, regulatory sophistication, and omni-channel distribution.
Thailand Seed Industry Leaders
Syngenta Group
Advanta Seeds (UPL Ltd.)
Groupe Limagrain
Known-You Seed Co. Ltd.
Charoen Pokphand Group
- *Disclaimer: Major Players sorted in no particular order


Recent Industry Developments
- February 2025: Thailand launched the Climate-Smart Rice Project to breed climate-resilient varieties suitable for single-season farming.
- February 2025: In Lopburi, Thailand, Advanta Seeds and KPAGRO unveiled a cutting-edge facility dedicated to drying sweet corn seeds. This advancement boosts processing efficiency and bolsters global supply capabilities. Marking a significant milestone, it underscores Thailand's emerging status as a pivotal hub for tropical corn seed production, a testament to the duo's 19-year strategic alliance.


Thailand Seed Market Report Scope
Hybrids, Open Pollinated Varieties & Hybrid Derivatives are covered as segments by Breeding Technology. Open Field, Protected Cultivation are covered as segments by Cultivation Mechanism. Row Crops, Vegetables are covered as segments by Crop Type.Breeding Technology
| Hybrids | Non-Transgenic Hybrids |
| Open Pollinated Varieties and Hybrid Derivatives |
Cultivation Mechanism
| Open Field |
| Protected Cultivation |
Crop Type
| Row Crops | Fiber Crops | Cotton |
| Other Fiber Crops | ||
| Forage Crops | Forage Corn | |
| Forage Sorghum | ||
| Other Forage Crops | ||
| Grains and Cereals | Corn | |
| Rice | ||
| Sorghum | ||
| Wheat | ||
| Other Grains and Cereals | ||
| Oilseeds | Soybean | |
| Sunflower | ||
| Other Oilseeds | ||
| Pulses | ||
| Vegetables | Brassicas | Cabbage |
| Cauliflower and Broccoli | ||
| Other Brassicas | ||
| Cucurbits | Cucumber and Gherkin | |
| Pumpkin and Squash | ||
| Other Cucurbits | ||
| Roots and Bulbs | Garlic | |
| Onion | ||
| Potato | ||
| Other Roots and Bulbs | ||
| Solanaceae | Chilli | |
| Eggplant | ||
| Tomato | ||
| Other Solanaceae | ||
| Unclassified Vegetables | Asparagus | |
| Lettuce | ||
| Peas | ||
| Other Unclassified Vegetables | ||
| Breeding Technology | Hybrids | Non-Transgenic Hybrids | |
| Open Pollinated Varieties and Hybrid Derivatives | |||
| Cultivation Mechanism | Open Field | ||
| Protected Cultivation | |||
| Crop Type | Row Crops | Fiber Crops | Cotton |
| Other Fiber Crops | |||
| Forage Crops | Forage Corn | ||
| Forage Sorghum | |||
| Other Forage Crops | |||
| Grains and Cereals | Corn | ||
| Rice | |||
| Sorghum | |||
| Wheat | |||
| Other Grains and Cereals | |||
| Oilseeds | Soybean | ||
| Sunflower | |||
| Other Oilseeds | |||
| Pulses | |||
| Vegetables | Brassicas | Cabbage | |
| Cauliflower and Broccoli | |||
| Other Brassicas | |||
| Cucurbits | Cucumber and Gherkin | ||
| Pumpkin and Squash | |||
| Other Cucurbits | |||
| Roots and Bulbs | Garlic | ||
| Onion | |||
| Potato | |||
| Other Roots and Bulbs | |||
| Solanaceae | Chilli | ||
| Eggplant | |||
| Tomato | |||
| Other Solanaceae | |||
| Unclassified Vegetables | Asparagus | ||
| Lettuce | |||
| Peas | |||
| Other Unclassified Vegetables | |||


Market Definition
- Commercial Seed - For the purpose of this study, only commercial seeds have been included as part of the scope. Farm-saved Seeds, which are not commercially labeled are excluded from scope, even though a minor percentage of farm-saved seeds are exchanged commercially among farmers. The scope also excludes vegetatively reproduced crops and plant parts, which may be commercially sold in the market.
- Crop Acreage - While calculating the acreage under different crops, the Gross Cropped Area has been considered. Also known as Area Harvested, according to the Food & Agricultural Organization (FAO), this includes the total area cultivated under a particular crop across seasons.
- Seed Replacement Rate - Seed Replacement Rate is the percentage of area sown out of the total area of crop planted in the season by using certified/quality seeds other than the farm-saved seed.
- Protected Cultivation - The report defines protected cultivation as the process of growing crops in a controlled environment. This includes greenhouses, glasshouses, hydroponics, aeroponics, or any other cultivation system that protects the crop against any abiotic stress. However, cultivation in an open field using plastic mulch is excluded from this definition and is included under open field.
| Keyword | Definition |
|---|---|
| Row Crops | These are usually the field crops which include the different crop categories like grains & cereals, oilseeds, fiber crops like cotton, pulses, and forage crops. |
| Solanaceae | These are the family of flowering plants which includes tomato, chili, eggplants, and other crops. |
| Cucurbits | It represents a gourd family consisting of about 965 species in around 95 genera. The major crops considered for this study include Cucumber & Gherkin, Pumpkin and squash, and other crops. |
| Brassicas | It is a genus of plants in the cabbage and mustard family. It includes crops such as carrots, cabbage, cauliflower & broccoli. |
| Roots & Bulbs | The roots and bulbs segment includes onion, garlic, potato, and other crops. |
| Unclassified Vegetables | This segment in the report includes the crops which don’t belong to any of the above-mentioned categories. These include crops such as okra, asparagus, lettuce, peas, spinach, and others. |
| Hybrid Seed | It is the first generation of the seed produced by controlling cross-pollination and by combining two or more varieties, or species. |
| Transgenic Seed | It is a seed that is genetically modified to contain certain desirable input and/or output traits. |
| Non-Transgenic Seed | The seed produced through cross-pollination without any genetic modification. |
| Open-Pollinated Varieties & Hybrid Derivatives | Open-pollinated varieties produce seeds true to type as they cross-pollinate only with other plants of the same variety. |
| Other Solanaceae | The crops considered under other Solanaceae include bell peppers and other different peppers based on the locality of the respective countries. |
| Other Brassicaceae | The crops considered under other brassicas include radishes, turnips, Brussels sprouts, and kale. |
| Other Roots & Bulbs | The crops considered under other roots & bulbs include Sweet Potatoes and cassava. |
| Other Cucurbits | The crops considered under other cucurbits include gourds (bottle gourd, bitter gourd, ridge gourd, Snake gourd, and others). |
| Other Grains & Cereals | The crops considered under other grains & cereals include Barley, Buck Wheat, Canary Seed, Triticale, Oats, Millets, and Rye. |
| Other Fibre Crops | The crops considered under other fibers include Hemp, Jute, Agave fibers, Flax, Kenaf, Ramie, Abaca, Sisal, and Kapok. |
| Other Oilseeds | The crops considered under other oilseeds include Ground nut, Hempseed, Mustard seed, Castor seeds, safflower seeds, Sesame seeds, and Linseeds. |
| Other Forage Crops | The crops considered under other forages include Napier grass, Oat grass, White clover, Ryegrass, and Timothy. Other forage crops were considered based on the locality of the respective countries. |
| Pulses | Pigeon peas, Lentils, Broad and horse beans, Vetches, Chickpeas, Cowpeas, Lupins, and Bambara beans are the crops considered under pulses. |
| Other Unclassified Vegetables | The crops considered under other unclassified vegetables include Artichokes, Cassava Leaves, Leeks, Chicory, and String beans. |


Research Methodology
Mordor Intelligence follows a four-step methodology in all our reports.
- Step-1: IDENTIFY KEY VARIABLES: In order to build a robust forecasting methodology, the variables and factors identified in Step-1 are tested against available historical market numbers. Through an iterative process, the variables required for market forecast are set and the model is built on the basis of these variables.
- Step-2: Build a Market Model: Market-size estimations for the forecast years are in nominal terms. Inflation is not a part of the pricing, and the average selling price (ASP) is kept constant throughout the forecast period.
- Step-3: Validate and Finalize: In this important step, all market numbers, variables and analyst calls are validated through an extensive network of primary research experts from the market studied. The respondents are selected across levels and functions to generate a holistic picture of the market studied.
- Step-4: Research Outputs: Syndicated Reports, Custom Consulting Assignments, Databases, and Subscription Platforms


