
Next-generation Sequencing (NGS) Market Size and Share
Market Overview
| Study Period | 2020 - 2031 |
|---|---|
| Market Size (2026) | USD 11.81 Billion |
| Market Size (2031) | USD 22.43 Billion |
| Growth Rate (2026 - 2031) | 13.69 % |
| Fastest Growing Market | Asia-Pacific |
| Largest Market | North America |
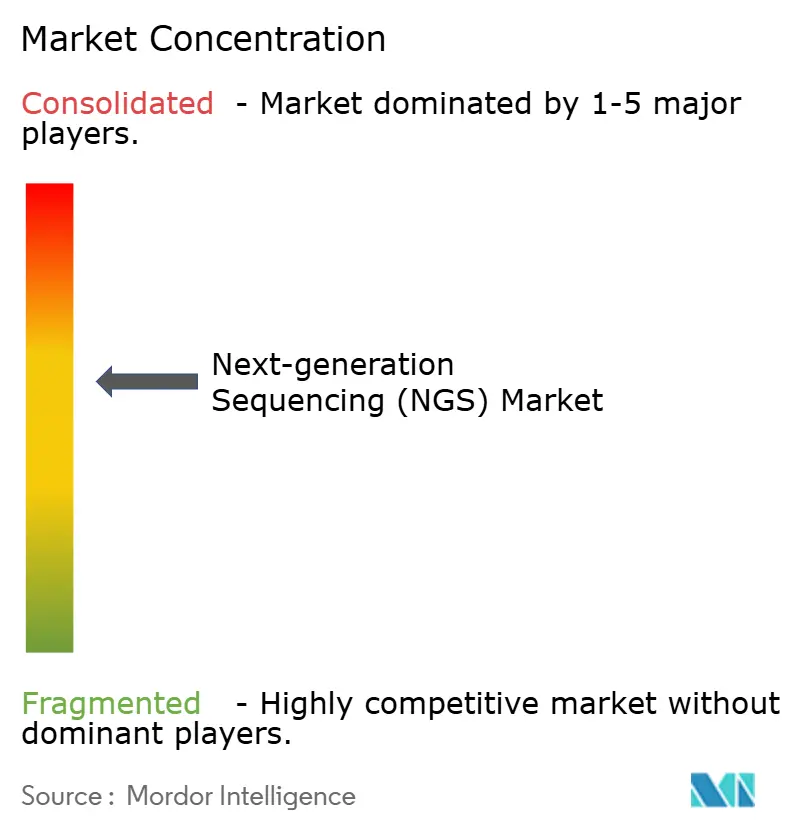
| Market Concentration | Medium |
Major Players *Disclaimer: Major Players sorted in no particular order Image © Mordor Intelligence. Reuse requires attribution under CC BY 4.0. | |
Next-generation Sequencing (NGS) Market Analysis by Mordor Intelligence
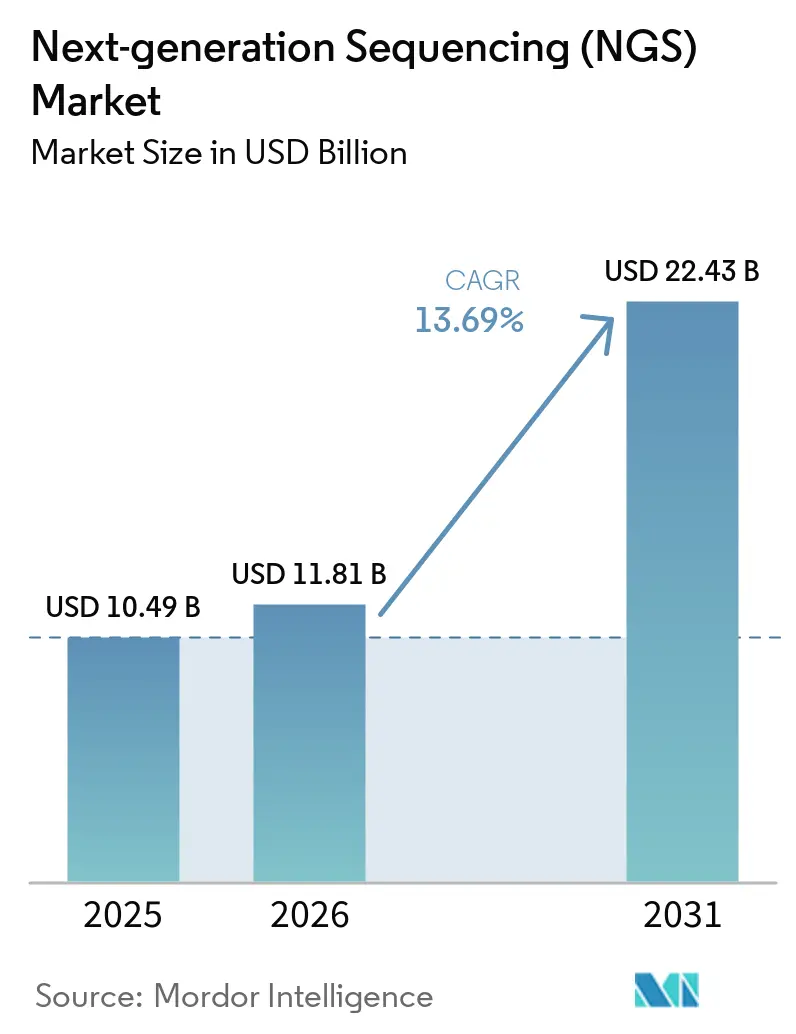
The Next-generation Sequencing Market size is projected to be USD 10.49 billion in 2025, USD 11.81 billion in 2026, and reach USD 22.43 billion by 2031, growing at a CAGR of 13.69% from 2026 to 2031.
Rising demand for sovereign genomic infrastructure, on-cartridge workflows that shorten turnaround times, and national carbon-neutral procurement policies are reshaping purchasing priorities across research, clinical, and public-health settings. Precision-medicine mandates are accelerating the routine use of companion diagnostics. At the same time, export controls on semiconductor components and reagent precursors expose supply-chain dependencies now classified as strategic vulnerabilities by several governments. Biobanks funded by public agencies are embedding carbon accounting into vendor evaluations, prompting suppliers to disclose energy footprints per terabase. Meanwhile, open-chemistry instruments that decouple consumables and hardware purchases are drawing customers away from proprietary ecosystems, intensifying competition, and compressing reagent margins.
Key Report Takeaways
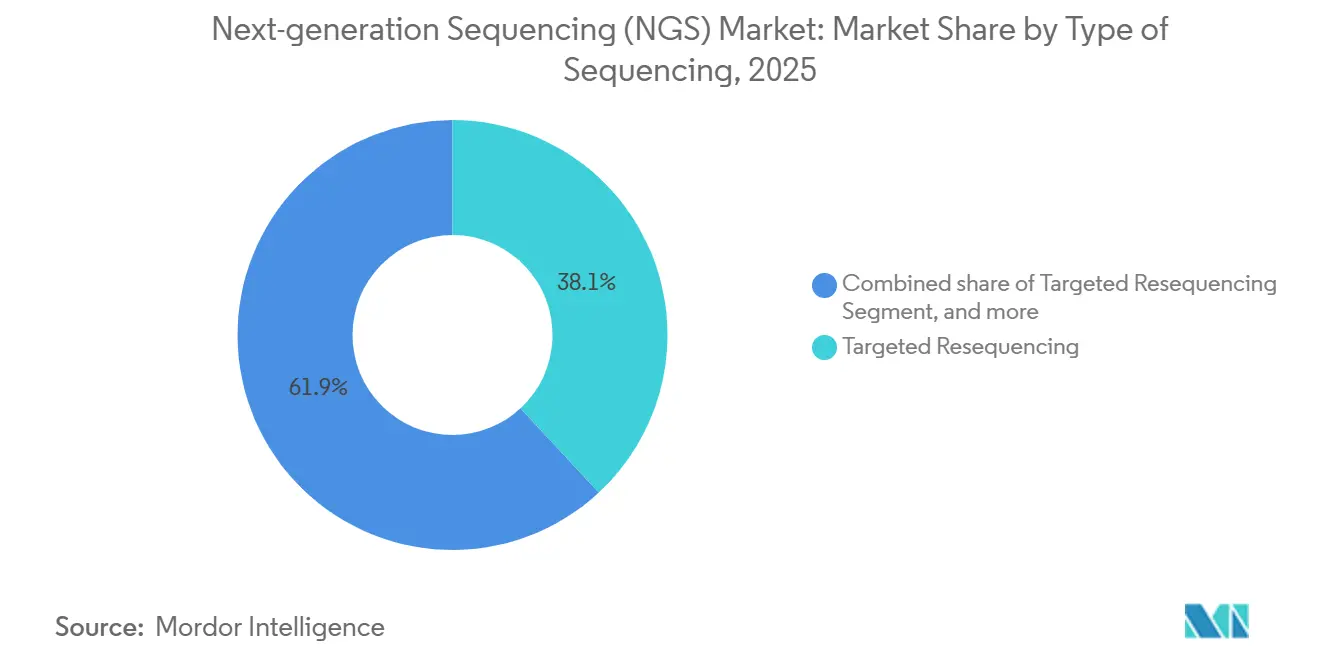
- By type of sequencing, targeted resequencing led the next-generation sequencing market with a 38.09% share in 2025. Whole exome sequencing is forecast to expand at a 14.23% CAGR through 2031, the fastest among sequencing types.
- By product, reagents and consumables accounted for 69.88% share of the next-generation sequencing market size in 2025. Instruments are projected to grow at a 14.39% CAGR between 2026 and 2031, outpacing all other product categories.
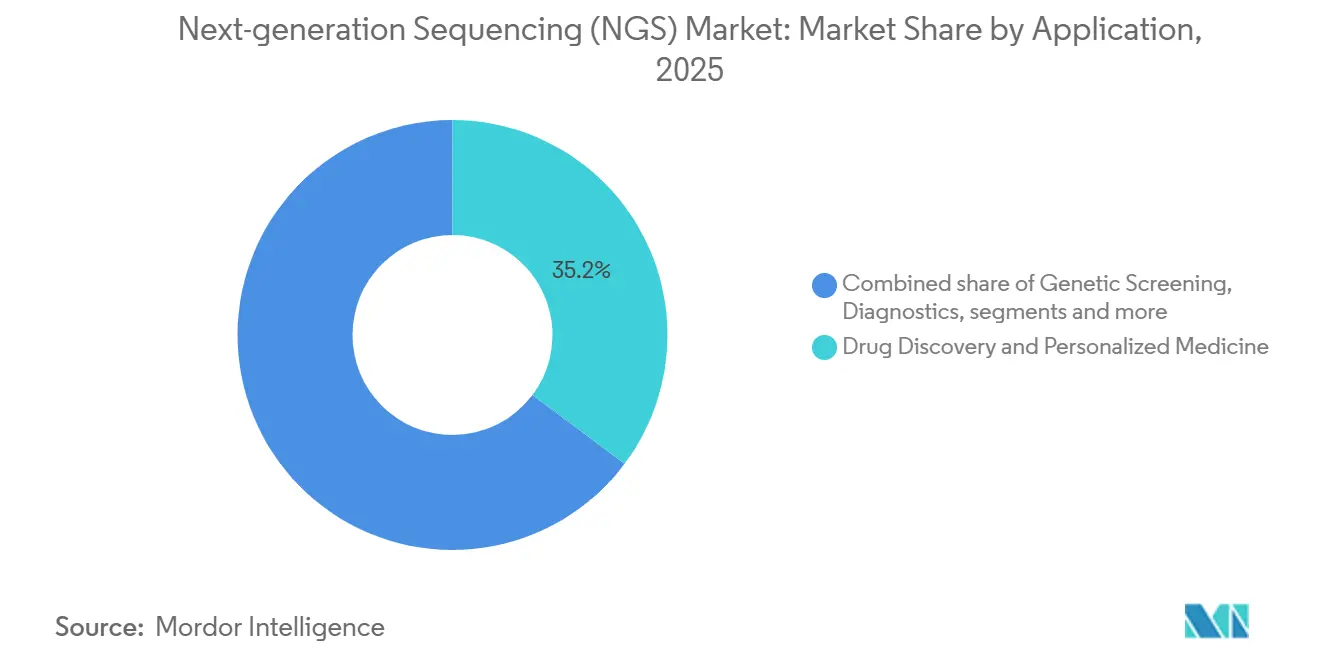
- By application, drug discovery and personalized medicine accounted for a 35.23% revenue share in 2025. Genetic screening is advancing at a 14.33% CAGR through 2031, the highest among applications.
- By end user, academics accounted for 48.44% of spending in 2025 and are sustaining an annual growth rate of 13.98%.
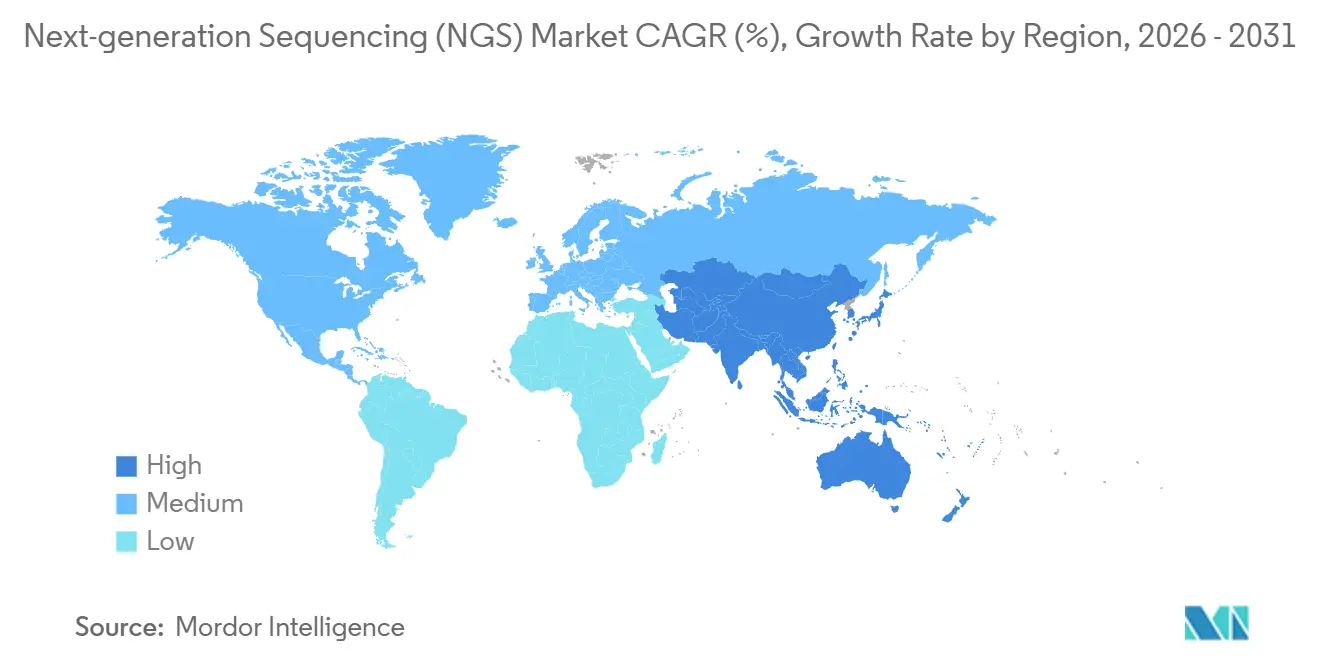
- By geography, North America accounted for 41.9% of revenue in 2025, while the Asia-Pacific region is expected to register a 14.21% CAGR from 2026 to 2031.
Note: Market size and forecast figures in this report are generated using Mordor Intelligence’s proprietary estimation framework, updated with the latest available data and insights as of January 2026.
Market Trends and Insights
Drivers Impact Analysis of Next-generation Sequencing (NGS) Market*
| Driver | (~) % Impact on CAGR Forecast | Geographic Relevance | Impact Timeline |
|---|---|---|---|
| Accelerating adoption of precision medicine and companion diagnostics | +3.2% | Global, led by North America and Europe | Medium term (2-4 years) |
| Continuous decline in cost per genome and throughput gains | +2.8% | Global, notably Asia-Pacific and Latin America | Short term (≤ 2 years) |
| Expansion of population-scale genomics programs | +2.4% | APAC core; spill-over to Middle East | Long term (≥ 4 years) |
| On-cartridge sequencing workflows for point-of-care testing | +1.9% | North America, Europe, urban APAC | Medium term (2-4 years) |
| Sovereign genomic data centers demanding localized NGS capacity | +1.6% | China, India, UAE, Saudi Arabia, Brazil | Long term (≥ 4 years) |
| Carbon-neutral sequencing initiatives influencing procurement | +0.9% | Europe and North America | Long term (≥ 4 years) |
| Source: Mordor Intelligence | |||
Accelerating Adoption of Precision Medicine and Companion Diagnostics
Companion diagnostics linked to targeted therapies are embedding next-generation sequencing into oncology workflows, converting the technology from a research tool to a reimbursable clinical service. The U.S. FDA granted breakthrough designation to 14 NGS-based companion tests during 2024-2025, covering solid tumors such as lung, breast, and melanoma[1]U.S. Food and Drug Administration, “Breakthrough Devices Program Updates 2025,” fda.gov. Medicare’s 2025 coverage expansion for comprehensive genomic profiling eliminated prior-authorization hurdles, boosting test volumes in hospital laboratories. Liquid-biopsy assays that detect circulating tumor DNA are being integrated into earlier treatment lines, with Guardant Health and Foundation Medicine reporting double-digit growth in requisitions in 2025. Although European approvals proceed more slowly, the European Commission’s 2024 proposal to streamline in-vitro diagnostic regulation signals faster clearance pathways after 2027. Collectively, these regulatory trends establish NGS as a clinical mainstay rather than an experimental option.
Continuous Decline in Cost Per Genome and Throughput Gains
Whole-genome sequencing costs fell below USD 500 in 2025 on high-throughput instruments, making population screening economically feasible for public health systems. Ultima Genomics validated a USD 100 genome in peer-reviewed studies during 2024, forcing incumbents to unbundle reagent pricing and rethink revenue models. Illumina’s NovaSeq X delivers 16 terabases per run, enabling laboratories to process thousands of samples weekly. Element Biosciences’ semiconductor-based AVITI platform reduces reagent consumption by 30%, translating cost savings directly to users. These efficiencies are accelerating adoption in middle-income countries that previously considered whole-genome sequencing too expensive for routine diagnostics.
Expansion of Population-Scale Genomics Programs
China, Japan, India, and the United Kingdom each target cohorts exceeding 1 million genomes. China’s Shenzhen National Gene Bank sequenced 800,000 genomes by mid-2025, emphasizing Han ancestry variant databases. Japan’s All Japan Genomic Medicine Program mandates domestic data residency, favoring on-premise sequencing over cloud-only solutions. India’s Genome India Project completed 10,000 genomes across 99 ethnic groups in 2024 and plans to reach 100,000 by 2028. These initiatives consolidate purchasing through national tenders, rewarding suppliers that offer technology transfer and local manufacturing partnerships.
On-Cartridge Sequencing Workflows for Point-of-Care Testing
Integrated cartridges that combine library preparation, amplification, and detection reduce turnaround times from days to hours. Oxford Nanopore’s VolTRAX automates sample-to-sequence workflows for infectious-disease panels. Roche demonstrated a prototype sepsis panel in 2025 that targets emergency departments where empiric antibiotic therapy often precedes culture confirmation. Regulatory uncertainty under CLIA creates approval ambiguity, yet the prospect of same-visit genomic results addresses transport delays that degrade RNA quality in centralized testing.
Restraints Impact Analysis of Next-generation Sequencing (NGS) Market*
| Restraint | (~) % Impact on CAGR Forecast | Geographic Relevance | Impact Timeline |
|---|---|---|---|
| Fragmented global regulatory landscape for clinical NGS | −1.8% | North America, Europe, APAC | Medium term (2-4 years) |
| High capital outlay for long-read and spatial platforms | −1.4% | Global, especially academic labs | Short term (≤ 2 years) |
| Consumable supply-chain vulnerabilities post-export controls | −1.1% | APAC and Middle East | Short term (≤ 2 years) |
| Algorithmic bias in AI-based variant calling and liability risks | −0.7% | North America and Europe | Medium term (2-4 years) |
| Source: Mordor Intelligence | |||
Fragmented Global Regulatory Landscape for Clinical NGS
Divergent approval pathways across the FDA, EU IVDR, and APAC agencies necessitate region-specific validations, which increase time-to-market and costs. The FDA’s 2024 draft on laboratory-developed tests adds oversight that academic medical centers argue may curb innovation[2]U.S. Food and Drug Administration, “Proposed Rule on Laboratory Developed Tests,” fda.gov. Europe’s IVDR extensions to 2027 leave hundreds of assays in limbo, while China’s regulators demand domestic clinical trials, lengthening launches by up to 24 months. Japan’s conditional approval pathway introduced in 2025 still lacks precise post-market requirements, discouraging smaller firms. Maintaining multiple assay versions dilutes economies of scale and favors companies with deep regulatory resources.
High Capital Outlay for Long-Read & Spatial Platforms
Long-read sequencers, such as PacBio’s Sequel IIe, carry price tags ranging from USD 150,000 to USD 350,000, levels that exceed the capital budgets of most hospital laboratories. Spatial transcriptomics platforms, such as 10x Genomics’ Xenium and NanoString’s CosMx, add an additional USD 250,000–500,000 in hardware costs and require specialized histology staff. Consumables priced at USD 800–1,200 per sample restrict routine use to pharmaceutical R&D and a handful of reference centers. Leasing or reagent-rental schemes shift upfront costs to operating expenses but do not resolve staffing shortages or workflow complexity, so adoption remains confined to well-funded institutes.
*Our forecasts treat driver/restraint impacts as directional, not additive. The impact forecasts reflect baseline growth, mix effects, and variable interactions.
Next-generation Sequencing (NGS) Market Segment Analysis
By Type of Sequencing:
Clinical Exomes Outpace Targeted PanelsWhole-exome sequencing is projected to grow at a 14.23% CAGR to 2031 as insurers adopt it for rare-disease diagnostics, redirecting budgets from single-gene tests to comprehensive panels. Targeted resequencing held 38.09% of the next-generation sequencing market share in 2025, driven by oncology panels, yet falling exome costs below USD 200 per sample erode its price advantage. Whole-genome sequencing remains the benchmark for structural variants, although the 30-fold increase in data volume strains hospital IT resources. RNA sequencing is gaining traction in immuno-oncology, and spatial transcriptomics reached USD 180 million in sales in 2025.
The next-generation sequencing market is witnessing rare-disease pathways transition from research to reimbursed care, validating exome tests as first-tier diagnostics. The FDA's approval of the first exome-based neurodevelopmental test in 2025 solidified this transition. Vendors offering turnkey analysis pipelines are gaining favor over those selling raw capacity alone, as community hospitals increasingly adopt next-generation sequencing services with simplified bioinformatics workflows.



By Product Type:
Instruments Gain as Automation Reduces DependencyReagents and consumables captured 69.88% of the next-generation sequencing market size in 2025, but instruments will outpace at 14.39% CAGR through 2031. Benchtop systems that integrate sample prep cut hands-on time and lower point-of-care adoption barriers. Element Biosciences and Singular Genomics employ open-reagent designs that undercut proprietary razor-and-blade models. Illumina’s 2025 reagent-neutral mode acknowledges growing demand for interoperability.
Services, although the smallest segment, are expanding as pharmaceutical sponsors outsource large-scale sequencing to high-throughput centers. Automation platforms from Tecan and Hamilton reduce reagent waste, compressing consumable revenue growth. The shift toward open chemistry compresses margins while broadening the user base, especially among resource-constrained academic institutions.
By Application:
Genetic Screening Surges on Newborn MandatesDrug discovery and personalized medicine accounted for 35.23% of 2025 revenue, but genetic screening is expected to grow at the fastest rate of 14.33% CAGR as governments expand newborn screening panels. The U.K. National Health Service plans to pilot whole-genome sequencing for all newborns in 2025, potentially scaling up to 700,000 infants annually. Japan approved NGS-based spinal muscular atrophy screening in 2024, prompting prefectures to budget for sequencing infrastructure.
Agriculture and animal genomics, although smaller, saw USD 120 million in sequencing spend in 2025 as breeders adopt genomic selection. Multi-omics workflows that merge DNA, RNA, and epigenetic data are becoming feasible on unified platforms, expanding target users beyond traditional molecular labs.
By End User:
Academics Sustain Dominance Through Sovereign FundingAcademic institutions accounted for 48.44% of spending in 2025 and are expected to continue growing at 13.98% as national genomics programs route funds through universities. The U.S. NIH allocated USD 290 million in 2025 to the All of Us Program, with sequencing contracts awarded to academic medical centers. China directed USD 180 million toward university-based genomics hubs during 2024-2025.
Hospitals remain the second-largest segment, driven by tumor profiling and inherited-disease testing, yet constrained by limited bioinformatics staff. Pharmaceutical and biotechnology firms spend more per customer but represent a smaller number of accounts. Sequencing-as-a-service offerings target hospitals that lack in-house capacity, while academic users demand open-source tools and data interoperability.
Geography Analysis
North America Next-generation Sequencing (NGS) Market
North America contributed 41.90% of 2025 revenue, supported by Medicare coverage for comprehensive genomic profiling and the FDA’s expedited approval pathway for companion diagnostics. Canada invested CAD 45 million (approximately USD 33 million) in pediatric rare-disease sequencing in 2025, while Mexico expanded its pharmacogenomic capacity. However, reimbursement remains a challenge to addressing research-oriented workforce shortages in genetic counseling and bioinformatics, tempering growth.
APAC Next-generation Sequencing (NGS) Market
Asia-Pacific is forecast to expand at a 14.21% CAGR, the highest globally. China’s 14th Five-Year Plan earmarked USD 1.2 billion for genomic infrastructure through 2027, and the Shenzhen National Gene Bank surpassed 800,000 genomes by mid-2025. Japan mandates domestic data residency, channeling instrument sales to local facilities, while India plans to reach 100,000 sequenced genomes by 2028. Australia and South Korea advanced reimbursement policies for hereditary disease sequencing in 2024-2025, further fueling regional demand.
Europe Next-generation Sequencing (NGS) Market
Europe’s growth is moderated by IVDR transition delays, which have placed hundreds of lab-developed tests in regulatory limbo through 2025. Germany expanded statutory insurance coverage for tumor profiling in 2024, adding 80,000 tests annually, yet reimbursement rates remain below cost recovery. The U.K. Genomic Medicine Service completed 100,000 whole genomes in 2025 and plans to double by 2027[3]NHS England, “Genomic Medicine Service Progress Report 2025,” england.nhs.uk. France’s national plan committed EUR 670 million (USD 730 million) to 12 regional platforms, though procurement delays pushed installations into late 2025.
Middle East and LATAM Next-generation Sequencing (NGS) Market
The Middle East and Latin America trail in absolute volumes but register rapid project-based uptake. Saudi Arabia’s Genome Program and the UAE’s data-sovereignty rules incentivize local capacity. Brazil piloted NGS-based TB drug-resistance testing in 2024, demonstrating potential public health applications if funding remains stable.

Regulatory Landscape
Clinical NGS continues to be shaped by region-specific approval pathways, which add duplicative validation steps and slow global assay expansion. In the United States, the FDA issued a classification order effective September 11, 2024 that places whole-exome sequencing constituent devices under Class II (510(k)) special controls. The agency is also phasing out broad enforcement discretion for laboratory-developed tests in stages, with Stage 1 beginning May 6, 2025. These steps redirect development priorities toward documented analytical validity, software version control, and bioinformatics verification for regulated clinical use.
In Europe, the IVDR framework continues to tighten performance evaluation and conformity assessment requirements, and Commission Regulation (EU) 2024/1860 (July 9, 2024) extended transition periods for certain legacy IVDs to mitigate supply disruption during the IVDR changeover. China has increased specificity for NGS-related IVD reagents, including classification and technical review expectations, with NMPA guidance issued June 16, 2025 and additional trial technical review points for tumor gene variation detection reagents released June 15, 2026. Overall, the compliance burden is rising for suppliers operating across the FDA, EU IVDR, and NMPA regimes, with closer scrutiny of companion diagnostics and associated reagent kits.
Competitive Landscape
Illumina retains roughly 60% of global instrument placements. Yet, open-chemistry challengers such as Element Biosciences, Singular Genomics, and Ultima Genomics are eroding this lead with lower capital costs and interoperable consumables. Oxford Nanopore’s portable devices address field epidemiology, while PacBio dominates high-fidelity long reads despite instrument prices above USD 350,000. Patent expiries in 2024-2025 enable biosimilar reagents that undercut proprietary chemistries, squeezing margins.
Incumbents bundle multi-year consumable contracts and proprietary analysis software to lock in users; however, academic consortia are increasingly rejecting ecosystem lock-in. Disruptors emphasize workflow simplification and compliance with national data-residency laws, courting sovereign genomics programs. FDA clearance remains a hurdle costing up to USD 10 million per platform, yet agency guidance released in 2024 clarifies pathways, lowering regulatory uncertainty for newcomers.
Next-generation Sequencing (NGS) Industry Leaders
Illumina Inc.
Thermo Fisher Scientific Inc.
BGI Genomics Co. Ltd.
F. Hoffmann-La Roche Ltd.
Oxford Nanopore Technologies Plc
- *Disclaimer: Major Players sorted in no particular order
Next-generation Sequencing (NGS) Market Companies Covered in this Report
- 10x Genomics Inc.
- Agilent Technologies
- BGI Genomics Co. Ltd.
- Bio-Rad Laboratories
- Element Biosciences Inc.
- Eurofins
- Roche
- Fulgent Genetics Inc.
- Guardant Health
- Illumina
- Macrogen
- Oxford Nanopore Technologies Plc
- Pacific Biosciences Of California Inc.
- PerkinElmer
- QIAGEN
- Singular Genomics Systems Inc.
- SOPHiA GENETICS SA
- Thermo Fisher Scientific
- Twist Bioscience Corp.
- Ultima Genomics Inc.

Market Opportunities and Future Outlook
Market opportunities are expanding around integrated sample-to-answer workflows that reduce staffing and informatics requirements for routine sequencing outside large reference centers. In May 2026, Illumina and SPT Labtech unveiled the fireflyGO automation platform for faster, simpler targeted oncology research workflows, reflecting demand for turnkey automation that cuts hands-on time and standardizes execution. Illumina also released DRAGEN v4.5 in April 2026 to extend analysis performance across complex regions and multiomic workflows, supporting labs that want to improve diagnostic yield without rebuilding pipelines for every chemistry update.
A second opportunity sits with platforms and assays that move beyond standard short-read coverage into higher-resolution interpretation, including hard-to-map regions and broader multiomic content. Illumina launched TruPath Genome in February 2026 to improve insight into genomic dark regions and phasing, while Roche launched the AXELIOS 1 sequencing platform in June 2026 based on its SBX technology roadmap, spanning whole-genome and single-cell RNA use cases. On the demand side, cancer screening and earlier interception workflows are pulling sequencing volume toward blood-based approaches, and Caris Life Sciences launched Caris Detect in July 2026, a multi-cancer early detection blood test using ultra-deep whole-genome and transcriptome sequencing combined with AI. That product direction lifts the value of high-throughput reagents and interpretation layers within the market scope.
Recent Industry Developments in Next-generation Sequencing (NGS) Market
- June 2026: Roche launched the AXELIOS 1 sequencing platform based on its sequencing by expansion (SBX) technology, positioning it for whole-genome and single-cell RNA workflows. The launch broadens competitive pressure on incumbent short-read systems by adding a new high-throughput platform option and reinforces the shift toward flexible, multi-application instrument roadmaps.
- May 2026: Illumina and SPT Labtech unveiled fireflyGO, an automation solution designed to accelerate and simplify targeted oncology research workflows. By pairing sequencing workflows with specialized automation, the announcement supports wider adoption in labs seeking higher throughput with less hands-on time and more standardized execution.
- April 2024: NewBiologix SA introduced an advanced sequencing and optical mapping platform aimed at comprehensive genomic analysis services for biopharmaceutical customers. This expanded service-side capability strengthens outsourced sequencing capacity for complex modalities such as gene therapy development and quality characterization.


Next-generation Sequencing (NGS) Market Report Scope and Research Methodology
Market Definition and Coverage
For this study, the next generation sequencing (NGS) market is counted as revenue from sequencing instruments, sequencing reagents and consumables, and sequencing-related services that generate high-throughput DNA or RNA readouts from biological samples.
Scope exclusions: We exclude classical Sanger sequencing platforms, standalone microarray systems, and bioinformatics software sold without sequencing capacity.
Segments Covered in This Report
- By Type of Sequencing
- Whole Genome Sequencing
- Targeted Resequencing
- Whole Exome Sequencing
- RNA Sequencing
- ChIP Sequencing
- De Novo Sequencing
- Methyl Sequencing
- By Product Type
- Instruments
- Reagents And Consumables
- Services
- By Application
- Drug Discovery And Personalized Medicine
- Genetic Screening
- Diagnostics
- Agriculture And Animal Research
- Other Applications (Epigenomics, Metagenomics, Transcriptomics)
- By End User
- Hospitals And Healthcare Institutions
- Academics
- Pharmaceuticals And Biotechnology Companies
- Geography
- North America
- United States
- Canada
- Mexico
- Europe
- Germany
- United Kingdom
- France
- Italy
- Spain
- Rest Of Europe
- Asia-Pacific
- China
- Japan
- India
- South Korea
- Australia
- Rest Of Asia-Pacific
- Middle-East And Africa
- GCC
- South Africa
- Rest Of Middle East And Africa
- South America
- Brazil
- Argentina
- Rest Of South America
- North America
Data Sources, Market Sizing, and Validation
Desk Research
Desk work starts by building the demand and supply context for NGS, then finalizing the market model. We used public and repeatable sources such as the World Health Organization, the US FDA, the US NIH, the World Bank, and OECD health indicators to understand testing activity, funding intensity, and policy direction that can lift or slow adoption.
To keep the model grounded, we also reviewed annual reports and investor presentations, industry association publications, peer-reviewed genomics journals, and credible press coverage that tracks new platform launches and lab expansion. In parallel, paid subscriptions for company financials and news intelligence, along with patent databases, were used to cross-check product revenue mentions and technology activity in a consistent way across regions. The desk sources named here are illustrative, and we consulted many additional references for data collection, validation, and research clarification.
Primary Interviews and Surveys
Primary work was used to pressure-test adoption and pricing logic that is often only partially visible in public sources. We spoke with a mix of sequencing instrument and consumable suppliers, service providers, clinical and research labs, and procurement or lab operations leaders across APAC, EMEA, and the Americas to verify utilization patterns, typical purchasing cycles, and the real pace of price changes.
These conversations also helped confirm how workflows shift between clinical and research use, and where outsourcing versus in-house sequencing is expanding. That input was then used to tighten assumptions and reconcile gaps seen in desk data.
Distribution of primary research fieldwork respondents
| Company type | Respondent position | Region |
|---|---|---|
| Top tier: 30% | CXOs: 18% | APAC: 42% |
| Mid tier: 48% | Functional/Unit leaders: 32% | EMEA: 35% |
| Smaller Players: 22% | Managers: 50% | Americas: 23% |
Market-Sizing & Forecasting
The market was first reconstructed using a top-down approach, where sequencing demand pools were derived from indicators such as clinical testing adoption, research funding intensity, and lab throughput expansion. Those pools were then converted into spending using category-level pricing logic. The totals were corroborated with selective bottom-up approximations, such as sampled ASP multiplied by estimated run volumes, channel checks on consumable pull-through per installed instrument, and service revenue reasonableness checks where outsourcing is common.
A few market inputs were treated as key fingerprints: installed base growth of sequencers, average consumables consumed per run and per sample type, shifts in read length and throughput that affect cost per genome, mix changes between research and clinical workflows, and the spread of reimbursement or national genomics initiatives that can accelerate test volumes. When data was patchy, we filled gaps using anchored ranges from interviews, then constrained assumptions by what procurement cycles and utilization limits make feasible in real labs.
For forecasting, we used scenario analysis, and linked scenarios to variables practitioners can sanity-check, including expected funding cycles, clinical guideline expansion, and capacity additions in high-growth regions. The final forecast path was selected after confirming that implied volume and pricing changes were consistent with what respondents described as achievable over the period.
Data Validation & Update Cycle
Validation is done in multiple steps so the final number is not driven by a single data stream. Model outputs are compared against independent signals such as instrument shipment commentary, observable pricing movements in consumables, and publicly stated lab expansion plans, then variances are investigated before sign-off.
If an outlier is found, we re-check assumptions and, when needed, re-contact interviewees to confirm whether the shift is real or caused by timing, currency conversion, or scope interpretation. Reports are refreshed annually, with interim updates when material events occur, and a final pre-delivery review is completed so clients receive the most current view available at the time.
Mordor Intelligence's Global Next Generation Sequencing Ngs Market Market Size Compared Against Other Published Estimates
It is common to see different market sizes for NGS because the boundaries around what gets counted are not always the same, and because price and utilization assumptions can move the total quickly. Differences also come from how firms treat services versus products, whether they include adjacent tools, and which year is treated as the main base for the forecast.
By checking installed base growth, consumables pull-through per run, and service mix splits by region, Mordor Intelligence ties the total to sequencing capacity and usage rather than assuming a single spending growth rate across all workflows.
Benchmark comparison
| Source | Market Size | Gaps in Research Methodology |
|---|---|---|
| Mordor Intelligence | USD 10.49 B (2025) | |
| Global Consultancy A | USD 11.26 B (2025) | This estimate appears to roll up a broader workflow and application universe, and it is less explicit about excluding standalone bioinformatics or non-sequencing adjacent tools, which can lift the total. |
| Industry Publisher B | USD 10.44 B (2025) | This estimate is close in value, but differences can come from how services are recognized versus product revenue and how platform mix and pricing progression are applied across regions. |
The spread in published values is mainly explained by scope edges and how utilization and pricing are translated into spending. Our method stays traceable to capacity and consumption drivers, which makes the market size easier to reproduce and refresh when adoption or pricing signals change.


Key Questions Answered in the Report
How large is the next-generation sequencing market in 2026?
It is valued at USD 11.81 billion, with a forecast to reach USD 22.43 billion by 2031 at a 13.69% CAGR.
Which sequencing type is growing fastest through 2031?
Whole exome sequencing is projected to expand at 14.23% CAGR as insurers reimburse it for rare-disease diagnostics.
What region is expected to record the highest growth?
Asia-Pacific is set to grow at 14.21% CAGR, propelled by national genomics hubs in China, Japan, and India.
Which product category currently dominates spending?
Reagents and consumables hold 69.88% of 2025 revenue, though instruments are now the fastest-growing category.
Why are governments investing in sovereign genomic infrastructure?
Export-control risks and data-sovereignty mandates drive nations to localize sequencing capacity and bioinformatics resources.
What is the main competitive challenge faced by incumbents?
Open-chemistry platforms that separate hardware and consumable purchases are compressing reagent margins and chipping away at legacy market share.
Page last updated on:




