Market Overview
| Study Period | 2020 - 2031 |
|---|---|
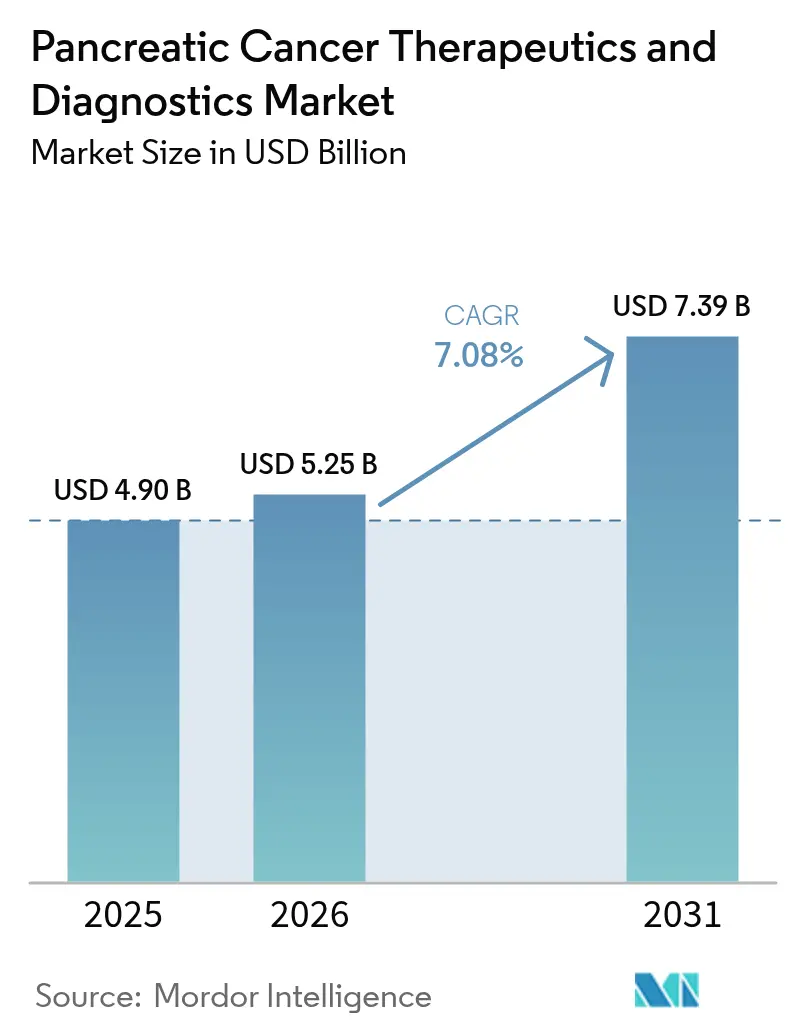
| Market Size (2026) | USD 5.25 Billion |
| Market Size (2031) | USD 7.39 Billion |
| Growth Rate (2026 - 2031) | 7.08% CAGR |
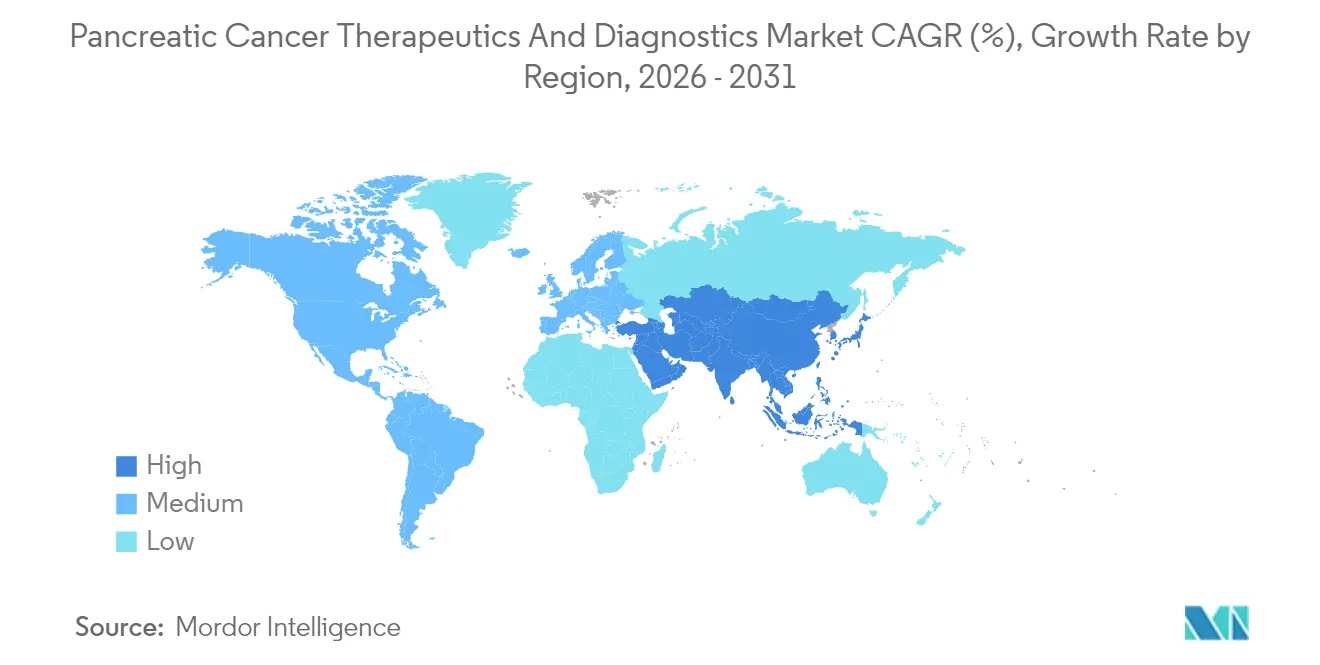
| Fastest Growing Market | Asia Pacific |
| Largest Market | North America |
| Market Concentration | High |
Major Players *Disclaimer: Major Players sorted in no particular order Image © Mordor Intelligence. Reuse requires attribution under CC BY 4.0. | |
Pancreatic Cancer Therapeutics And Diagnostics Market Analysis by Mordor Intelligence
The Pancreatic Cancer Therapeutics And Diagnostics market size is expected to grow from USD 4.90 billion in 2025 to USD 5.25 billion in 2026 and is forecast to reach USD 7.39 billion by 2031 at 7.08% CAGR over 2026-2031.
Robust demand is fueled by accelerated U.S. FDA breakthrough designations; the rapid uptake of biomarker-guided precision therapies; and artificial-intelligence imaging platforms that narrow time to diagnosis. Venture-capital inflows into liquid-biopsy start-ups, combined with expanding reimbursement for next-generation sequencing panels in North America and Europe, add structural tailwinds. Meanwhile, Asia-Pacific records the sharpest incidence growth, compelling health systems to invest in early-detection infrastructure and combination-therapy capacity. Competitive intensity rises as large biopharma incumbents pursue pipeline co-development deals with niche biotechnology firms to capture white-space mechanisms such as focal-adhesion-kinase inhibition. Supply-chain pressures in radiopharmaceutical isotopes and historically high Phase III attrition rates temper the outlook but have not derailed capital formation.
Key Report Takeaways
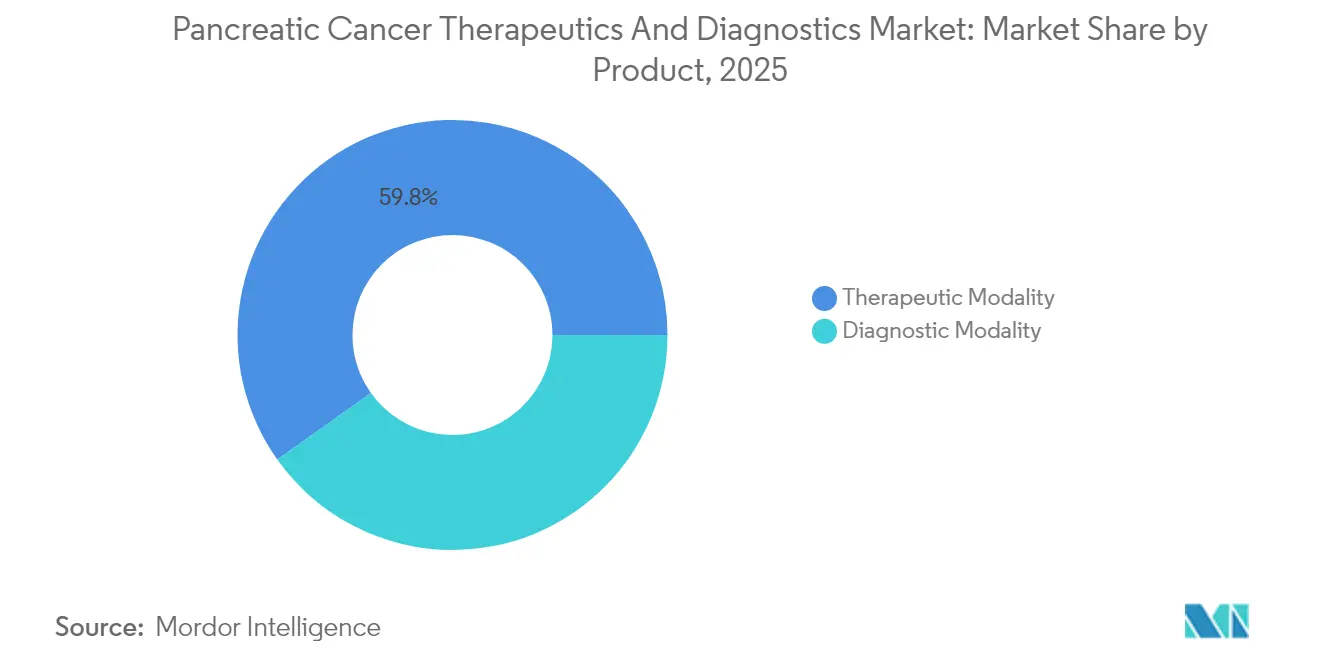
- By product, therapeutic modalities held 59.84% of pancreatic cancer therapeutics and diagnostics market share in 2025, while diagnostic modalities post the highest 7.55% CAGR to 2031 .
- By end user, hospitals and academic medical centers accounted for 51.62% of the pancreatic cancer therapeutics and diagnostics market size in 2025; diagnostic laboratories are projected to expand at a 7.31% CAGR through 2031.
- By geography, North America led with 43.92% revenue share in 2025; Asia-Pacific is anticipated to register the fastest 7.86% CAGR between 2026 and 2031.
Note: Market size and forecast figures in this report are generated using Mordor Intelligence’s proprietary estimation framework, updated with the latest available data and insights as of 2026.
Global Pancreatic Cancer Therapeutics And Diagnostics Market Trends and Insights
Driver Impact Analysis*
| Driver | (~) % Impact on CAGR Forecast | Geographic Relevance | Impact Timeline |
|---|---|---|---|
| Rising incidence & earlier-stage detection rates | +1.2% | Global, with highest impact in Asia-Pacific and North America | Medium term (2-4 years) |
| Accelerated FDA fast-track designations for novel therapies | +1.8% | North America primary, spillover to Europe and Asia-Pacific | Short term (≤ 2 years) |
| Surge in biomarker-guided precision medicine trials | +1.5% | Global, concentrated in developed markets | Medium term (2-4 years) |
| Growing reimbursement for next-generation sequencing panels | +0.9% | North America and Europe primary | Medium term (2-4 years) |
| Venture-capital inflow into liquid-biopsy start-ups | +0.7% | Global, with concentration in North America and Europe | Long term (≥ 4 years) |
| AI-driven imaging algorithms improving diagnostic accuracy | +1.1% | Global, with early adoption in developed markets | Long term (≥ 4 years) |
| Source: Mordor Intelligence | |||
Rising incidence & earlier-stage detection rates
Population aging and lifestyle shifts are sending pancreatic adenocarcinoma incidence climbing, especially in China and the United States. Surveillance programs that monitor familial and genetic high-risk cohorts now report 50% five-year survival for screen-detected cases versus 9% for symptomatic presentations[1]Source: National Cancer Institute, “Surveillance for People at High Risk of Pancreatic Cancer,” cancer.gov . High-resolution MRI coupled with liquid-biopsy assays capable of 95% sensitivity are detecting pre-malignant lesions, moving treatment intent from palliation to cure. Surgical centers are expanding robotics suites to meet early-stage resection demand, while neoadjuvant chemotherapy protocols such as PAXG deliver 31% three-year event-free survival, more than doubling historical outcomes . The combined epidemiologic and diagnostic momentum materially lifts procedure volumes and systemic-therapy utilization across the pancreatic cancer therapeutics and diagnostics market.
Accelerated FDA fast-track designations for novel therapies
The U.S. FDA has labeled multiple pancreatic cancer assets—Daraxonrasib for KRAS mutations, EBC-129 ADC, and the DAMO PANDA AI diagnostic tool—as breakthrough products, trimming typical timelines by nearly two years. Parallel companion-diagnostic reviews streamline synchronized market entry for test-and-treat bundles. Such regulatory velocity incentivizes investors, boosting valuations and expediting Phase II/III financing rounds for start-ups positioned inside the pancreatic cancer therapeutics and diagnostics market. European and Asian regulators frequently reciprocate accelerated reviews, amplifying global spillover.
Surge in biomarker-guided precision medicine trials
KRAS-targeted compounds like Zoldonrasib record 30% overall response in G12D-mutated cases, redefining expectations for a once-undruggable lesion. Multi-omics enrollment algorithms cut screen-failure rates and drive smaller, faster studies. Circulating-tumor-DNA decline now functions as an early surrogate for overall survival, allowing adaptive trial designs that recycle non-responders into alternative arms. These efficiencies are shrinking capital burn and elevating approval probabilities inside the pancreatic cancer therapeutics and diagnostics industry.
Growing reimbursement for next-generation sequencing panels
Medicare’s fixed USD 1,160 code for the Avantect 20-gene panel signposts payers’ recognition that comprehensive genomic insights lower downstream costs through optimized therapy alignment . German and Japanese insurers are following suit. Hospital networks have begun embedding sequencing into standard care pathways, ensuring every resected pancreatic tumor receives actionable profiling. Reimbursement security anchors sustainable volumes for specialized molecular labs, propelling the pancreatic cancer therapeutics and diagnostics market.
Restraint Impact Analysis*
| Driver | (~) % Impact on CAGR Forecast | Geographic Relevance | Impact Timeline |
|---|---|---|---|
| High attrition rates in late-stage clinical trials | -1.4% | Global, with highest impact in North America and Europe | Medium term (2-4 years) |
| Limited patient pools constrain trial enrollment | -0.8% | Global, with particular challenges in rare mutation subsets | Long term (≥ 4 years) |
| Complex supply chain for radiopharmaceutical tracers | -0.9% | Global, with acute shortages in Europe and North America | Short term (≤ 2 years) |
| Rising pricing pressure from payers & HTA bodies | -1.1% | North America and Europe primary, expanding to Asia-Pacific | Medium term (2-4 years) |
| Source: Mordor Intelligence | |||
High attrition rates in late-stage clinical trials
Pancreatic tumors’ dense stroma and immunosuppressive microenvironment render many promising agents ineffective in Phase III. Recent high-profile immunotherapy combinations failed to demonstrate significant survival benefit, triggering portfolio reshuffles and depressing follow-on funding. Regulators now mandate larger cohorts and longer follow-up, pushing development costs above USD 450 million per asset. These setbacks delay the flow of new treatments into the pancreatic cancer therapeutics and diagnostics market and heighten investors’ risk perception.
Limited patient pools constrain trial enrollment
Biomarker-defined subsets, such as NRG1 fusion carriers, represent <1% of pancreatic cases, making multi-arm studies logistically complex and expensive. Geographic concentration of high-volume centers forces patients to travel long distances, and rapid clinical decline between screening and randomization disqualifies many candidates. Sponsors increasingly launch umbrella protocols across 12-15 countries to aggregate sufficient numbers, escalating administrative overhead and stretching timelines inside the pancreatic cancer therapeutics and diagnostics market.
*Our forecasts treat driver/restraint impacts as directional, not additive. The impact forecasts reflect baseline growth, mix effects, and variable interactions.
Segment Analysis
By Product: Therapeutic Dominance Meets Diagnostic Innovation
Therapeutic modalities captured 59.84% of pancreatic cancer therapeutics and diagnostics market share in 2025, underpinned by combination regimens like NALIRIFOX that extend median overall survival beyond 12 months. Chemotherapy remains the foundation, yet targeted KRAS-blocking agents and subcutaneous checkpoint inhibitors add differentiated options. Radiopharmaceutical advances and stereotactic ablative radiotherapy further diversify the therapeutic armamentarium. Manufacturers pair new drugs with companion diagnostics to ensure precise patient selection, driving bundled revenue streams. Competitive rivalry centers on pipeline depth and speed to secure additional breakthrough designations that can convert into first-mover advantage.
Diagnostic modalities expand at a 7.55% CAGR, the fastest within the pancreatic cancer therapeutics and diagnostics market. Liquid-biopsy platforms integrating exosomal microRNA panels now achieve 97% accuracy when combined with CA19-9, enabling stage I detection. AI-enhanced endoscopic ultrasound improves lesion delineation, shortening procedure time and minimizing false negatives. Multi-omics assays that merge genomics, proteomics, and metabolomics shape next-generation companion diagnostics. Vendor differentiat ion hinges on analytical sensitivity and frictionless integration into oncologists’ ordering systems, fostering high switching costs.


By End User: Hospital Consolidation Drives Laboratory Growth
Hospitals and academic medical centers held 51.62% of the pancreatic cancer therapeutics and diagnostics market size in 2025, leveraging multidisciplinary teams and high-volume surgery programs. Vertical integration allows on-site infusion, advanced imaging, and clinical-trial enrollment, anchoring referral networks. Capital expenditures focus on proton-therapy bays and robotic-assisted surgery suites, positioning these centers as regional hubs for complex pancreatic procedures. Their purchasing scale secures favorable drug pricing and sequencing-platform discounts, defending share.
Diagnostic laboratories, though smaller today, are projected to grow 7.31% annually, the fastest among end users. Specialized labs deploy 600-gene panels and high-throughput ctDNA platforms that exceed hospital lab capabilities. Oncology clinics outsource complex testing to these centers, benefiting from rapid, standardized reports that drive therapy alignment. As liquid-biopsy adoption widens, reference labs integrate phlebotomy networks to simplify specimen logistics, solidifying their role within the pancreatic cancer therapeutics and diagnostics market.
Geography Analysis
North America generated 43.92% of 2025 revenue. Accelerated FDA reviews and Medicare reimbursement for next-generation sequencing underpin high adoption levels. Yet cost-effectiveness scrutiny intensifies; analyses peg NALIRIFOX at USD 206,341 per QALY, pushing payers toward value-based contracting . Academic expansions, such as the approved 300-bed Dana-Farber hospital, deepen regional expertise and clinical-trial throughput.
Asia-Pacific is forecast to post an 7.86% CAGR, the strongest globally. China’s aging population, rising obesity, and smoking prevalence propel incidence, while public-private partnerships finance molecular-testing labs and precision-oncology parks. Japan’s regulatory harmonization with U.S. breakthrough-therapy policies shortens drug-approval lags to under six months, facilitating swift diffusion of innovative regimens. Governments allocate funds for surgeon-training programs in robotic resection, elevating curative-intent procedure volumes.
Europe maintains moderate growth as the European Medicines Agency approved 28 oncology therapies in 2024, including NALIRIFOX. Health-technology assessments by NICE increasingly factor pharmacogenomics, incentivizing payers to reimburse sequencing. Cross-border clinical-trial consortia streamline enrollment for rare biomarker cohorts, while EU investments in isotope-production facilities mitigate sporadic shortages that hamper diagnostic imaging. Still, stringent price negotiations curb immediate revenue upside for manufacturers within the pancreatic cancer therapeutics and diagnostics market.

Competitive Landscape
The pancreatic cancer therapeutics and diagnostics market remains moderately fragmented. Bristol Myers Squibb advanced a subcutaneous nivolumab formulation, easing infusion-center burden while sustaining PD-1 inhibitor growth. Roche expanded its oncology assay portfolio, integrating liquid-biopsy tests with sequencing systems and dedicating CHF 13 billion to R&D in 2025. Novocure’s Tumor Treating Fields therapy achieved 16.2-month median overall survival in PANOVA-3 and is slated for FDA submission, introducing a non-systemic modality that may complement chemotherapy.
Strategic collaborations define the competitive narrative. Mainz Biomed partnered with Liquid Biosciences to co-develop mRNA biomarker assays boasting 95% sensitivity to stage I disease, underscoring diagnostics’ convergence with therapeutics. Arrivent joined forces with Alphamab to build antibody-drug conjugates leveraging proprietary linker technology, targeting multi-antigen payload delivery. RenovoRx’s Phase III chemo-infusion platform demonstrates the appeal of device-drug synergies to circumvent systemic toxicity. Emergent players exploit niche mechanisms—focal-adhesion-kinase blockade and stromal-digesting enzymes—to challenge incumbents, while AI vendors embed imaging analytics into hospital PACS to lock in radiology workflows.
Regulatory compliance increasingly necessitates co-development of companion diagnostics, compelling drug developers to either build in-house assays or secure exclusive partnerships. As integrated solutions proliferate, competitive advantage tilts toward companies capable of delivering end-to-end diagnostic-therapeutic ecosystems within the pancreatic cancer therapeutics and diagnostics market.
Pancreatic Cancer Therapeutics And Diagnostics Industry Leaders
Myriad Genetics, Inc.
Pfizer, Inc
Novartis AG
AstraZeneca plc
Immunovia AB
- *Disclaimer: Major Players sorted in no particular order

Recent Industry Developments
- February 2024: Johns Hopkins Medicine initiated patient enrollment for RenovoRx’s Phase III TIGeR-PaC trial evaluating localized drug-delivery technology for pancreatic cancer
- May 2025: Novocure reported that PANOVA-3 met its primary endpoint, with Tumor Treating Fields plus chemotherapy extending median overall survival to 16.2 months, and plans FDA submission for late 2025


Global Pancreatic Cancer Therapeutics And Diagnostics Market Report Scope
As per the scope, pancreatic cancer occurs when there is an uncontrollable growth of cells in the pancreas. Pancreatic cancer is categorized as exocrine and endocrine based on the cells affected by cancer. The pancreatic cancer therapeutics and diagnostics market is segmented by type, end user, and geography. By type, the market is segmented into treatment (targeted therapies, chemotherapy, surgery, and other treatments) and diagnostics (imaging, biopsy, endoscopic ultrasound, and other diagnostics). By end user, the market is segmented into hospitals, clinics, and other end users. By geography, the market is segmented into North America, Europe, Asia-Pacific, the Middle East and Africa, and South America. The market report also covers the estimated market sizes and trends for 17 countries across major regions globally. The report offers the value (in USD) for the above segments.
By Product
| Therapeutic Modality | Chemotherapy |
| Targeted Therapy | |
| Immunotherapy | |
| Radiotherapy | |
| Combination Therapy | |
| Diagnostic Modality | Imaging (CT, MRI, PET) |
| Endoscopic Ultrasound (EUS) | |
| Biomarker Tests | |
| Liquid Biopsy | |
| Molecular Diagnostics |
By End User
| Hospitals & Academic Medical Centers |
| Oncology Specialty Clinics |
| Diagnostic Laboratories |
| Research Institutes |
By Geography
| North America | United States |
| Canada | |
| Mexico | |
| Europe | Germany |
| United Kingdom | |
| France | |
| Italy | |
| Spain | |
| Rest of Europe | |
| Asia-Pacific | China |
| India | |
| Japan | |
| South Korea | |
| Australia | |
| Rest of Asia-Pacific | |
| South America | Brazil |
| Argentina | |
| Rest of South America | |
| Middle East and Africa | GCC |
| South Africa | |
| Rest of Middle East and Africa |
| By Product | Therapeutic Modality | Chemotherapy |
| Targeted Therapy | ||
| Immunotherapy | ||
| Radiotherapy | ||
| Combination Therapy | ||
| Diagnostic Modality | Imaging (CT, MRI, PET) | |
| Endoscopic Ultrasound (EUS) | ||
| Biomarker Tests | ||
| Liquid Biopsy | ||
| Molecular Diagnostics | ||
| By End User | Hospitals & Academic Medical Centers | |
| Oncology Specialty Clinics | ||
| Diagnostic Laboratories | ||
| Research Institutes | ||
| By Geography | North America | United States |
| Canada | ||
| Mexico | ||
| Europe | Germany | |
| United Kingdom | ||
| France | ||
| Italy | ||
| Spain | ||
| Rest of Europe | ||
| Asia-Pacific | China | |
| India | ||
| Japan | ||
| South Korea | ||
| Australia | ||
| Rest of Asia-Pacific | ||
| South America | Brazil | |
| Argentina | ||
| Rest of South America | ||
| Middle East and Africa | GCC | |
| South Africa | ||
| Rest of Middle East and Africa | ||


Key Questions Answered in the Report
What is the projected value of the pancreatic cancer therapeutics and diagnostics market in 2031?
It is expected to reach USD 7.39 billion, expanding at a 7.08% CAGR from 2026.
Which product segment grows fastest over the forecast horizon?
Diagnostic modalities, led by liquid-biopsy and AI imaging, post a 7.55% CAGR through 2031.
Which region shows the highest growth rate?
Asia-Pacific records the fastest 7.86% CAGR, driven by rising incidence and expanding precision-oncology infrastructure.
Why are liquid-biopsy platforms attracting significant investment?
Exosome-based assays now demonstrate up to 97% accuracy, enabling earlier detection and repeat-testing revenue streams.
How do FDA fast-track designations influence market dynamics?
They shorten development timelines by up to two years, accelerating product launches and raising company valuations.
What challenges most constrain late-stage clinical success?
High Phase III attrition stems from pancreatic cancers aggressive biology and limited trial-enrollment pools, inflating development costs.
Page last updated on:


