Technology Spending On Core Administration In Healthcare Market Size and Share
Market Overview
| Study Period | 2019 - 2030 |
|---|---|
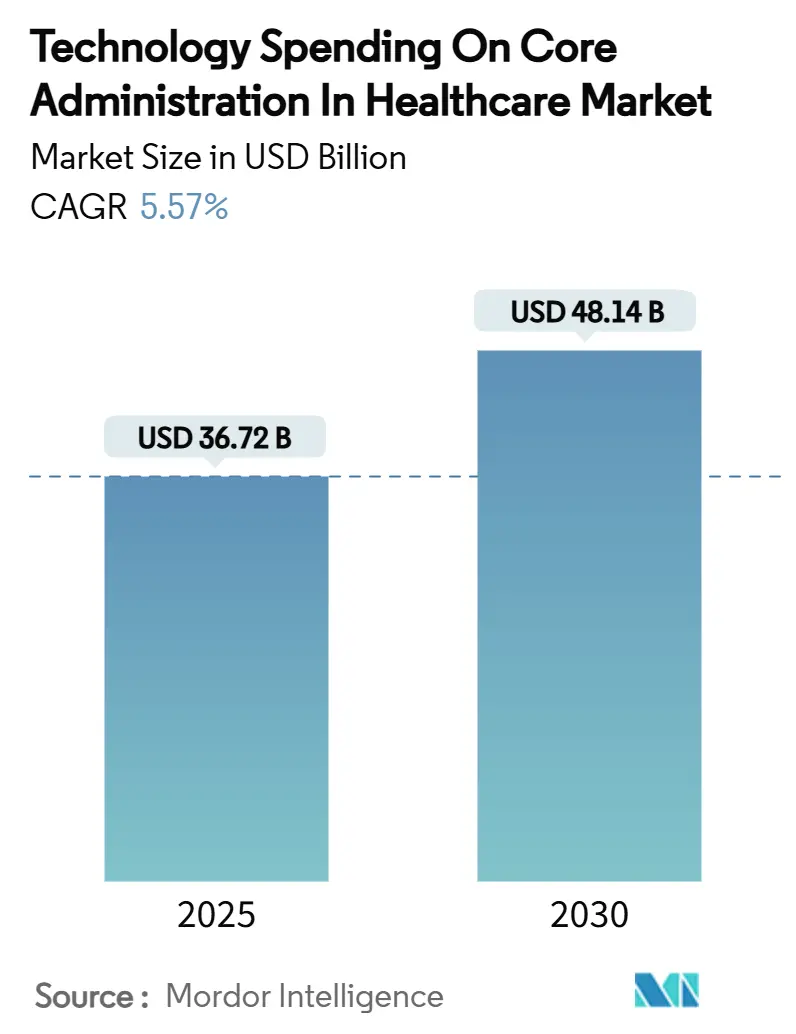
| Market Size (2025) | USD 36.72 Billion |
| Market Size (2030) | USD 48.14 Billion |
| Growth Rate (2025 - 2030) | 5.57% CAGR |
| Fastest Growing Market | Asia Pacific |
| Largest Market | North America |
| Market Concentration | Medium |
Major Players *Disclaimer: Major Players sorted in no particular order Image © Mordor Intelligence. Reuse requires attribution under CC BY 4.0. | |
Technology Spending On Core Administration In Healthcare Market Analysis by Mordor Intelligence
The Technology Spending on Core Administration in Healthcare market size stood at USD 36.72 billion in 2025 and is forecast to climb to USD 48.14 billion by 2030, posting a 5.57% CAGR across the period as buyers temper experimental pilots in favor of proven, efficiency-oriented solutions. Maturation of payer and provider IT roadmaps is steering budgets toward platforms that demonstrably lower unit costs, simplify compliance, and unlock scalable operating models. Regulatory deadlines—most notably the CMS Interoperability and Prior Authorization Final Rule—are accelerating refresh cycles as health plans face stiff penalties for lagging FHIR readiness.[1]Centers for Medicare & Medicaid Services, “CMS Interoperability and Prior Authorization Final Rule CMS-0057-F,” cms.gov Competitive intensity is mounting: claims-centric core platforms already hold 37.27% Technology Spending on Core Administration in Healthcare market share in 2024, while AI-heavy payment-integrity suites are expanding at an 8.44% CAGR as payers chase improper-payment savings. Cloud deployment models captured 63.25% penetration in 2024 as hybrid architectures become the de facto risk-mitigation strategy, and Business Process-as-a-Service (BPaaS) captured 53.79% revenue share as mid-tier plans off-load fixed costs to specialist partners.
Key Report Takeaways
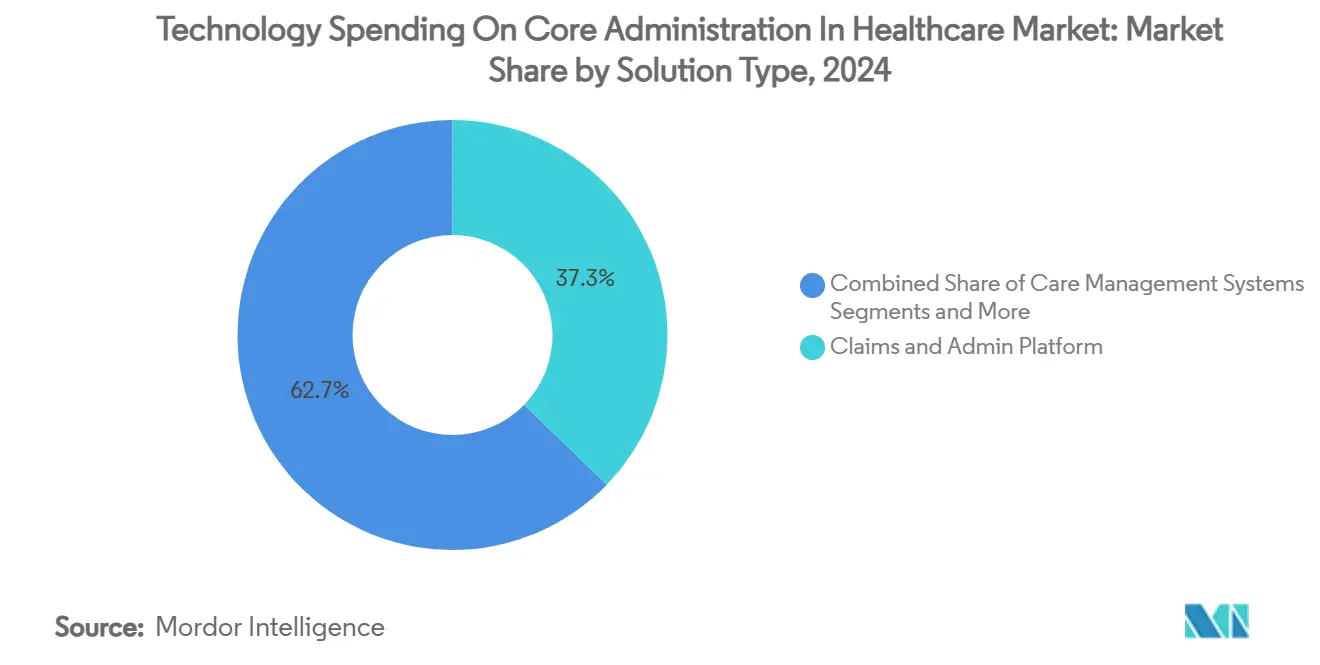
- By solution type, claims and administration platforms led with 37.27% of Technology Spending on Core Administration in Healthcare market share in 2024, while payment integrity and fraud detection solutions are forecast to register the quickest 8.44% CAGR through 2030.
- By deployment mode, cloud models represented 63.25% of the Technology Spending on Core Administration in Healthcare market size in 2024; hybrid approaches are projected to grow at a 9.36% CAGR over 2025-2030.
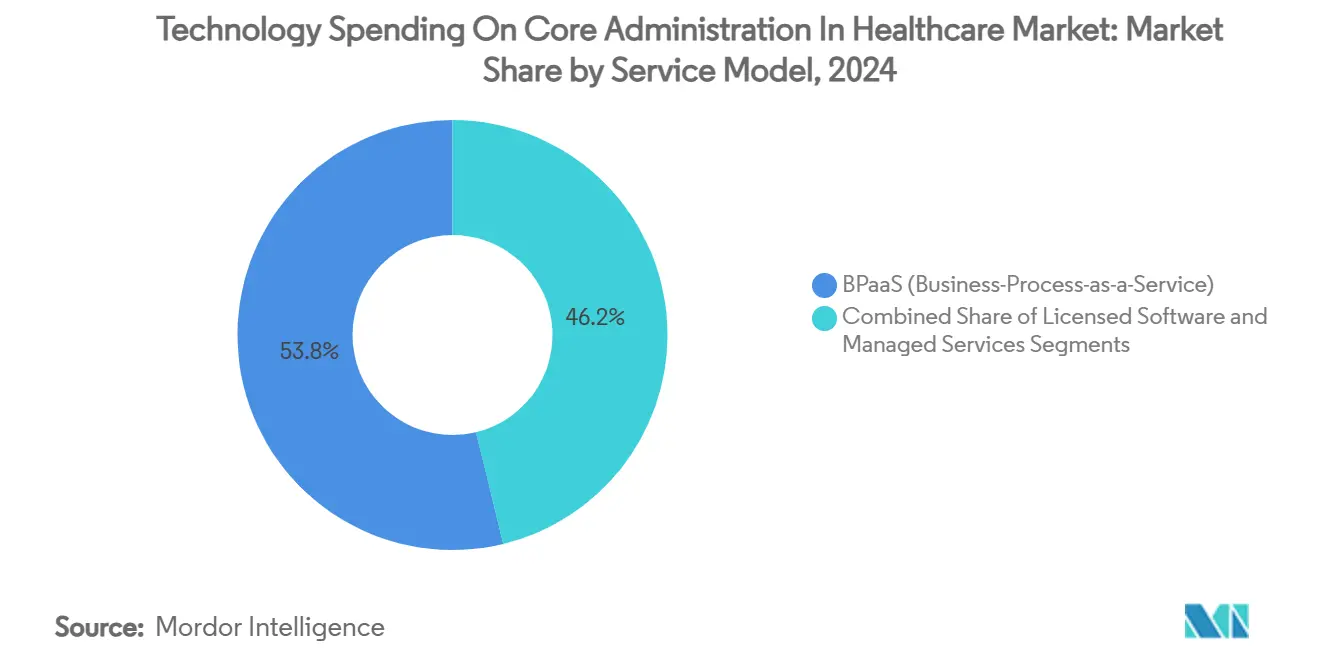
- By service model, BPaaS commanded 53.79% share of the Technology Spending on Core Administration in Healthcare market size in 2024 and is advancing at an 8.96% CAGR to 2030.
- By end user, payers held 48.67% of Technology Spending on Core Administration in Healthcare market share in 2024, whereas third-party administrators are poised for the fastest 9.12% CAGR through 2030.
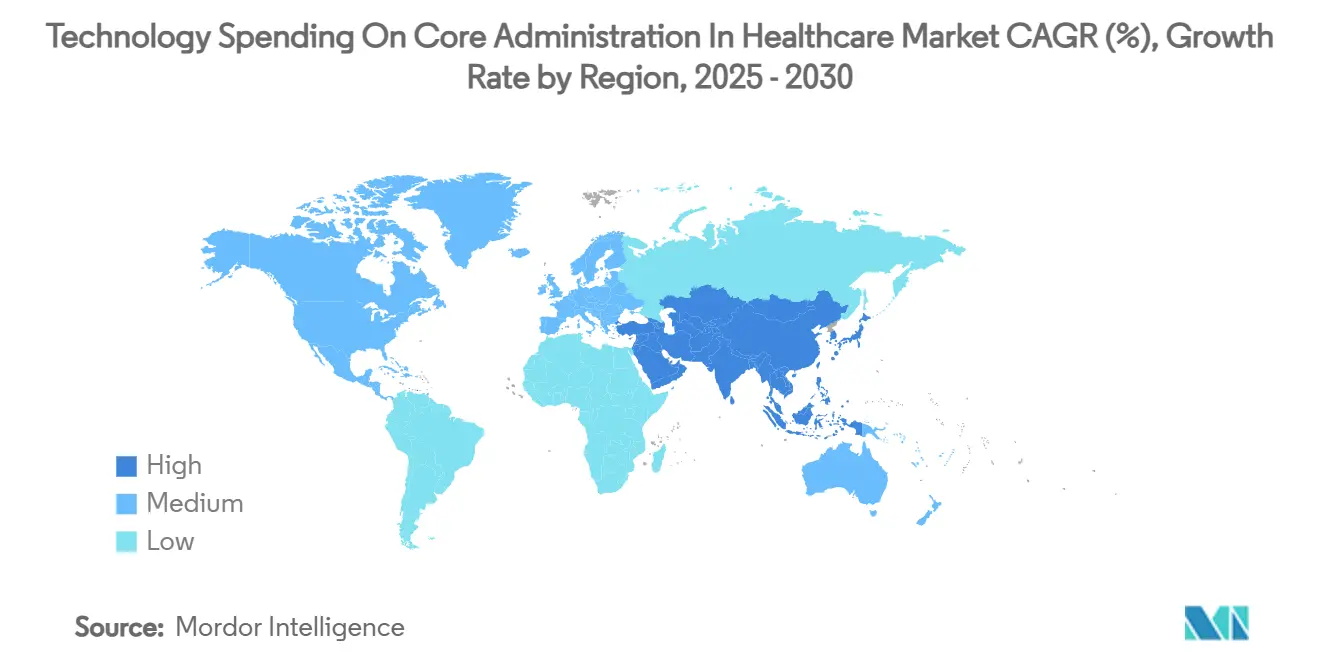
- North America contributed 44.78% of Technology Spending on Core Administration in Healthcare market share in 2024; Asia-Pacific is projected to expand at a 7.84% CAGR, the highest among all regions.
Global Technology Spending On Core Administration In Healthcare Market Trends and Insights
Drivers Impact Analysis*
| Driver | (~) % Impact on CAGR Forecast | Geographic Relevance | Impact Timeline |
|---|---|---|---|
| Shift to value-based care accelerating CAPS refresh | +1.2% | Global, North America leading | Medium term (2-4 years) |
| Escalating claims volume & complexity | +0.8% | Global, mature markets | Short term (≤ 2 years) |
| Regulatory push for real-time data exchange | +1.1% | North America primary, EU secondary | Short term (≤ 2 years) |
| AI-driven pre-payment integrity savings | +0.9% | Global, advanced markets | Medium term (2-4 years) |
| Mid-tier plans adopting BPaaS to slash fixed costs | +0.7% | North America & APAC | Short term (≤ 2 years) |
| Rise of open-API “composable” core ecosystems | +0.6% | Global, tech-forward regions | Long term (≥ 4 years) |
| Source: Mordor Intelligence | |||
Shift To Value-Based Care Accelerating CAPS Refresh
Adoption of value-based reimbursement is forcing payers to retire fee-for-service era core administrative processing systems (CAPS) that struggle with shared-savings accounting, longitudinal quality metrics and risk adjustment. UnitedHealth Group’s enterprise-wide AI program illustrates how leading insurers are embedding predictive insights in day-to-day operations to move from detection to prevention. Replacement cycles averaging 3-5 years have intensified as Medicare Advantage enrollment is forecast to surge 60% by 2030, escalating the need for platforms that automate Hierarchical Condition Category (HCC) coding and Star-rating analytics. Regional carriers see modern CAPS as a competitive equalizer against national players that already integrate clinical, financial and social-determinant data.
Escalating Claims Volume & Complexity
Administrative spending jumped 50% to USD 82.7 billion in 2022 as claim-status inquiries grew 71% and eligibility checks rose 60%. Specialty drug pipelines, prior-authorization burdens and multipayer coordination now strain legacy rules engines designed for simpler transactions. Forty-six percent of hospitals employed AI in revenue-cycle tasks in 2024, aiming to push auto-adjudication rates beyond the 75% industry average toward the 94% benchmark achieved by market leaders.[2]American Hospital Association, “Artificial Intelligence Adoption in Revenue-Cycle Management—2024 Trend Report,” aha.org Third-party administrators (TPAs) are under particular pressure because throughput directly impacts fee-based margins.
Regulatory Push For Real-Time Data Exchange (CMS, IFRs)
The CMS Final Rule compels payers to publish FHIR APIs by January 2027 and issue prior-authorization determinations within 72 hours for expedited cases.[3]Assistant Secretary for Public Affairs, “CMS Finalizes Rule to Expand Access to Health Information and Improve the Prior Authorization Process,” U.S. Department of Health and Human Services, hhs.gov TEFCA, effective January 2025, further standardizes bulk data transfer, making compliance an existential requirement rather than an IT enhancement.[4]U.S. Department of Health and Human Services, “Health Data, Technology, and Interoperability: Trusted Exchange Framework and Common Agreement (TEFCA),” Federal Register, federalregister.gov Penalties for information blocking extend to exclusion from federal incentive programs, steering budgets toward natively compliant platforms.
AI-Driven Pre-Payment Integrity Savings
Improper Medicare and Medicaid payments exceeded USD 100 billion in 2023, energizing demand for AI that flags suspect claims before disbursement. Machine-learning models that analyze coding velocity, provider behavior and historical denial patterns can cut administrative cost by 25-30%. Optum reports 20% coder-productivity gains after deploying a predictive auditing engine that prioritizes high-risk claims. Governance maturity—spanning data quality, model explainability and bias checks—has become a differentiator among vendors pitching AI-driven savings.
Restraints Impact Analysis*
| Restraint | (~) % Impact on CAGR Forecast | Geographic Relevance | Impact Timeline |
|---|---|---|---|
| High migration & change-management costs | -0.9% | Global, acute in large organizations | Medium term (2-4 years) |
| Cyber-security & PHI privacy concerns | -0.6% | Global, heightened in regulated markets | Short term (≤ 2 years) |
| Shortage of FHIR/API modernization talent | -0.4% | Global, severe in emerging markets | Long term (≥ 4 years) |
| Payer consolidation dampening vendor TAM growth | -0.3% | North America primary, global secondary | Medium term (2-4 years) |
| Source: Mordor Intelligence | |||
High Migration & Change-Management Costs
Full CAPS migrations span 18-36 months and can see ancillary expenditures—data cleansing, dual-run operations, end-user retraining—swell to triple license fees. Penn State Health’s prolonged Epic negotiations illustrate the caution even well-funded systems exercise when weighing switch-over risk. The specter of claims-payment disruption and member abrasion often tilts boards toward incremental upgrades over wholesale replacement, delaying uplift to more efficient architectures for years.
Cyber-Security & PHI Privacy Concerns
More than half of global providers faced ransomware attempts in the past 12 months, with downtime costs amplifying the financial hit of ransom demands. Cloud adoption reduces perimeter complexity yet shifts trust to vendors who must show HITRUST, FedRAMP or equivalent attestations. The 2024 ransomware breach at Philippine Health Insurance Corp. forced a multimillion-dollar clean-room rebuild, spotlighting the penalties for inadequate segmentation and backup hygiene.
*Our forecasts treat driver/restraint impacts as directional, not additive. The impact forecasts reflect baseline growth, mix effects, and variable interactions.
Segment Analysis
By Solution Type: Claims Platforms Drive Core Spending
Claims and administration platforms accounted for 37.27% of Technology Spending on Core Administration in Healthcare market share in 2024, reflecting their status as the industry’s digital spine. Modern suites support real-time edits, embedded analytics and automated coordination of benefits, positioning them as anchor tenants within composable ecosystems. Payment-integrity engines are scaling fastest at an 8.44% CAGR to 2030 as health plans prioritize fraud-waste-abuse detection, with Technology Spending on Core Administration in Healthcare market size for the sub-segment projected to jump from USD 5.2 billion in 2025 to USD 8.0 billion by 2030. Revenue-cycle management (RCM) remains a staple among provider organizations under margin pressure, while provider-network management tools gain relevance as value-based contracts demand transparent, tiered networks. HR and payroll modules, though niche, experience steady demand in integrated delivery networks struggling with workforce churn.
Vendor design is converging toward multifunction platforms: Cognizant’s TriZetto unifies claims processing, care management and advanced analytics to widen account stickiness. Standalone reporting suites decline as real-time dashboards embed directly within operational workbenches. As vertical integration deepens, holistic data views are turning solution type boundaries into configuration options rather than separate purchase decisions.


By Deployment Mode: Cloud Dominance Accelerates
Cloud deployments represented 63.25% of Technology Spending on Core Administration in Healthcare market size in 2024 and are forecast to advance at a 9.36% CAGR through 2030. Public-cloud elasticity appeals to mid-tier plans during open-enrollment spikes, while hyperscaler health-specific compliance frameworks ease CIO concerns about data residency. Hybrid remains popular among large integrated delivery networks that keep protected health information (PHI) on-premise yet burst analytics workloads to cloud. On-premise persists when sunk investments in data centers and tight latency requirements outweigh refresh incentives.
Oracle Health’s 2025 launch of an AI-infused, cloud-native EHR signposts vendor roadmaps that favor micro-services, containerization and DevSecOps pipelines. Accelerated depreciation allowances introduced in several jurisdictions further tilt total cost of ownership in favor of opex-heavy cloud subscriptions.
By Service Model: BPaaS Transforms Operational Strategies
BPaaS held 53.79% of Technology Spending on Core Administration in Healthcare market share in 2024, Internet-scale automation letting vendors amortize continuous upgrades across a multi-tenant base. Technology Spending on Core Administration in Healthcare market size for BPaaS is projected to rise from USD 19.8 billion in 2025 to USD 30.9 billion by 2030 at an 8.96% CAGR. Licensed software endures among enterprise payers that value code-base control, though even they are shifting non-differentiating work such as premium billing or encounter data submission to managed-service wrappers. Outsourcing partners differentiate through regulatory readiness playbooks and AI operations centers that tune models across client datasets for higher payer ROI.
UST HealthProof’s BPaaS deal with Zing Healthcare exemplifies the playbook: a greenfield payer taps an established platform, integrated operations and compliance support to launch nationally within six months. As service providers embed generative AI for call-center scripts or authorization summarization, cost-to-serve gaps between BPaaS and in-house models are widening.
By End User: TPAs Emerge as Growth Leaders
Payers retained 48.67% of Technology Spending on Core Administration in Healthcare market share in 2024, yet TPAs are the growth engine at a 9.12% CAGR. Consolidation among commercial insurers propels employer-sponsored plans toward specialized TPAs that promise flexibility and white-labeled digital front doors. AmeriHealth Administrators’ configurable TPA suite showcases demand for tailored network, benefits and analytics clusters.
Government agencies invest heavily as Medicaid rolls expand and Medicare Advantage penetration climbs; they favor audit-ready systems with hardened privacy controls. Provider organizations, historically laggards in administrative IT, are injecting RCM and prior-authorization automation to stem denials and speed cash collections.
Geography Analysis
North America contributed 44.78% Technology Spending on Core Administration in Healthcare market share in 2024, underpinned by USD 82.7 billion in administrative cost outlays and the stringent CMS interoperability mandate that codifies FHIR APIs as table stakes. U.S. payers drive the majority of spend through Medicare Advantage and Medicaid managed-care scaling, whereas Canada’s single-payer provinces channel funds toward health-information exchanges and population-health registries. Mexico’s private-insurance expansion feeds demand for cost-efficient claim hubs that can handle multicurrency billing and cross-border benefits.
Asia-Pacific is forecast to clock a 7.84% CAGR—the highest regional clip—boosted by China’s projected RMB 205 trillion healthcare outlay by 2030 and India’s Ayushman Bharat Digital Health Mission which digitizes provider and beneficiary identity layers. Japan and South Korea are early adopters of AI-driven payment integrity, while Australia’s My Health Record evolution accelerates demand for claims gateways that seamlessly ingest pharmacy and diagnostic data. Indonesia’s SATUSEHAT and Singapore’s National Digital Health Blueprint illustrate how smaller economies leapfrog legacy stacks via cloud-native administrative rails.
Europe maintains steady single-digit growth as aging demographics and DRG-based payment models spur efficiency investments. Germany’s Gematik interoperability requirements, the UK’s NHS continuation of FHIR-based Spine services, and France’s Ségur numérique funding stream guide procurement. The European Union’s GDPR overlay raises data-localization stakes, nudging CIOs toward regionally hosted clouds. The Middle East and Africa are ascending innovation benchmarks: Saudi Arabia’s Vision 2030 and UAE’s Malaffi interoperability push translate into rising core-administration budgets. South America, led by Brazil, seeks cloud-centric BPaaS to circumvent capital scarcity and currency volatility.

Competitive Landscape
Competition is moderately concentrated yet fiercely dynamic. Epic Systems added 176 hospital facilities in 2024, widening its EHR-adjacent administrative footprint, whereas Oracle Health shed 74 sites despite AI repositioning. Bain Capital’s pending HealthEdge acquisition and Cotiviti’s purchase of Edifecs create integrated stacks that blend claims processing, payment integrity, and interoperability in one contract vehicle.
Strategic plays trend toward ecosystem co-innovation: Cognizant collaborates with Microsoft and Google Cloud on large-language-model accelerators that plug into TriZetto workflows. UnitedHealth Group fields more than 1,000 AI use cases across Optum, exploiting vertical integration to compound payer and provider data synergies. White-space opportunities flourish in TPA services, niche Medicaid BPaaS and API-first micro-services that bolt onto incumbent CAPS. New entrants tout headless architectures that de-risk multimodule upgrades, challenging monoliths that historically relied on breadth rather than openness.
Vendor pose is also shaped by talent reuse and cost restructuring: Optum’s 2024 layoffs re-channeled experienced RCM engineers to AI product teams, evidencing an internal pivot from labor substitution to cognitive augmentation. SS&C Technologies and HealthEdge each unveiled generative AI roadmaps aimed at auto-drafting authorization letters and fine-tuning payment-integrity models.
Technology Spending On Core Administration In Healthcare Industry Leaders
Cognizant
UnitedHealth Group
Accenture
HealthEdge
Conduent
- *Disclaimer: Major Players sorted in no particular order

Recent Industry Developments
- March 2025: Epic Systems showcased 100+ new AI, genomics and interoperability features at HIMSS 2025, highlighting ambient-listening charts and natural-language queries.
- March 2025: Cotiviti closed its purchase of Edifecs, uniting payment integrity with FHIR-native data-management solutions for 200+ U.S. payers.
- February 2025: HealthEdge partnered with ECHO Health to embed consolidated payment processing within HealthRules Payer, streamlining remittances and provider payments.
- February 2025: HealthEdge and Unite Us integrated SMART-on-FHIR pathways that route 20 million members to social-care networks, advancing whole-person care.


Global Technology Spending On Core Administration In Healthcare Market Report Scope
| Claims & Administration Platforms |
| Revenue Cycle Management Systems |
| Payment Integrity & Fraud Detection |
| Provider Network Management |
| Care Management Systems |
| HR & Payroll Administration |
| Analytics & Reporting |
| On-Premise |
| Cloud |
| Hybrid |
| Licensed Software |
| BPaaS (Business-Process-as-a-Service) |
| Managed Services / Outsourcing |
| Payers – Health Plans |
| Payers – Third-Party Administrators |
| Providers – Hospitals & IDNs |
| Government Agencies |
| North America | United States |
| Canada | |
| Mexico | |
| Europe | Germany |
| United Kingdom | |
| France | |
| Italy | |
| Spain | |
| Rest of Europe | |
| Asia-Pacific | China |
| Japan | |
| India | |
| Australia | |
| South Korea | |
| Rest of Asia-Pacific | |
| Middle East and Africa | GCC |
| South Africa | |
| Rest of Middle East and Africa | |
| South America | Brazil |
| Argentina | |
| Rest of South America |
| By Solution Type | Claims & Administration Platforms | |
| Revenue Cycle Management Systems | ||
| Payment Integrity & Fraud Detection | ||
| Provider Network Management | ||
| Care Management Systems | ||
| HR & Payroll Administration | ||
| Analytics & Reporting | ||
| By Deployment Mode | On-Premise | |
| Cloud | ||
| Hybrid | ||
| By Service Model | Licensed Software | |
| BPaaS (Business-Process-as-a-Service) | ||
| Managed Services / Outsourcing | ||
| By End User | Payers – Health Plans | |
| Payers – Third-Party Administrators | ||
| Providers – Hospitals & IDNs | ||
| Government Agencies | ||
| By Geography | North America | United States |
| Canada | ||
| Mexico | ||
| Europe | Germany | |
| United Kingdom | ||
| France | ||
| Italy | ||
| Spain | ||
| Rest of Europe | ||
| Asia-Pacific | China | |
| Japan | ||
| India | ||
| Australia | ||
| South Korea | ||
| Rest of Asia-Pacific | ||
| Middle East and Africa | GCC | |
| South Africa | ||
| Rest of Middle East and Africa | ||
| South America | Brazil | |
| Argentina | ||
| Rest of South America | ||


Key Questions Answered in the Report
What is the forecast growth rate for technology spending on healthcare core administration?
Spending is set to rise from USD 36.72 billion in 2025 to USD 48.14 billion by 2030, representing a 5.57% CAGR.
Which solution category currently commands the largest share of spending?
Claims and administration platforms hold 37.27% of total outlays, reflecting their role as the digital backbone of payer operations.
Why is Asia-Pacific expected to outpace other regions?
National digital-health programs in China and India, coupled with rapid private-insurance uptake, fuel a 7.84% CAGR—higher than any other region.
How are mid-tier health plans controlling technology costs?
Many are adopting Business Process-as-a-Service models that convert fixed IT expenses into variable operating charges while tapping vendor automation.
What regulatory deadline is shaping near-term investment priorities in the United States?
Payers must deploy FHIR-based APIs for interoperability by January 2027 under the CMS Interoperability and Prior Authorization Final Rule.
Page last updated on:


