Tech-Savvy Hotel Chains Market Size and Share
Market Overview
| Study Period | 2021 - 2031 |
|---|---|
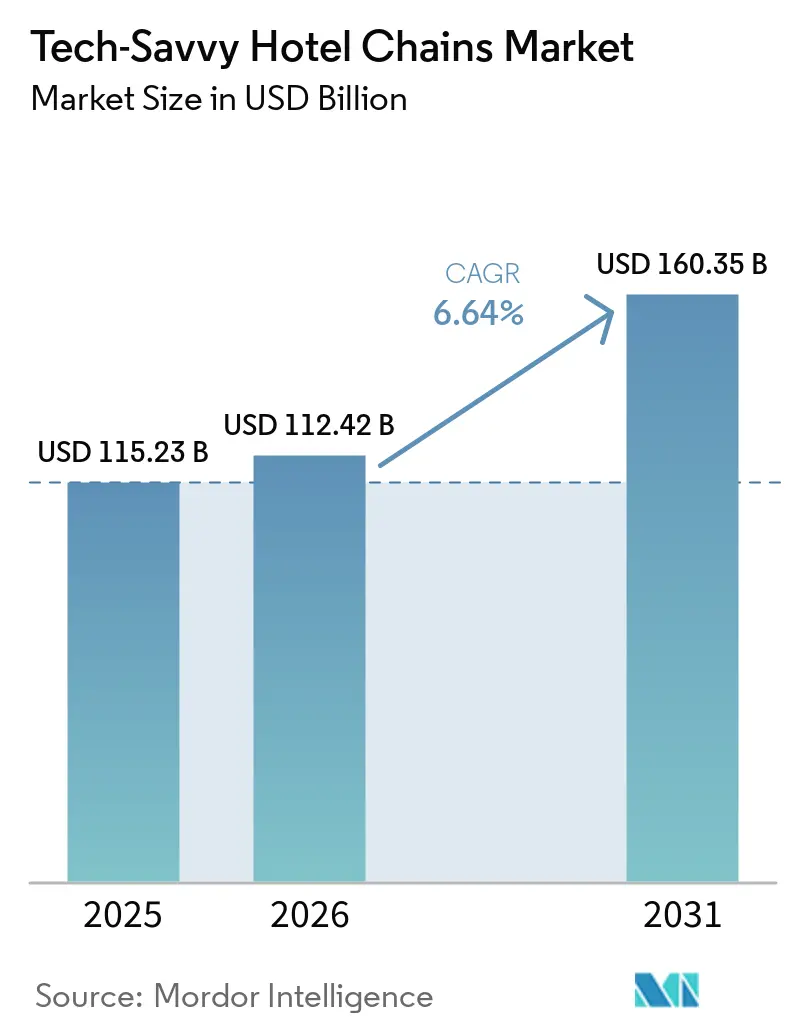
| Market Size (2026) | USD 112.42 Billion |
| Market Size (2031) | USD 160.35 Billion |
| Growth Rate (2026 - 2031) | 6.64% CAGR |
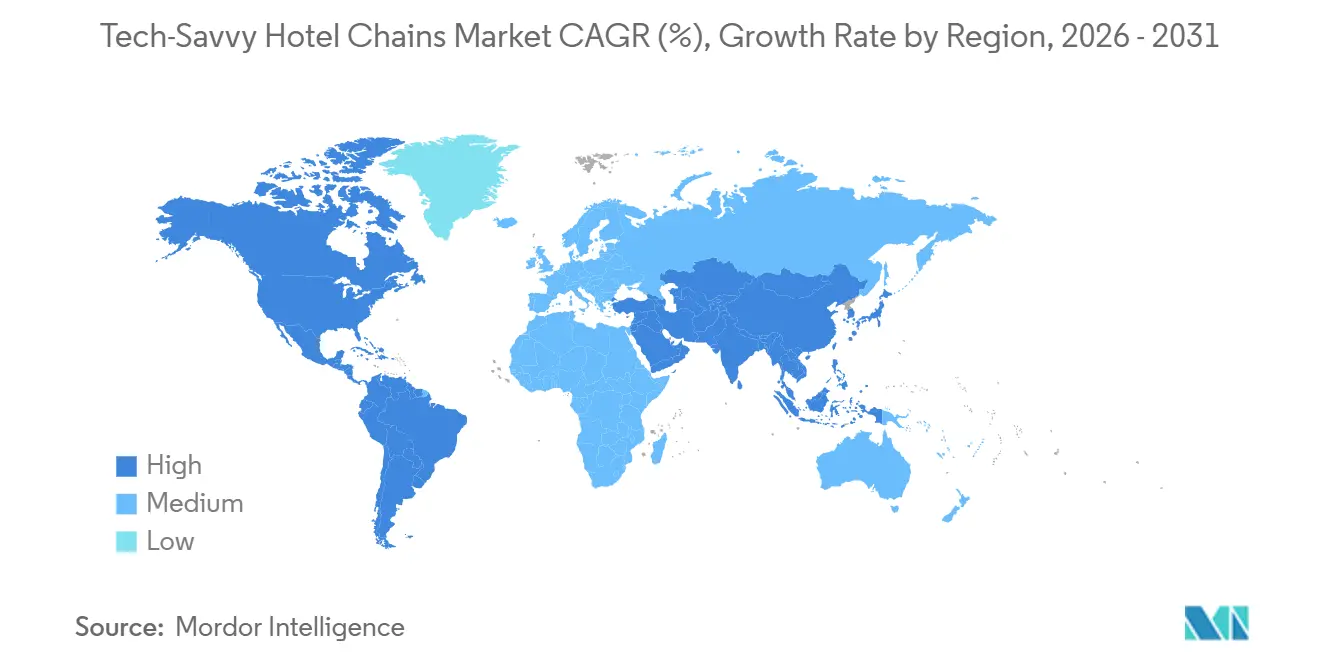
| Fastest Growing Market | Asia Pacific |
| Largest Market | North America |
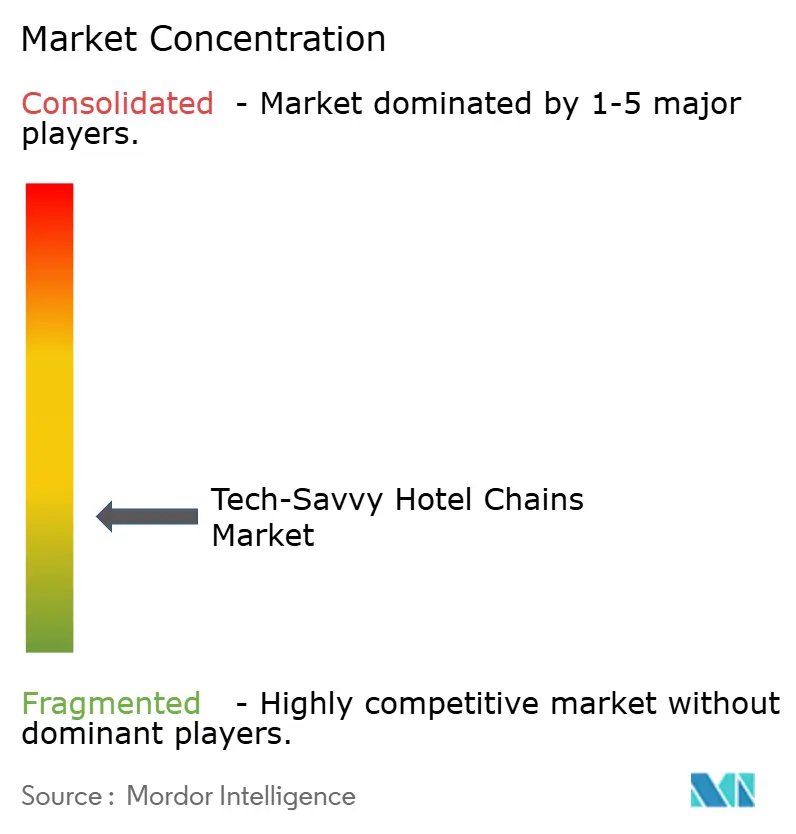
| Market Concentration | Low |
Major Players *Disclaimer: Major Players sorted in no particular order Image © Mordor Intelligence. Reuse requires attribution under CC BY 4.0. | |
Tech-Savvy Hotel Chains Market Analysis by Mordor Intelligence
The Tech‑Savvy Chain Hotel Market was valued at USD 115.23 billion in 2025 and is estimated to grow from USD 122.42 billion in 2026 to reach USD 169.51 billion by 2031, at a CAGR of 6.64% during the forecast period (2026–2031). This growth reflects a transformation in hotel operations, driven by mobile-first guest experiences, cloud-based property systems, and AI-powered workflows becoming standard practices. Hotels upgrading technology are leveraging automation, digital keys, unified guest data, and analytics to boost ancillary revenue while reducing inefficiencies. The shift to API-first platforms integrating POS, PMS, CRS, CRM, and messaging layers supports personalization and rapid feature deployment, with operational changes including reduced manual processes, improved data governance, and resilience through vendor-managed cloud infrastructure.
Key Report Takeaways
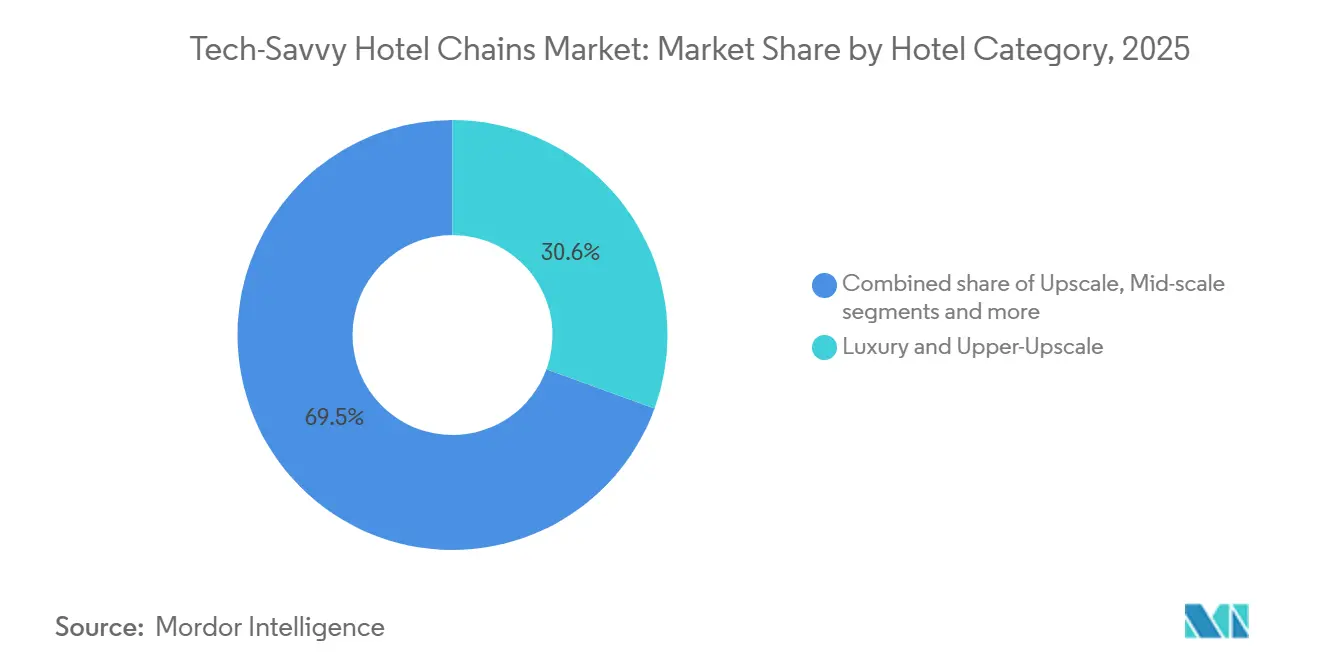
- By category, luxury & upper‑upscale hotels held the largest share of the tech‑savvy chain hotel market in 2025 at 30.55%, while mid‑scale hotels are projected to post the fastest growth at a 7.21% CAGR through 2031.
- By end user, business travelers led with 55.23% of the tech-savvy chain hotel market share in 2025, and leisure travelers are set to expand at a 6.76% CAGR through 2031.
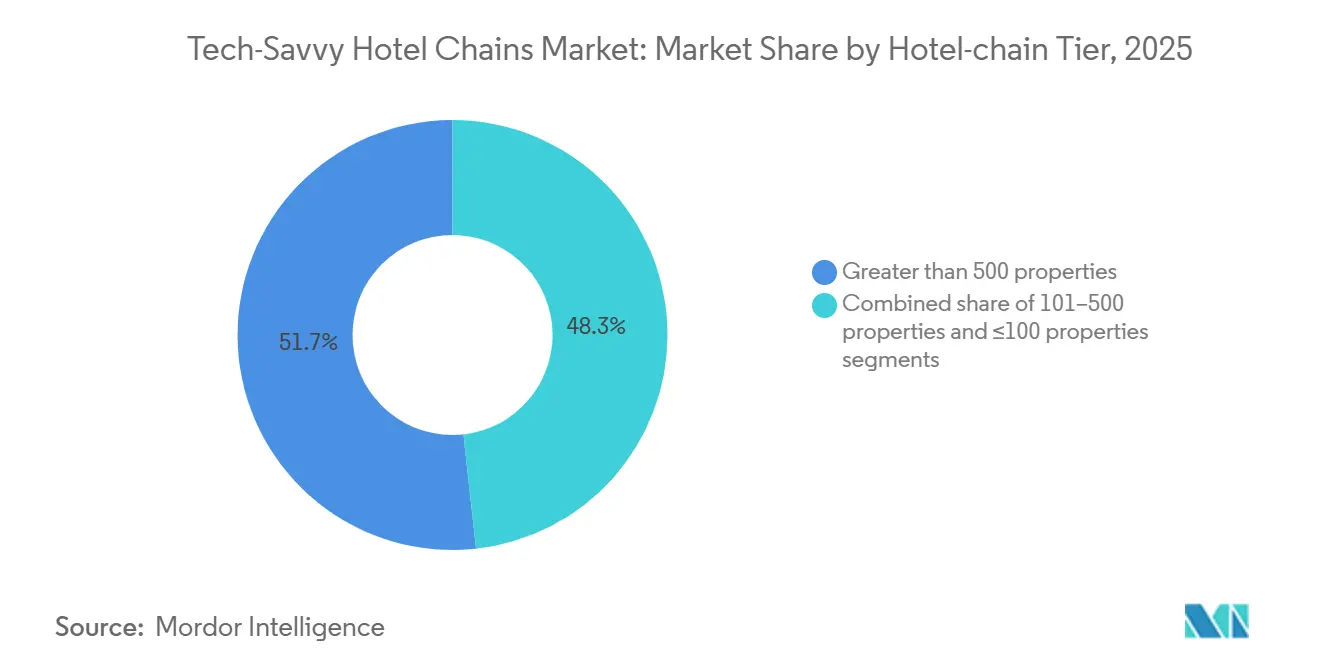
- By hotel-chain type, greater than 500 properties accounted for 51.75% of the tech-savvy chain hotel market share in 2025, while less than 100 properties recorded the highest forecast CAGR at 6.91% through 2031.
- By geographic region, North America captured 34.25% of the tech-savvy chain hotel market, and Asia Pacific is projected to grow the fastest with a 8.39% CAGR through 2031.
Note: Market size and forecast figures in this report are generated using Mordor Intelligence’s proprietary estimation framework, updated with the latest available data and insights as of January 2026.
Global Tech-Savvy Hotel Chains Market Trends and Insights
Drivers Impact Analysis*
| Drivers | (~) % Impact on CAGR Forecast | Geographic Relevance | Impact Timeline |
|---|---|---|---|
| Mobile-first guest journeys enabling seamless digital check-in, check-out, and key access | +3.8% | Global, with early gains in North America, Western Europe, and select Asia-Pacific urban centers | Medium term (2-4 years) |
| Adoption of cloud-based PMS and fully integrated hospitality technology ecosystems | +4.1% | Global, highest penetration in Northern Europe, rising adoption in Southern Europe and Middle East | Medium term (2-4 years) |
| AI- and analytics-driven personalization across guest engagement and service delivery | +3.2% | North America, European Union, China, rapid adoption by luxury and upper-upscale chains | Medium term (2-4 years) |
| Automation-led cost optimization via robotics and IoT-enabled energy management | +2.9% | Global with notable deployment in Saudi Arabia under Vision 2030 and European sustainability mandates | Long term (≥ 4 years) |
| Use of digital twins to enhance real-time operational efficiency and asset performance | +1.2% | Pilot deployments in Middle East, luxury portfolios in Europe, select United States resorts | Long term (≥ 4 years) |
| Deployment of ESG-linked AI tools supporting sustainability tracking and green financing access | +1.5% | European Union under CSRD, North America corporate travel mandates, Saudi Arabia, India | Medium term (2-4 years) |
| Source: Mordor Intelligence | |||
Mobile-First Guest Journeys Enabling Seamless Digital Check-In, Check-Out, and Key Access
Mobile-first guest experiences have become a standard expectation as hotels adopt digital keys, app-based messaging, and self-service options to streamline arrival and departure. Wallet-based digital keys reduce wait times, simplify room access, and enhance security and operational auditability[1]Mews Press Room, “Mews Launches Digital Wallet Hotel Key Integration,” Mews, mews.com. Mews introduced native Apple and Google Wallet room keys without third-party middleware, with Hey Lou Hotels showcasing seamless walk-in experiences that eliminate queues and plastic cards. Resorts World Las Vegas demonstrated how digital keys integrate into systems, enabling automatic room updates and functioning on iPhone power reserve for resilience. Mobile app ecosystems drive ancillary revenue through in-room dining, spa bookings, and personalized offers, while platforms like INTELITY centralize mobile check-in, keys, and communications, reducing front desk workload and improving service. Privacy-by-design remains essential with clear notices, opt-in consent, and encrypted data flows, ensuring compliance and trust.
Adoption of Cloud-Based PMS and Fully Integrated Hospitality Technology Ecosystems
Cloud-based Property Management Systems (PMS) are gaining traction as hotels transition from on-premise servers to managed, API-first platforms that standardize data and streamline integrations across reservations, POS, CRM, and revenue systems. Rapid transformation is feasible with vendor-managed services, as seen in Motel One’s migration of over 100 properties across 13 countries to Oracle OPERA Cloud in four months, averaging 14 go-lives per week[2]Oracle Newsroom, “Motel One Innovates Operations Using Oracle Cloud,” Oracle, oracle.com. Integrated platforms enhance analytics, forecasting, staff scheduling, and service recovery while reducing downtime risks and ownership costs by eliminating server maintenance and patching. Unified data layers simplify feature deployment, support AI workflows, and ensure compliance through stronger governance, disaster recovery SLAs, and vendor certifications across regions.
AI- and Analytics-Driven Personalization Across Guest Engagement and Service Delivery
Personalization supported by unified guest data is shifting from isolated campaigns to continuous orchestration throughout the guest stay lifecycle. Hotel groups are investing in global data and AI platforms to integrate guest identities, transactions, and preferences, enabling detailed profiling and real-time recommendations during booking, on-property services, and post-stay engagement. Minor Hotels, in partnership with Google Cloud BigQuery and Vertex AI, is deploying a platform to unify guest data and automate service and marketing processes, with full implementation planned by 2026. Improved data foundations and AI-driven tools enhance efficiency, manage requests, and boost revenue through targeted offers, while mobile-native solutions reduce service delays and improve guest satisfaction.
Automation-Led Cost Optimization via Robotics and IoT-Enabled Energy Management
Hotels are leveraging IoT, AI analytics, and building automation to reduce energy consumption, lower maintenance costs, and enhance comfort while extending asset lifespan. Energy analytics solutions improve efficiency through predictive load management, occupancy-based HVAC control, and weather-driven pre-cooling strategies. Automated monitoring supports maintenance by identifying abnormal equipment behavior, initiating work orders, and tracking energy recovery post-repair. Robotics for delivery and cleaning ensures consistent service times, enhances guest satisfaction, and allows staff to focus on higher-value tasks. Digital twins simulate building operations and occupancy scenarios, enabling performance testing and real-time improvements. Greenfield projects in markets like Saudi Arabia integrate AI and digital twins to optimize interoperability among building systems and robotics.
Restraints Impact Analysis*
| Restraints | (~) % Impact on CAGR Forecast | Geographic Relevance | Impact Timeline |
|---|---|---|---|
| Elevated cybersecurity risks and increasing data privacy compliance requirements | -2.1% | Global, with acute enforcement in European Union under GDPR and growing United States state-level privacy laws | Short term (≤ 2 years) |
| High capital investment and retrofit costs for upgrading legacy hotel infrastructure | -1.8% | Global, with greater strain on independent and mid-scale operators in mature markets | Medium term (2-4 years) |
| Vendor lock-in risks and lack of interoperability across fragmented technology systems | -1.3% | Global, with highest friction in hybrid on-premise and cloud environments | Medium term (2-4 years) |
| Shortage of skilled workforce to manage and operate advanced digital solutions | -0.9% | North America, Western Europe, and select Asia-Pacific urban centers | Medium term (2-4 years) |
| Source: Mordor Intelligence | |||
Elevated Cybersecurity Risks and Increasing Data Privacy Compliance Requirements
Cyber risk is a significant concern for hotel chains, which manage payments, identity verification, loyalty data, and digital touchpoints, increasing vulnerability to attacks. A breach at Pyramid Global Hospitality exposed sensitive personal and financial information, highlighting the need for monitoring, privileged access control, and rapid response. Compliance adds complexity, with GDPR requiring breach notifications, vendor agreements, and data processing records. Hotels now adopt privacy-by-design, encryption, and prioritize vendors with security certifications, disaster recovery plans, and data residency policies. Employee training and culture-building are critical as human error drives incidents, while multifactor authentication, endpoint protection, and network segmentation help minimize breach impacts.
High Capital Investment and Retrofit Costs for Upgrading Legacy Hotel Infrastructure
Replacing legacy systems with cloud-native platforms requires significant investment and change management, challenging for independent and mid-scale chains with limited budgets. ROI improves when process redesign integrates with technology, as centralized data and cloud automation reduce manual workloads, downtime, and maintenance costs. Upgrading related enterprise systems lowers infrastructure expenses and enhances scalability for new openings. Hotels mitigate risks through phased cutovers, pilot sites for testing integrations, and vendor support to shorten migration timelines while ensuring continuity. Operators increasingly adopt shared guest profiles and payment tokenization to streamline integrations and accelerate front-end services. IoT and analytics reduce utility costs, support green certifications, and improve access to sustainability-linked financing aligned with ESG goals.
*Our forecasts treat driver/restraint impacts as directional, not additive. The impact forecasts reflect baseline growth, mix effects, and variable interactions.
Segment Analysis
By Hotel Category: Mid-Scale Properties Accelerate Adoption to Compress Conversion Cycles
Luxury and upper-upscale properties are expected to hold a 30.55% share of the tech-savvy chain hotel market size in 2025, driven by early adoption of AI concierges, mobile-first guest journeys, and predictive service models that enhance premium experiences. Central platforms distribute innovation costs across hotels, enabling faster deployment of features like wallet-based digital keys and unified commerce data for targeted offers. Investments in building automation and ESG reporting help meet sustainability expectations for both customers and corporate travel. Integrated POS and PMS systems are increasingly used to link dining, spa, and activity transactions with loyalty programs, supporting curated guest experiences[3]Shiji Group Press, “Shiji Expands Mobility Across the Entire Guest Journey,” Shiji Group, shijigroup.com. These platforms also improve service recovery and personalization by equipping staff with complete guest context during escalations from AI agents to human team members, maintaining the quality of premium service.
The mid-scale segment, growing at a projected CAGR of 7.21% through 2031, benefits from cloud-native technology stacks that reduce conversion cycles and standardize digital capabilities across properties. Operators prioritize mobile check-in, keyless entry, and unified messaging to streamline arrivals and boost cross-sell conversions. Scalable cloud PMS solutions with pre-integrated interfaces enhance forecasting and housekeeping efficiency. Automation in energy management and maintenance alerts reduces costs and allows staff to focus on guest interactions that drive reviews and repeat bookings.


By End-User: Leisure Travelers Driving Mobile-First Booking and Experience Demand
Business travelers held a 55.23% share in 2025, driven by the resumption of corporate travel and the focus on loyalty integrations, policy-compliant bookings, and seamless check-ins for time-sensitive stays in tech-savvy chain hotels. Enterprises demand partner hotels provide digital receipts, itemized folios, and centralized carbon metrics for compliance reporting, supported by integrated systems and robust data pipelines. Corporate programs emphasize security and privacy in guest-facing apps, leading hotel groups to enhance identity verification and access controls to protect sensitive data. Integration between PMS, CRM, and loyalty systems allows hotels to pre-assign rooms near meeting spaces or fitness facilities based on preferences, while smart controls adjust in-room settings for frequent travelers. These features improve traveler satisfaction and reduce service costs for predictable requests, supporting operational efficiency.
Leisure travelers are growing at a 6.91% CAGR from 2026 to 2031, driven by direct mobile bookings, in-app experiences, and sustainability transparency influencing hotel choices. Loyalty apps and digital compendiums help discover amenities and local activities, while in-app offers simplify purchases with saved payment credentials and personalized recommendations. Visual tools like digital twins boost booking confidence and premium room selection by previewing room locations and views[4]Hotelverse Editorial Team, “Digital Twins,” Hotelverse, hotelverse.tech. Hotels highlight verified energy and water metrics and green certifications through branded channels and OTAs, rewarding properties investing in sustainability. Leisure travelers increasingly prefer properties offering mobile-native convenience, transparent value, and personalized experiences throughout their stay.
By Hotel-Chain Tier: Boutique Operators Leverage Cloud Platforms to Deploy Enterprise-Grade AI
Operators with more than 500 properties accounted for 51.75% of the 2025 market value, benefiting from scale advantages in platform investments, vendor partnerships, and global loyalty programs within the tech-savvy chain hotel market. These operators consolidate core systems on cloud-native platforms and standardize data models that enable AI-driven solutions for sales, service, and operations, reducing the time required for chainwide implementation. Centralized procurement and integration frameworks lower costs, simplify compliance across regulatory environments, and ensure consistent service quality. Advancements in mobile-first customer journeys and unified guest data provide seamless experiences across brands and price tiers, setting reference standards for smaller operators through vendor solutions.
Chains with fewer than 100 properties are growing fastest, with a CAGR of 6.91% during 2026-2031, as cloud platforms reduce barriers to enterprise-grade technology. Boutique operators leverage cloud-based property management systems, integrated guest messaging, and mobile key solutions to deliver premium experiences without custom development, leveling the playing field in service and personalization. Vendor partnerships offer pre-built integrations for payments, distribution, and analytics, enabling teams to focus on design and storytelling. Event-focused digital twins and remote venue visualization tools shorten sales cycles for weddings and MICE, diversifying revenue streams. These strategies demonstrate that agility and clear positioning, supported by cloud-based tools, allow smaller operators to compete effectively with larger competitors.
Geography Analysis
North America held 34.25% of the Tech-Savvy Hotel Chains market share due to early adoption of cloud Property Management Systems (PMS), mobile-first customer journeys, and loyalty-focused personalization programs. U.S. operators are enhancing arrival experiences and reducing front desk congestion through digital keys and unified messaging systems, aligning with app-based service preferences. Cloud migrations ensure consistent analytics and uptime across properties, enabling real-time performance management and service recovery. Security efforts focus on identity management and incident readiness across applications and partner systems, addressing the sector's broad attack surface. Recent breaches underscore the need for vetted vendors and strong data governance. Canada and Mexico contribute through independent hotel modernization and mobile-first strategies, meeting traveler expectations for digital convenience and responsive services.
Europe shows varied adoption rates, with Northern markets advancing in cloud PMS and operational analytics, while Southern markets face challenges balancing upgrades with local ownership constraints. Germany's Kimpton Hotel Frankfurt integrates advanced building automation, including HVAC, lighting, and accessibility features like vibrating pillows for deaf guests, aligning with sustainability and safety standards. Spain leverages digital twins for energy and comfort optimization in hotels, supported by recovery funding and real-world validation, showcasing scalable improvements in cost efficiency and service quality. Europe's regulatory framework emphasizes privacy-by-design in applications and data platforms, enhancing resilience and trust in loyalty programs and mobile-first services. Vendor ecosystems expand to accommodate regional payment preferences and language support, catering to cross-border travel flows and diverse property footprints.
Asia Pacific is the fastest-growing market for Tech-Savvy Hotel Chains, with a projected CAGR of 8.39% through 2031. Giga-projects, digital-native consumer behavior, and rapid new-build activity drive leapfrog adoption of advanced technologies. New projects integrate robotics, elevator systems, and building automation into agentic digital twins, optimizing resource management and reducing congestion. India's enterprise upgrades demonstrate how cloud-enabled scalability reduces infrastructure costs and accelerates rollout for expanding hotel portfolios. Southeast Asia adopts mobile-first engagement strategies from inception, aligning with smartphone-centric travel behaviors and bypassing legacy systems. Australia, South Korea, and Japan integrate with global vendor ecosystems to support cross-channel distribution and unified guest data, facilitating seamless travel across key regional corridors.

Competitive Landscape
The Tech-Savvy Hotel Chains Market demonstrates low-to-moderate concentration at the top, driven by vendor consolidation and independent properties fostering localized innovation. Large hotel groups utilize centralized cloud systems and loyalty-driven data platforms to scale AI and mobile-first services, strengthening their global brand identity. Vendor-side consolidation integrates revenue optimization with demand generation and traveler engagement, as seen in RateGain's acquisition of Sojern. Similarly, Canary Technologies' acquisition of OpenKey’s assets accelerates keyless entry adoption for hotels with diverse lock models. These developments emphasize integrated platforms that streamline procurement and enhance functionality. Market priorities focus on mobility, automation, and ESG-linked operational improvements, with vendors and hotel chains aligning product roadmaps accordingly. Shiji’s Move framework extends mobility across property management systems (PMS), point-of-sale (POS) systems, and guest experiences, enabling staff to assist guests and conduct transactions seamlessly. Oracle’s enterprise-grade migrations ensure consistent workflows, analytics, and resilience for multi-country portfolios, showcasing the value of cloud-based PMS. Loyalty and messaging ecosystems integrate with these systems to boost direct bookings and upselling opportunities by centralizing guest identity and preference data. Enhanced out-of-the-box integrations improve time-to-value, allowing hotel teams to prioritize service quality over complex customizations.
Boutique and lifestyle operators benefit from enterprise-grade capabilities without extensive internal engineering, reducing launch timelines and enabling sharper brand differentiation. Wallet-based keys and frictionless check-in processes deliver a modern arrival experience at low incremental costs, enhancing guest satisfaction. AI-driven event and sales tools, leveraging digital twins, improve venue conversion through enhanced visualization, creating additional revenue streams. Sustainability platforms simplify reporting and facilitate access to green financing, aligning cost control with corporate and leisure segment demands.Vendor ecosystems and cloud-native architectures lower innovation barriers, supporting scalability for global brands and agility for independent operators. This fosters a market environment that balances technological advancements with operational efficiency.
Tech-Savvy Hotel Chains Industry Leaders
Marriott International
Hilton Worldwide
Accor Hotels
InterContinental Hotels Group (IHG)
Jin Jiang International
- *Disclaimer: Major Players sorted in no particular order

Recent Industry Developments
- February 2026: Canary Technologies acquired OpenKey's mobile key assets to expand Canary's existing Mobile Key platform, creating the most advanced solution for digital hotel room access on the market by broadening coverage to additional door lock models and manufacturers. The integration enhances Canary's AI-powered Guest Management System serving over 20,000 hotels in 100+ countries, including Marriott International, Four Seasons, Choice Hotels, Wyndham Hotels & Resorts, BWH Hotels, and Intercontinental Hotel Group, accelerating industry adoption of mobile-first guest engagement and keyless hotel stays.
- December 2025: Duve raised USD 60 million in Series B funding led by Susquehanna Growth Equity, bringing total capital to USD 85 million, to scale its unified AI-driven hotel guest experience platform globally Hotel Technology News, 2025. The platform, managing over one million guest journeys monthly for over 1,000 brands in 70+ countries including Accor, OYO, and Leonardo Hotels, reduced average ticket resolution from 30 minutes to one minute via AI agents.
- November 2025: RateGain Travel Technologies completed its acquisition of Sojern, merging RateGain's AI-powered SaaS solutions for revenue optimization and distribution with Sojern's demand generation and traveler engagement capabilities.
- August 2025: Mews launched Digital Wallet Hotel Key integration, becoming the first property management system to offer native wallet-based room access without third-party apps or middleware via collaboration with Vingcard.


Global Tech-Savvy Hotel Chains Market Report Scope
The Tech-Savvy Hotel Chains Market analyzes hotel groups utilizing digital technologies such as mobile-first guest experiences, cloud-based property management systems (PMS), AI-driven personalization, automation for operational efficiency, and advanced energy management. It examines market size, growth projections, segmentation by hotel category, end-user type, hotel chain tier, and region, along with key drivers, restraints, regulatory frameworks, supply chain dynamics, and emerging technologies shaping competitive differentiation. The study includes market concentration, strategic initiatives, share analysis, detailed company profiles of major global hotel chains, and Porter’s Five Forces framework. It identifies future opportunities and untapped areas influencing growth from 2026 to 2031, with all values reported in USD billion.
| Luxury & Upper-Upscale |
| Upscale |
| Mid-scale |
| Economy & Budget |
| Business Travelers |
| Leisure Travelers |
| Greater Than 500 properties |
| 101 - 500 properties |
| Less Than 100 properties |
| North America | Canada |
| United States | |
| Mexico | |
| South America | Brazil |
| Peru | |
| Chile | |
| Argentina | |
| Rest of South America | |
| Europe | United Kingdom |
| Germany | |
| France | |
| Spain | |
| Italy | |
| BENELUX (Belgium, Netherlands, Luxembourg) | |
| NORDICS (Denmark, Finland, Iceland, Norway, Sweden) | |
| Rest of Europe | |
| Asia-Pacific | India |
| China | |
| Japan | |
| Australia | |
| South Korea | |
| South-East Asia (Singapore, Malaysia, Thailand, Indonesia, Vietnam, Philippines) | |
| Rest of Asia-Pacific | |
| Middle East & Africa | United Arab Emirates |
| Saudi Arabia | |
| South Africa | |
| Nigeria | |
| Rest of Middle East & Africa |
| By Hotel Category | Luxury & Upper-Upscale | |
| Upscale | ||
| Mid-scale | ||
| Economy & Budget | ||
| By End-User | Business Travelers | |
| Leisure Travelers | ||
| By Hotel-chain Tier | Greater Than 500 properties | |
| 101 - 500 properties | ||
| Less Than 100 properties | ||
| By Region | North America | Canada |
| United States | ||
| Mexico | ||
| South America | Brazil | |
| Peru | ||
| Chile | ||
| Argentina | ||
| Rest of South America | ||
| Europe | United Kingdom | |
| Germany | ||
| France | ||
| Spain | ||
| Italy | ||
| BENELUX (Belgium, Netherlands, Luxembourg) | ||
| NORDICS (Denmark, Finland, Iceland, Norway, Sweden) | ||
| Rest of Europe | ||
| Asia-Pacific | India | |
| China | ||
| Japan | ||
| Australia | ||
| South Korea | ||
| South-East Asia (Singapore, Malaysia, Thailand, Indonesia, Vietnam, Philippines) | ||
| Rest of Asia-Pacific | ||
| Middle East & Africa | United Arab Emirates | |
| Saudi Arabia | ||
| South Africa | ||
| Nigeria | ||
| Rest of Middle East & Africa | ||


Key Questions Answered in the Report
What is the current size and growth outlook of the tech savvy chain hotel market?
The tech savvy chain hotel market is USD 122.42 billion in 2026 and is forecast to reach USD 169.51 billion by 2031 at a 6.64% CAGR.
Which segments lead and grow fastest within the Tech-Savvy Hotel Chains space?
Luxury & Upper-Upscale led with 30.55% share in 2025, while Mid-scale is the fastest growing at 7.21% CAGR over 2026-2031.
Which regions dominate and which expand fastest in tech-savvy hotel adoption?
North America held 34.25% share in 2025, and Asia-Pacific is the fastest growing with a 8.39% CAGR through 2031.
How are hotels improving guest experience with mobile and AI?
Hotels deploy wallet-based digital keys, unified messaging, and agentic automation to cut arrival friction and personalize offers across the stay journey.
What modernization steps reduce operational costs most effectively?
Cloud PMS migrations standardize workflows and analytics across portfolios, while IoT and AI analytics cut energy waste and extend equipment life.
How are hotels addressing cybersecurity and privacy risks?
Operators strengthen access controls, encrypt data, and formalize vendor agreements to meet GDPR and other privacy requirements while improving incident readiness.
Page last updated on:


