Market Overview
| Study Period | 2020 - 2031 |
|---|---|
| Forecast Data Period | 2026 - 2031 |
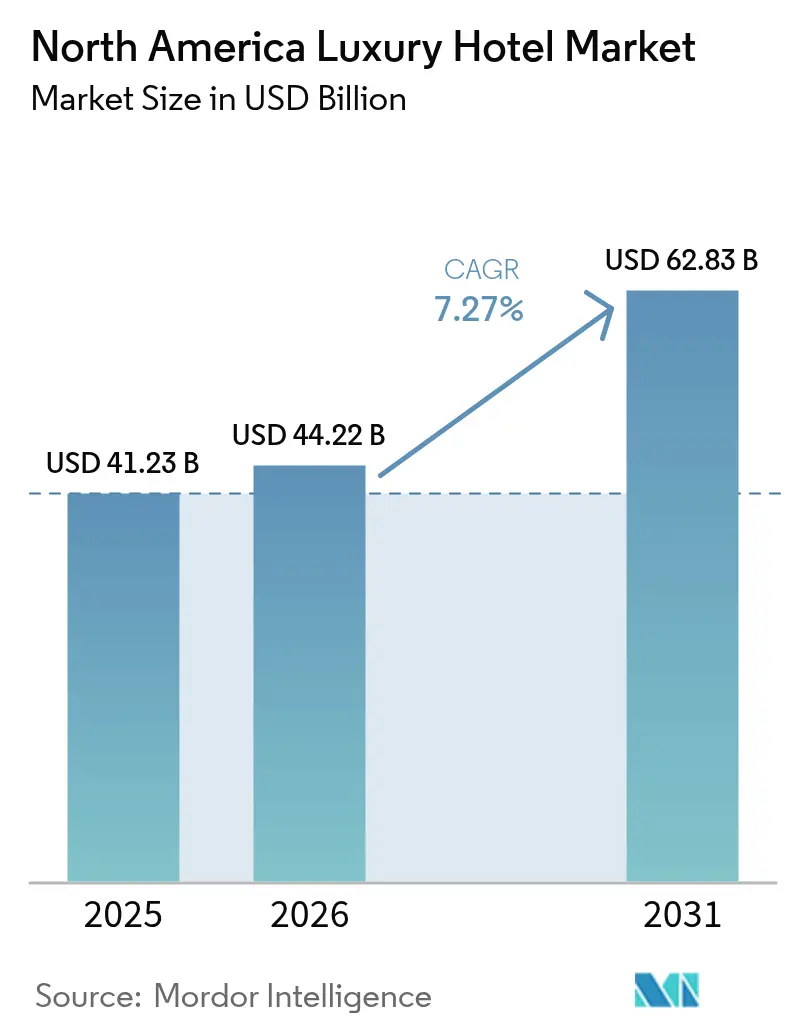
| Base Year Market Size (2025) | USD 41.23 Billion |
| Market Size (2026) | USD 44.22 Billion |
| Market Size (2031) | USD 62.83 Billion |
| Growth Rate (2026 - 2031) | 7.27% CAGR |
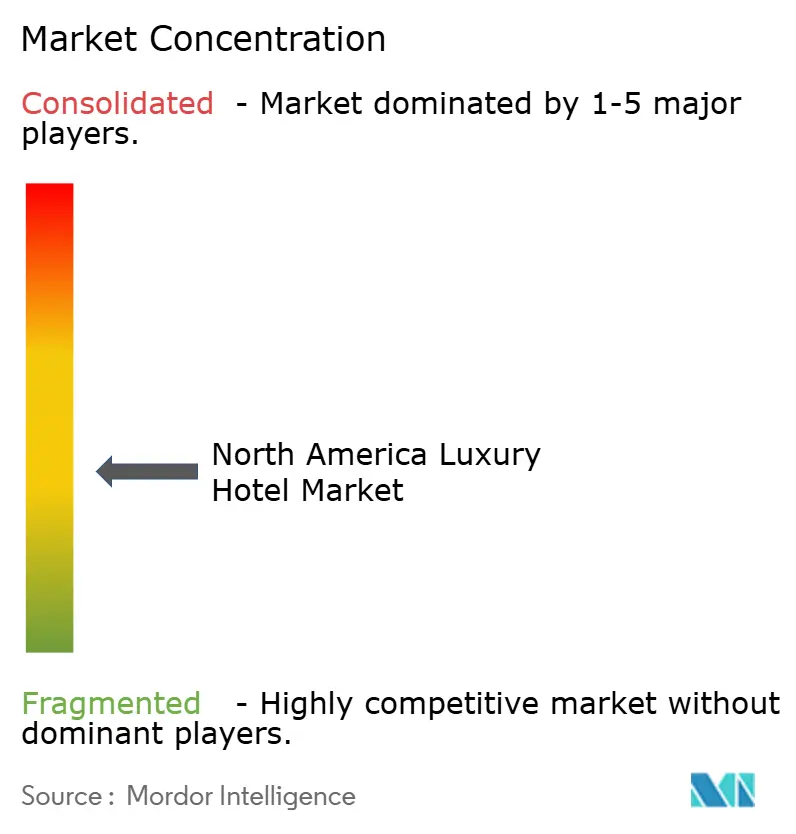
| Market Concentration | Medium |
Major Players *Disclaimer: Major Players sorted in no particular order Image © Mordor Intelligence. Reuse requires attribution under CC BY 4.0. | |
North America Luxury Hotel Market Analysis by Mordor Intelligence
The North America luxury hotels market size in 2026 is estimated at USD 44.22 billion, growing from 2025 value of USD 41.23 billion with 2031 projections showing USD 62.83 billion, growing at 7.27% CAGR over 2026-2031. Demand rebounds in every gateway city as affluent travelers rediscover long-haul trips, and resorts capture spending tied to wellness retreats. Operators accelerate pipeline additions, with Marriott alone signing 61 new luxury deals in 2024, while adaptive-reuse conversions bring new supply online at lower capital intensity. Government spending shows the region’s total international visitor exports rising 19% year-over-year in 2024, a figure that exceeded overall services-export growth by more than 7 percentage points, reaffirming luxury hospitality’s out-sized contribution to trade surplus generation [1]Source: U.S. Department of Commerce, “International Trade in Services 2024,” commerce.gov. . Franchise reliance deepens because asset-light growth supports speed to market, yet soft-brand collections gain favor by pairing global distribution with preserved property character. Technology adoption, especially AI-driven revenue management, nudges average daily rate (ADR) higher and cushions margin pressure created by development-cost inflation and short-term rental competition.
Key Report Takeaways
- By service type, business hotels led with 42.02% revenue share of the North America luxury hotels market in 2025; resorts are projected to post the fastest 7.45% CAGR through 2031.
- By ownership model, the franchise format captured 66.01% of the North America luxury hotels market share in 2025, whereas soft-brand collections are set to expand at an 7.93% CAGR to 2031.
- By booking channel, online travel agencies (OTAs) controlled 42.88% of bookings in 2025, but direct digital channels are forecast to grow at 7.32% CAGR in the North America luxury hotels market.
- By customer segment, leisure travelers generated 61.54% of 2025 room demand, while bleisure demand is expected to rise at an 8.08% CAGR through 2031 in the North America luxury hotels market.
- By geography, the United States accounted for 79.75% share of the North America luxury hotels market size in 2025; Mexico will record the highest 7.86% CAGR to 2031.
- The North America luxury hotels market exhibits moderate concentration with the top 5 operators including Marriott International, Hilton Worldwide, Hyatt Hotels Corporation, Four Seasons Hotels & Resorts, and Accor SA, holding major market shares.
Note: Market size and forecast figures in this report are generated using Mordor Intelligence’s proprietary estimation framework, updated with the latest available data and insights as of 2026.
North America Luxury Hotel Market Trends and Insights
Drivers Impact Analysis*
| Driver | (~) % Impact on CAGR Forecast | Geographic Relevance | Impact Timeline |
|---|---|---|---|
| Post-pandemic rebound in inbound and domestic high-net-worth travel | +1.8% | North America, with strongest impact in US gateway cities | Medium term (2-4 years) |
| Record luxury-brand pipeline expansion by global chains | +1.5% | US and Mexico primary markets, Canada secondary | Long term (≥ 4 years) |
| Rise of soft-brand collections empowering independent luxury assets | +1.2% | US and Canada urban markets, Mexico emerging | Medium term (2-4 years) |
| Ultra-affluent demand for immersive "bleisure" & wellness retreats | +1.0% | Global, with concentration in US leisure destinations | Short term (≤ 2 years) |
| Adaptive reuse of vacant Class-A offices into urban luxury hotels | +0.8% | US metropolitan areas, Toronto and Vancouver | Long term (≥ 4 years) |
| AI-enabled total revenue management boosting ADR lift | +0.9% | North America technology-forward markets | Short term (≤ 2 years) |
| Source: Mordor Intelligence | |||
Post-pandemic rebound in inbound and domestic high-net-worth travel
Luxury RevPAR climbed 12% year-on-year in January 2025 as affluent guests resumed international itineraries and shifted budgets from goods to experiences. The addressable affluent base widens because individuals with USD 100,000–1 million in net worth now constitute 35% of luxury demand. Mexico’s Secretariat of Tourism (SECTUR) documented USD 30.8 billion in international receipts, a historic peak, 63% of which originated from U.S. residents [2]Source: Secretariat of Tourism (Mexico), “Resultados del Turismo 2024,” sectur.gob.mx. . Younger travelers under 60 already generate 80% of luxury leisure bookings, spurring hotels to introduce digital concierge functions and immersive local programming. Mexico welcomed USD 30.8 billion in international visitor spend in 2024, 63% originating from the United States, underscoring strong cross-border luxury flows.
Record luxury-brand pipeline expansion by global chains
Marriott signed 61 luxury projects in 2024 and has 266 properties in its development pipeline, illustrating the premium segment’s pricing resilience. Hilton sharpened its lifestyle push by acquiring Graduate Hotels for USD 210 million and taking majority control of Sydell Group to scale the NoMad flag globally. Pipeline density is most apparent in Mexico, where 25% of 191 hotels under construction fall in the luxury tier, supported by infrastructure upgrades such as the Maya Train and Tulum International Airport. Although new builds intensify competition for talent, expanded distribution readies chains to capture the full travel rebound.
Rise of soft-brand collections empowering independent luxury assets
Soft-brand inventory reached 101,452 rooms across 601 U.S. hotels in 2024, with luxury accounting for 8% of the total. Financial analysis shows soft-branded assets enjoy higher EBITDA margins than unaffiliated independents while preserving architectural individuality. IHG’s Vignette Collection targets a USD 100 billion white space, aiming to add 100 properties in a decade. Hilton’s alliance with Small Luxury Hotels of the World widens distribution without diluting flagship names, confirming that soft-brand affiliation is now mainstream for upscale independents.
Ultra-affluent demand for immersive “bleisure” and wellness retreats
Two-thirds of travelers now blend work and leisure, lifting the global blended-travel market toward USD 731 billion by 2032. Wellness tourism is on a parallel upswing, projected to reach USD 8.5 trillion in 2027, growing 8.6% annually. Luxury resorts reply with longevity clinics, biometric diagnostics, and spa-plus-nutrition packages; Banyan Tree Veya in Mexico’s Valle de Guadalupe exemplifies the crossover. The younger affluent cohort values sustainable and authentic programming, pressing operators to curate nature-immersive itineraries and culinary concepts featuring local sourcing.
Restraints Impact Analysis*
| Restraint | (~) % Impact on CAGR Forecast | Geographic Relevance | Impact Timeline |
|---|---|---|---|
| > USD 1 million per-room development and retrofit costs | -1.4% | US and Canada primary markets, Mexico secondary | Long term (≥ 4 years) |
| Intensifying competition from upscale short-term rental platforms | -1.1% | North America leisure destinations and urban markets | Medium term (2-4 years) |
| Escalating franchise and loyalty fees compressing owner margins | -0.8% | US franchised properties, expanding to Canada | Short term (≤ 2 years) |
| Shortage of luxury-trained hospitality talent inflating wages | -0.7% | Canada acute shortage, US selective markets | Medium term (2-4 years) |
| Source: Mordor Intelligence | |||
Less than USD 1 million per-room development and retrofit costs
Prime-city projects now exceed USD 1 million per key, stalling many independents and shifting capital to conversions. Only 150,000 rooms sit in the US active pipeline, and developers favor adaptive reuse in Dallas and Atlanta where land remains comparatively affordable. Conversions curtail build times but demand sophisticated engineering to meet five-star standards, thus favoring seasoned global chains.
Intensifying competition from upscale short-term rental platforms
Luxury rentals priced beyond USD 1,000 per night saw demand increase 8% in 2024, siphoning leisure travelers who want privacy and expansive floor plans. Platforms such as Wander and Mint House now deliver hotel-grade housekeeping, narrowing service gaps. Hotels counter with exclusive culinary residencies, branded kids’ clubs, and loyalty-based perks, yet margin erosion persists where rate ceilings collide with rising costs.
*Our forecasts treat driver/restraint impacts as directional, not additive. The impact forecasts reflect baseline growth, mix effects, and variable interactions.
Segment Analysis
By Service Type: Business hotels anchor demand while resorts accelerate
Business hotels generated 42.02% of 2025 revenue in the North America luxury hotels market, underpinned by revived corporate gatherings and improved group RevPAR at leading chains. Conference-ready urban properties continue to command premium ADR because proximity to headquarters clusters shortens travel windows. The segment secures weekday base occupancy, letting revenue managers flex resort-style pricing on weekends. Still, the resorts sub-category records the fastest 7.45% growth as affluent guests extend stays and opt for integrated wellness itineraries.
Resorts capture length-of-stay advantages, spend on spa treatments, and rising work-from-anywhere demand. A growing share of extended trips ends in coastal Mexico, luxe mountain enclaves in British Columbia, and U.S. desert wellness retreats. As a result, resorts could reach 34.72% of the North America luxury hotels market size by 2031. Operators are repurposing meeting pavilions into indoor-outdoor co-working lounges to court the same bleisure guest, thereby blurring the line between traditional business and resort typologies.


By Ownership Model: Franchise scale collides with soft-brand agility
Franchise contracts represented 66.01% of the North America luxury hotels market in 2025, validating the asset-light expansion route. These deals let brands seed smaller U.S. metros and Mexican secondary resorts without over-leveraging corporate balance sheets. However, soft-brands will expand to 7.93% annually, enabling owners to win luxury-seeking travelers who prize individuality. Chain-managed properties maintain premium positioning through direct operational control, while independent hotels face increasing pressure to affiliate with major brands for distribution access.
Independent flags still matter in legacy destinations, yet funding constraints and distribution challenges push many to soft-brand affiliation. The North America luxury hotels industry therefore trends toward mixed portfolios where the same parent company distributes standardized luxury along financial centers and bespoke concepts in arts districts.
By Booking Channel: OTA reach meets direct engagement
OTAs delivered 42.88% of 2025 upscale bookings, providing vital visibility for new Mexican shoreline projects and urban boutiques alike. Commission drag remains a pain point, yet hotels tolerate OTA dependence to backfill shoulder-night demand. According to the U.S. Federal Trade Commission, new regulations requiring transparent resort-fee disclosure may push price-sensitive guests toward direct booking where pricing appears clearer . Direct portals are growing 7.32% a year as loyalty apps integrate mobile keys, personalized upgrade offers, and one-tap ancillary purchases, nudging guests to bypass intermediaries.
GDS platforms stay relevant for managed corporate programs, but leisure-heavy properties push exclusive website-only wellness packages. Over time, the direct channel could equal OTA volumes, shifting the North America luxury hotels market size mix and boosting owner margins. The North America luxury hotels industry recognizes that first-party data powers segmented marketing, so capex allocation tilts toward digital personalization engines and user-experience overhauls.

By Customer Segment: Leisure foundation with bleisure innovation
Leisure travelers delivered 61.54% of 2025 room nights and remain the revenue spine of the North America luxury hotels market. High-net-worth households dedicate larger wallet share to experiential travel, prompting hotels to diversify F&B, partner with local artisans, and curate adventure excursions. Corporate transient segments revive but still trail 2019 volume, pushing properties to repurpose underused club floors into hybrid event studios.
Bleisure trips are scaling fastest at 8.08% annually as 66% of travelers blend business with leisure extensions. Hotels now design “work-from-suite” layouts featuring ergonomic desks, 10-gig Wi-Fi, and wellness breaks. If momentum holds, bleisure stays could command 14.65% of the North America luxury hotels market size by 2031. Ultra-high-net-worth travelers continue to anchor top-tier suite demand, but most incremental gains originate from rising-affluent demographics seeking aspirational experiences.
Geography Analysis
North America’s luxury hospitality environment hinges on a mature United States base and accelerating Mexican beach and culture circuits. U.S. assets generated the bulk of the North America luxury hotels market size in 2025, with urban flags leveraging global distribution systems to optimize rate integrity while suburban resorts capture domestic leisure surges. The pipeline stays active in Sun Belt metros where cost-of-living advantages lure corporate relocations that feed midweek bookings. Conversion projects repurpose dormant offices in San Francisco and Philadelphia, injecting luxury inventory without extensive permitting delays.
Mexico advances at an 7.86% CAGR as operators channel fresh capital into Pacific Coast and Caribbean Riviera sub-markets. Marriott, Hilton, and Hyatt collectively supervise more than 40 luxury projects, wagering on robust U.S. outbound travel and an emerging domestic affluent class. Government infrastructure budgets expand airport capacity and rail connectivity, positioning inland heritage cities such as Mérida for upscale boutique expansion. Sustainability regulation tightens along coastal biospheres, compelling developers to adopt low-impact building methods and marine-life protection programs that resonate with eco-conscious guests.
Canada’s gateway clusters sustain healthy ADR even as cost per room constructed surpasses USD 1 million in top districts. Toronto’s Entertainment District will welcome the Nobu Hotel in summer 2025, enriching the city’s five-star palette and tempting U.S. weekend travelers. Vancouver capitalizes on its cruise-port status to convert pre- and post-voyage guests into extended luxury stays. Labor shortfalls, immigration policy shifts, and lengthy entitlement processes temper supply growth, yet high barriers preserve pricing power for existing assets.
Competitive Landscape
Marriott International, Hilton Worldwide, Hyatt Hotels Corporation, Four Seasons Hotels & Resorts, and Accor SA collectively dominate regional luxury distribution networks. Their combined scale enables preferred-supplier status with corporate buyers and deep loyalty engagement that directs bookings into brand ecosystems. Hilton’s USD 210 million acquisition of Graduate Hotels broadens campus-adjacent lifestyle coverage, while the majority stake in Sydell Group signals ambition to seed the NoMad brand across global capitals. Marriott’s purchase of Postcard Cabins highlights a tactic to absorb outdoor-immersive demand without diluting core luxury credentials.
Technology is a chief arms race variable. AI-powered revenue platforms raise ADR 6–10% by recommending rate adjustments in sub-hourly bursts and cross-selling spa or experience bundles. Guests expect digital keys and messaging apps; brands unwilling to fund these upgrades risk occupancy erosion to tech-forward rivals. Independent properties differentiate through hyper-local designs and chef-driven dining but must join soft-brands or consortiums to preserve visibility on meta-search engines.
White-space expansion thrives in secondary U.S. cities where corporate relocations spur upscale business travel. Adaptive reuse of Class-A offices into luxury hotels unlocks centrally located inventory, though design challenges demand experienced firms. Wellness-centric product segmentation grows, with Four Seasons adding medical-grade longevity suites and Montage collaborating with fitness brands for retreat experiences. Consequently, competitive advantage hinges on harmonizing personalized human service with data-driven precision, ensuring that luxury stays feel bespoke yet operationally efficient.
North America Luxury Hotel Industry Leaders
Marriott International
Hilton Worldwide
Hyatt Hotels Corp.
Four Seasons Hotels & Resorts
Accor SA
- *Disclaimer: Major Players sorted in no particular order

Recent Industry Developments
- April 2025: Grand Metropolitan Hotels acquired Voile d'Or Luxury Hotel Collection, securing brand IP and key contracts for future global expansion.
- April 2025: Sonesta International Hotels formed an alliance with AKEN Hotels & Resorts to deepen South America and Caribbean reach while integrating loyalty benefits.
- March 2025: Nobu Hotel Toronto confirmed a summer 2025 opening with 36 rooms and suites plus exclusive dining privileges.
- February 2025: Marriott International added 123,000 net rooms in 2024 and surpassed 1.7 million keys worldwide, citing luxury outperformance.


Research Methodology Framework and Report Scope
Market Definitions and Key Coverage
Our study defines the North American luxury hotel market as revenue generated by five-star and equivalent properties that deliver premium lodging, curated dining, and personalized concierge services across the United States, Canada, and Mexico. We count open, professionally managed hotels only, valuing room as well as ancillary revenue streams booked in-house.
Scope exclusion: Lodging categories that fall below accepted five-star standards, branded residences sold as real estate, serviced apartments, and shared-economy vacation rentals are not included.
Segmentation Overview
- By Service Type
- Business Hotels
- Airport Hotels
- Suite Hotels
- Resorts
- Other Service Types
- By Ownership / Management Model
- Chain-Managed
- Franchise
- Independent
- Soft-Brand Collections
- By Booking Channel
- Direct
- Online Travel Agencies (OTAs)
- Global Distribution Systems / Corporate Travel
- Tour Operators & Wholesale
- By Customer Segment
- Leisure
- Business
- Bleisure
- Group / MICE
- Ultra-High-Net-Worth (UHNWI)
- By Geography
- United States
- Canada
- Mexico
Detailed Research Methodology and Data Validation
Primary Research
Our analysts interviewed hotel revenue managers, luxury travel advisors, asset-management consultants, and procurement heads across the three countries. These conversations validated secondary assumptions on achievable ADRs, seasonality curves, and soft-brand expansion plans, and then flagged regional differences in renovation cycles that influence capital spending.
Desk Research
We began with publicly available tourism intelligence from the US National Travel & Tourism Office, Statistics Canada, Mexico's SECTUR bulletins, and UNWTO arrival dashboards, which together framed inbound and domestic travel flows. Trade association outlooks from AHLA, WTTC, and the Hotel Association of Canada helped us understand occupancy norms and average daily rates, while company filings shed light on brand-level pipeline additions. Dow Jones Factiva and D&B Hoovers supplied timely deal news and corporate financials that sharpened revenue splits.
Additional context was drawn from regional customs data on wine and premium food imports, peer-reviewed hospitality journals, and airport passenger statistics, offering indirect checks on high-end traveler volumes. This list is illustrative; many other trusted sources were consulted to corroborate figures and clarify definitions.
Market-Sizing & Forecasting
A top-down model was built by reconstructing luxury room revenue from official occupancy, supply, and ADR series, which are then aligned with spend ratios for food and beverage, spa, and events to reach total property revenue. Supplier roll-ups and sampled rate-card checks acted as a bottom-up sense test, allowing our team to adjust anomalies. Key variables include five-star room inventory growth, international arrival mix, corporate meeting recovery, renovation-driven room closures, and currency trends. Multivariate regression, refreshed each cycle, projects these inputs through 2030 and captures scenario deltas provided by primary experts.
Data Validation & Update Cycle
Outputs pass automated variance screens, peer review, and manager sign-off. We refresh the dataset annually, with interim updates triggered by material events such as sudden border policy shifts or marquee brand mergers, ensuring clients receive our latest view at delivery.
Why Mordor's North America Luxury Hotel Baseline Numbers Command Confidence
Published estimates often diverge because firms pick different property tiers, bundle ancillary segments in unique ways, or apply one-size growth factors without local feedback.
Key gap drivers include rivals extending scope into upper upscale resorts, relying on global occupancy averages, or using pipeline counts instead of operational keys, whereas our baseline stays rooted in verified open property revenue and region-specific traveler behavior.
Benchmark comparison
| Market Size | Anonymized source | Primary gap driver |
|---|---|---|
| USD 41.23 B (2025) | Mordor Intelligence | - |
| USD 45.21 B (2023) | Regional Consultancy A | Includes premium upscale and extended stay hotels, straight-line ADR growth |
| USD 63.61 B (2024) | Global Consultancy B | Bundles full upmarket tiers, extrapolates occupancy from global data, minimal primary validation |
| USD 37.86 B (2024) | Trade Journal C | Uses pipeline counts as proxy and single growth factor for forecast |
The comparison shows that when scope precision, timely primary checks, and balanced modeling come together, Mordor Intelligence delivers a transparent, repeatable baseline that decision makers can trust.


Key Questions Answered in the Report
What is the current size of the North America luxury hotels market?
The market is valued at USD 44.22 billion in 2026 and is on track to hit USD 62.83 billion by 2031.
Which segment is growing fastest within the North America luxury hotels market?
Resorts are forecast to expand at a 7.45% CAGR, benefitting from wellness and experiential travel trends.
How significant are soft-brand collections in luxury hotel growth?
Soft-brands are the fastest-growing ownership model, projected at an 7.93% CAGR as independents seek global distribution with brand flexibility.
Why is Mexico the most dynamic geography for luxury hotel development?
Luxury investment in Mexico rose 50% in 2024, aided by new infrastructure such as the Maya Train and Tulum International Airport that improves access for U.S. travelers.
How are luxury hotels addressing competition from upscale vacation rentals?
Operators invest in distinctive experiential programming, personalized service, and advanced loyalty benefits to differentiate from rental properties demanding over USD 1,000 nightly rates.
What role does technology play in luxury hotel profitability?
AI-driven revenue management delivers 6-10% ADR lifts and, combined with mobile keys and guest-messaging apps, boosts direct bookings and margins.
Page last updated on:


