Targeting Pods Market Size and Share
Market Overview
| Study Period | 2020 - 2031 |
|---|---|
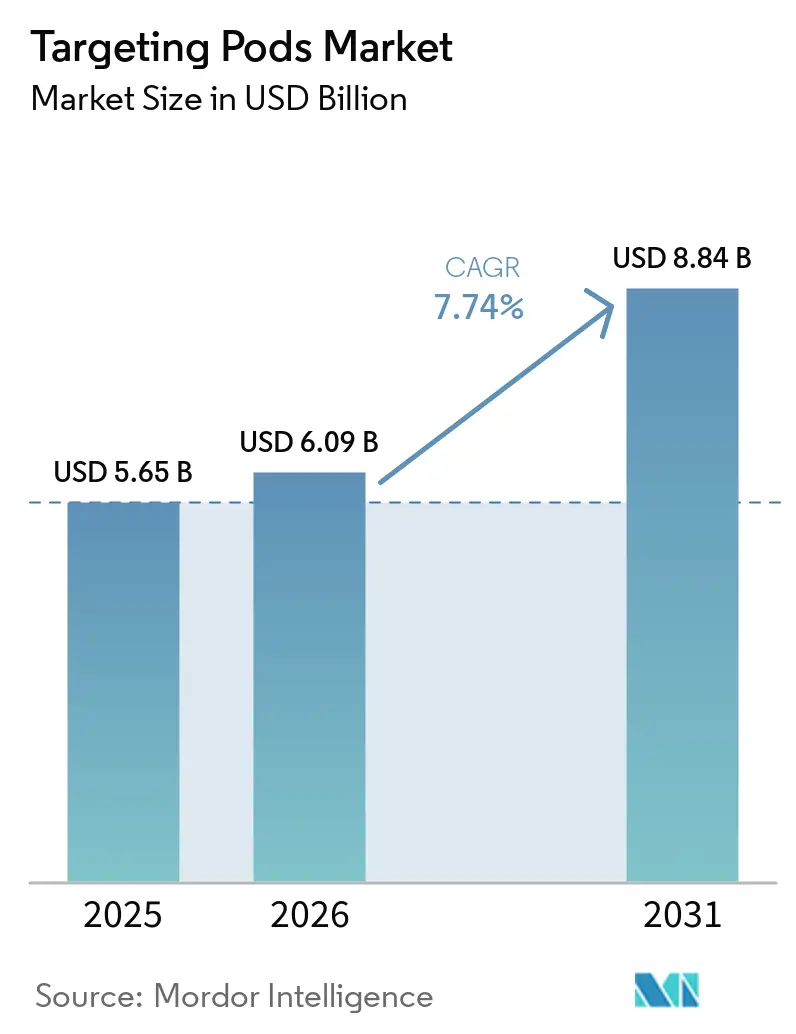
| Market Size (2026) | USD 6.09 Billion |
| Market Size (2031) | USD 8.84 Billion |
| Growth Rate (2026 - 2031) | 7.74% CAGR |
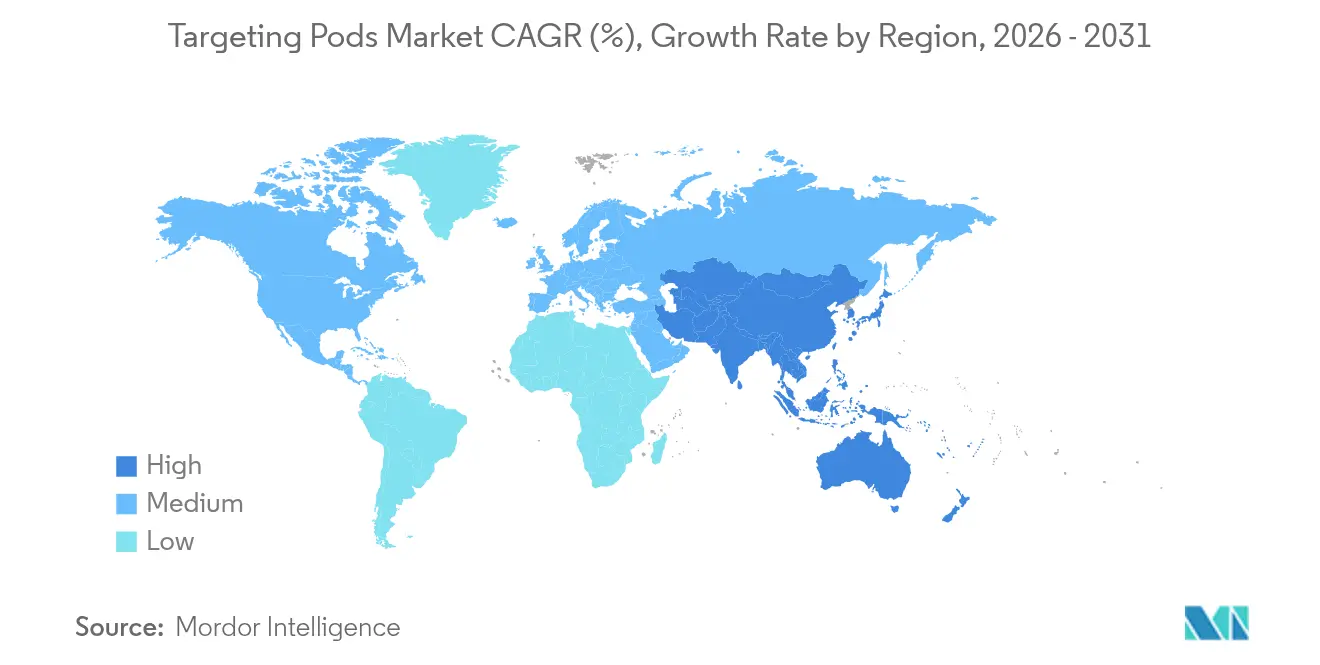
| Fastest Growing Market | Asia Pacific |
| Largest Market | North America |
| Market Concentration | Medium |
Major Players *Disclaimer: Major Players sorted in no particular order Image © Mordor Intelligence. Reuse requires attribution under CC BY 4.0. | |
Targeting Pods Market Analysis by Mordor Intelligence
The targeting pods market size in 2026 is estimated at USD 6.09 billion, growing from 2025 value of USD 5.65 billion with 2031 projections showing USD 8.84 billion, growing at 7.74% CAGR over 2026-2031. The growth is fueled by accelerating precision-guided warfare doctrines, rising multi-domain integration requirements, and steady defense-modernization budgets across NATO allies and emerging economies. Ongoing retrofits that embed artificial intelligence and sensor-fusion software convert electro-optical pods into networked battlefield intelligence nodes, turning fourth-generation fighters into collaborative assets with fifth-generation platforms.[1]Source: Lockheed Martin, “Sniper® Networked Targeting Pod to Link F-35s, 4th Generation Jets and Missile Systems for Unprecedented Deterrence,” lockheedmartin.com The targeting pods market benefits from proven combat aircraft demand, rapid unmanned combat aerial system adoption, and interoperability mandates that favor open-architecture designs. Competitive dynamics remain moderately consolidated, yet capital-rich disruptors continue to enter with agile prototyping and commercial-technology adaptation. Counter-threat environments—particularly anti-access/area-denial zones—underscore the need for resilient, cyber-hardened pods to share data securely across joint forces.
Key Report Takeaways
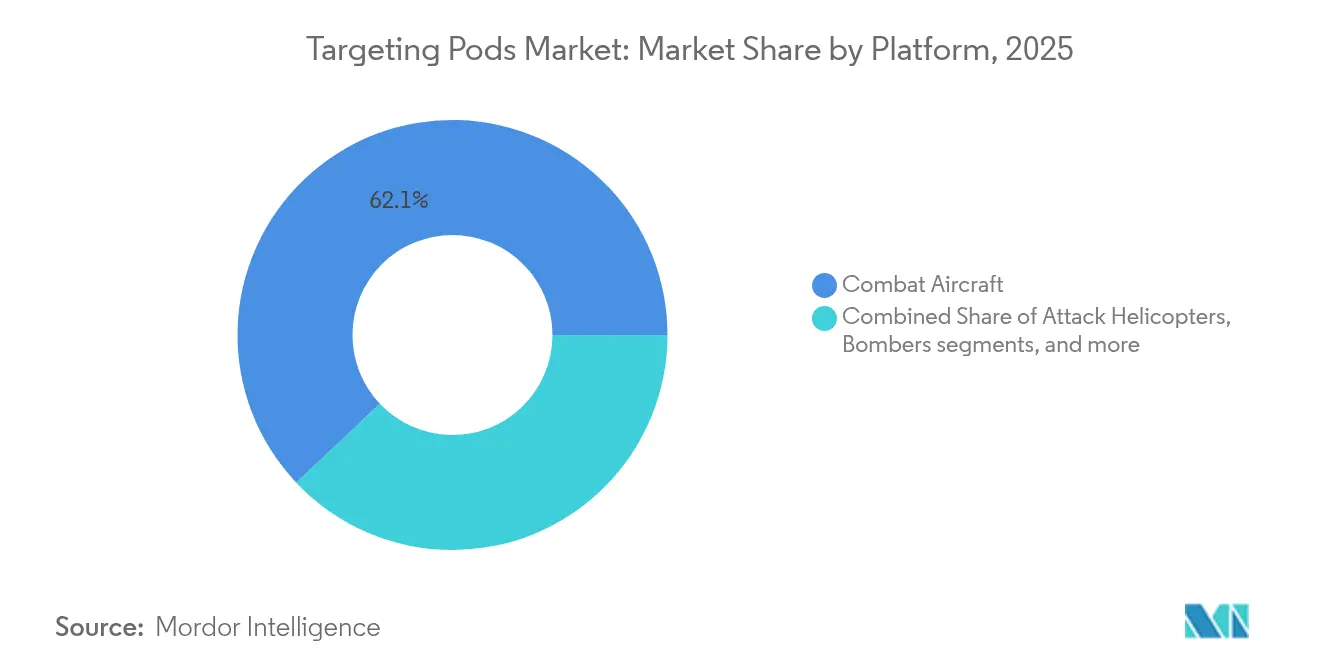
- By platform, combat aircraft led with 62.05% of the targeting pods market share in 2025, while unmanned combat aerial systems are forecasted to expand at a 9.63% CAGR through 2031..
- By fit, original-equipment installations held 68.10% of the targeting pods market share in 2025; retrofit programs record the fastest growth at an 8.78% CAGR to 2031.
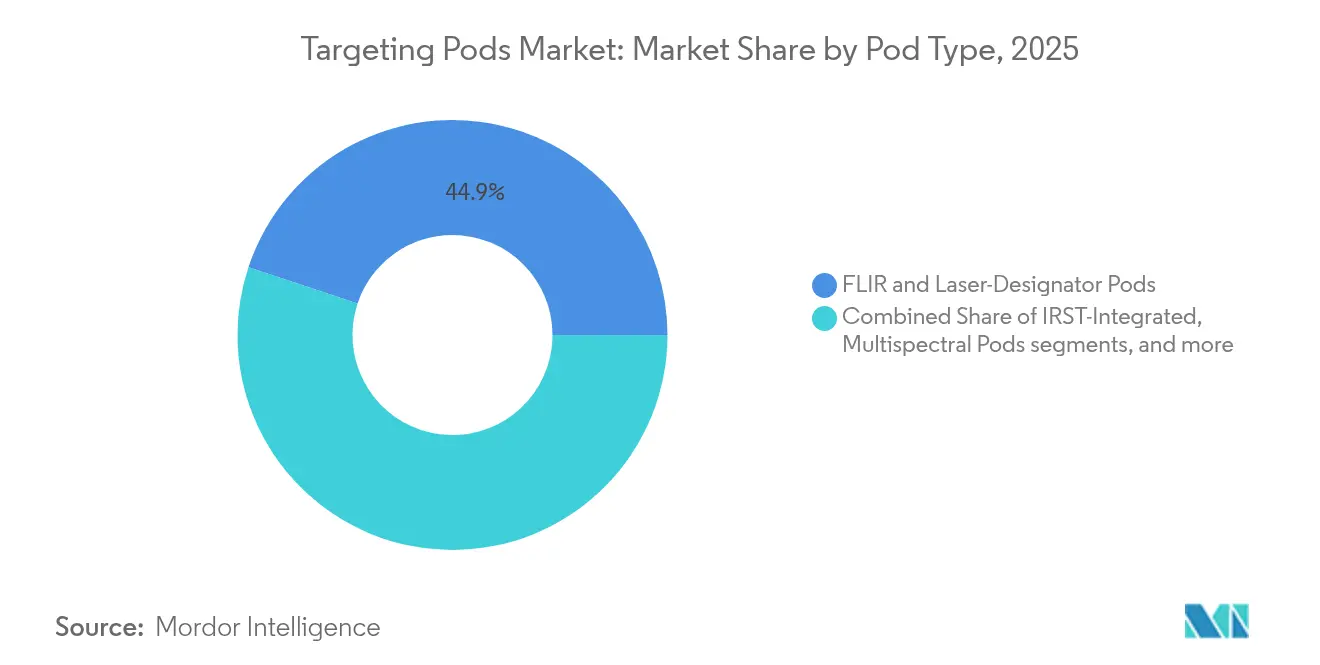
- By pod type, FLIR / laser-designator systems accounted for 44.90% share of the targeting pods market size in 2025, whereas multispectral/networked variants are set to climb at a 9.86% CAGR.
- By technology, electro-optical imaging dominated with a 43.20% share in 2025, yet AI-enabled sensor fusion is advancing at a 12.55% CAGR.
- By geography, North America commanded 37.90% of global revenue in 2025, while Asia-Pacific exhibits the highest regional CAGR at 8.83% through 2031.
Note: Market size and forecast figures in this report are generated using Mordor Intelligence’s proprietary estimation framework, updated with the latest available data and insights as of 2026.
Global Targeting Pods Market Trends and Insights
Drivers Impact Analysis*
| Driver | (~) % Impact on CAGR Forecast | Geographic Relevance | Impact Timeline |
|---|---|---|---|
| Growing procurement of advanced combat aircraft in emerging economies | +1.2% | Asia-Pacific, Middle East, Latin America | Medium term (2-4 years) |
| Upgrade programs for 4th/5th-generation aircraft fleets | +1.8% | North America, Europe, Global | Long term (≥ 4 years) |
| Rising demand for precision-guided munitions | +1.5% | Global | Short term (≤ 2 years) |
| Increasing global defense budgets | +1.1% | Global | Medium term (2-4 years) |
| Integration of AI-enabled sensor fusion within targeting pods | +0.9% | North America, Europe, Asia-Pacific | Long term (≥ 4 years) |
| NATO push for networked multi-platform “kill-web” architecture | +0.7% | North America, Europe | Medium term (2-4 years) |
| Source: Mordor Intelligence | |||
Growing Procurement of Advanced Combat Aircraft in Emerging Economies
Middle-income nations are expanding fighter inventories to deter regional threats, elevating demand for high-end targeting pods market solutions. The Philippines earmarked USD 35 billion for a ten-year modernization program that includes advanced fighters and associated sensor suites.[2]Source: Asia Pacific Defense Journal, “Philippines to Acquire More Military Hardware Including BrahMos Missiles, Submarines,” asiapacificdefensejournal.com Southeast Asian air forces are evaluating diversified supply options, such as the UAE’s interest in South Korea’s KF-21 Boramae priced near USD 65 million per unit. These procurements prioritize precision engagement over fleet size, reinforcing the targeting pods market as a cost-effective force multiplier.
Up-gradation Programs for 4th/5th-Generation Aircraft Fleets
Extensive retrofit initiatives sustain long-term contracts for targeting pod vendors. Poland’s USD 90.68 million purchase of Sniper pods for FA-50s illustrates how air forces extend combat relevance without acquiring entirely new fleets. The US Air Force LITENING Large Aperture upgrade boosts resolution and range by 50%, providing incremental capability gains on installed platforms.
Rising Demand for Precision-Guided Munitions
Evolving weapons such as Raytheon’s GBU-53/B StormBreaker require advanced designation, threat-sharing, and battle-damage assessment, pushing the targeting pods market toward multispectral networking. Qatar’s USD 1 billion FS-LIDS deal hints at a broader precision-engagement architecture that now spans air-to-ground and counter-drone missions.
Increasing Global Defense Budgets
The US Department of Defense requested USD 842 billion for FY 2024, emphasizing next-generation capabilities crucial for modern pods. NATO’s Defence Production Action Plan channeled USD 10 billion in contracts through its procurement agency, reinforcing alliance-wide investment in interoperable sensors. Heightened geopolitical tension ensures sustained funding that underpins the targeting pods market.
Restraints Impact Analysis*
| Restraint | (~) % Impact on CAGR Forecast | Geographic Relevance | Impact Timeline |
|---|---|---|---|
| High acquisition and life-cycle costs | -1.4% | Global, particularly emerging economies | Short term (≤ 2 years) |
| Export-control/ITAR restrictions | -0.8% | Global, affecting non-allied nations | Long term (≥ 4 years) |
| Cooling-technology limits for SWaP-constrained UAV pods | -0.6% | Global, concentrated in UAV-heavy operations | Medium term (2-4 years) |
| Vulnerability to cyber and datalink jamming in contested A2AD zones | -0.4% | Regional, focused on contested environments (South China Sea, Eastern Europe, Middle East) | Medium term (2-4 years) |
| Source: Mordor Intelligence | |||
High Acquisition and Life-Cycle Costs
Escalating aircraft prices amplify affordability challenges; the F-35 exceeded USD 140 million per unit in earlier lots, and next-generation fighters may cross USD 300 million, making high-spec pods a sizeable additive cost.[3]Source: CSIS, “Updating Augustine’s Law: Fighter Aircraft Cost Growth in the Age of AI and Autonomy,” csis.org Long-term sustainment demands specialized software maintenance and sensor recalibration, adding pressure on operating budgets.
Export-Control/ITAR Restrictions
Targeting pods fall under US Munitions List categories that require State Department licensing, limiting technology transfers to non-allied states. Turkey’s ASELPOD program underscores how nations develop indigenous alternatives to bypass restrictions, fragment standards, and cap potential addressable volumes.
*Our forecasts treat driver/restraint impacts as directional, not additive. The impact forecasts reflect baseline growth, mix effects, and variable interactions.
Segment Analysis
By Platform: UAVs Redefine Operational Concepts
Combat aircraft are set to command a dominant 62.05% share of the targeting pods market in 2025, driven by increasing defense budgets and the growing need for advanced targeting systems. Yet, unmanned combat aerial systems are set to grow at 9.63% CAGR as of 2026-2031. SkyTower II integration on MQ-9 Reapers exemplifies how lightweight, thermally efficient pods meet stringent size-weight-power limits. General Atomics’ airborne-laser pod trials on the MQ-9B further highlight the expanding mission envelope that drives advanced cooling and power-management solutions. Attack helicopters and strategic bombers employ specialized pods for close support and long-range precision strike. At the same time, collaborative teaming—such as MQ-28 Ghost Bat operations alongside E-7A Wedgetail—imposes stringent networking requirements that only next-generation pods can fulfill.
Follow-on demand arises from national drone programs that rely on pods for autonomous targeting. The Marine Corps’ smart-sensor package for MQ-9 systems highlights convergence between manned and unmanned mission profiles. Consequently, the targeting pods market continues evolving toward lighter, modular payloads compatible with both traditional aircraft and low-observable drones, ensuring sustained revenues for sensor integrators.


By Fit: Retrofit Programs Extend Platform Life Cycles
Original-equipment fits represent 68.10% of 2025 revenue, illustrating the baseline integration on newly built platforms. Yet retrofit demand, growing at 8.78% CAGR, signals the air force's preference for phased modernization. The targeting pods market size attached to retrofit installations gains from planned mid-life upgrades such as Singapore's F-16V program, which adds AESA radar and new avionics alongside pod replacements. OEMs supply hardware kits and software patches that convert legacy systems into network-ready assets.
Retrofits compress lead times and reduce pilot-retraining costs. Digital backbones installed on many fighters simplify plug-and-play pod insertion, reinforcing budgetary appeal. As a result, retrofit opportunities will remain a stable revenue pillar within the targeting pods industry despite the emergence of all-new platforms.
By Pod Type: Networking Catalyzes Innovation
FLIR/laser-designator pods held a 44.90% share in 2025, validating decades of proven performance. Multispectral/networked variants, projected at 9.86% CAGR, add data-link radios, edge compute modules, and cyber-hardening features, aligning with joint force “sensor-to-shooter” timelines. Lockheed Martin’s Sniper Networked model embeds mobile ad-hoc network radios that transmit metadata directly to missile batteries or command posts. Passive infrared search-and-track (IRST) integration, such as the Block II pod on US Navy Super Hornets, further blurs the lines between detection and designation functions.
Emerging hyperspectral solutions, typified by RTX’s RAIVEN, capture extended wavebands to differentiate camouflage and composite materials at stand-off ranges. Consequently, pod suppliers now market multi-sensor packages capable of collaborative engagement across land, sea, air, and space nodes, elevating the targeting pods market beyond its electro-optical origins.
By Technology: AI Drives Autonomous Targeting
Electro-optical imaging retained a 43.20% revenue share in 2025, yet AI-enabled sensor fusion is forecast to expand at 12.55% CAGR. Machine-learning algorithms embedded in field-programmable gate arrays allow real-time object classification and behavioral analytics, trimming operator workload. A broadband hyperspectral sensor achieving 74.8% light throughput demonstrates technical progress that underpins next-generation data fusion.
Infrared imaging remains indispensable for night and adverse-weather missions, while 5G/mesh networking converts pods into distributed computing nodes. Active investments by Lockheed Martin in AI-at-the-edge architectures underscore industry momentum toward autonomous targeting. Competitive pressure from AI-enabled drones in Eastern European conflict zones accelerates adoption across Western inventories.
Geography Analysis
North America retains leadership with 37.90% 2025 revenue as sustained Pentagon procurement funds next-generation sensor integration and pod upgrades. The FY 2026 US procurement request of USD 205 billion prioritizes high-tech missiles and unmanned systems, expanding the targeting pods market pipeline. Canada’s order for MQ-9B drones and the U.K.’s carrier-borne F-35B deployments reiterate ongoing sensor-upgrade cycles throughout allied fleets.
Asia-Pacific is the fastest-growing region at an 8.83% CAGR through 2031. Indonesia’s deal for 42 Rafales, Singapore’s combined F-16V and F-35B programs, and Japan’s invitation to India to join the sixth-generation GCAP fighter underline regional momentum. Targeting pod demand benefits from broader defense-industrial cooperation and technology-transfer agreements that localize sustainment.
Europe maintains steady replacement demand driven by Tornado and older Typhoon retirement cycles. At the same time, Middle Eastern customers diversify their supplier bases to include South Korean and Turkish platforms equipped with advanced targeting capabilities. Latin America shows smaller but consistent retrofits, leveraging US Foreign Military Sales financing mechanisms that often bundle pod upgrades with aircraft maintenance packages. Collectively, regional demand curves affirm a resilient, globally distributed aircraft targeting pods market.

Competitive Landscape
Market concentration of players is moderate in the targeting pods market. Lockheed Martin, Northrop Grumman, and RTX collectively control the largest installed base of pods, leveraging deep government ties and proprietary integration software. Lockheed Martin recorded USD 18.0 billion in Q1 2025 sales with 13% growth in its Missiles and Fire Control division, reflecting sustained demand for Sniper upgrades. Northrop Grumman continues to expand its LITENING Large Aperture program, and RTX backs its RAIVEN family with significant investment that aligns hyperspectral sensing with AI analytics.
Emerging entrants leverage commercial-sector funding rounds to rapidly prototype both pods. Anduril Industries secured USD 2.5 billion in capital and topped the 2025 CNBC Disruptor 50 list, signaling investor confidence in agile defense-technology models. General Atomics and Saab’s June 2025 partnership to integrate AEW&C payloads on the MQ-9B further exemplifies cross-company cooperation that both densifies and enhances pod applications. Leonardo’s industrial plan commits EUR 118 billion (USD 138.31 million) in cumulative orders, positioning the firm to compete in collaborative combat-aircraft systems that require network-ready pods.
Strategic moves center on AI software integration, open-architecture design, and multi-sensor data-link capability. Vendors strengthen cyber-resilience and thermal-management engineering to meet UAV constraints while offering modular upgrade paths to protect customer investments. Overall, competition revolves around innovation speed, sustainment support, and compliance with stringent export-control regimes.
Targeting Pods Industry Leaders
Lockheed Martin Corporation
RTX Corporation
Northrop Grumman Corporation
ASELSAN A.Ş.
Rafael Advanced Defense Systems Ltd.
- *Disclaimer: Major Players sorted in no particular order


Recent Industry Developments
- June 2025: Lockheed Martin showcased the Sniper Advanced Targeting Pod (ATP) at Eglin Air Force Base, highlighting its unmatched precision and accuracy. Aircraft equipped with the Sniper and Advanced Precision Weapon System (APKWS) rockets have since been spotted globally, demonstrating the system's critical role in addressing the growing need for advanced targeting solutions.
- August 2024: The Defence Research and Development Organisation (DRDO) announced the development of a domestically produced Laser Designation Pod (LDP) for Indian fighter jets. This advanced system enhances the Indian Air Force's precision strike capabilities by detecting, identifying, and designating targets for guided munitions while transmitting real-time target imagery and video to ground stations.


Research Methodology Framework and Report Scope
Market Definitions and Key Coverage
Our study defines the global targeting pods market as the annual revenue generated from forward-looking infrared and laser-designator pods that are externally mounted on fixed-wing combat aircraft, unmanned combat aerial systems, attack helicopters, and bombers for precision strike, surveillance, and battle-damage assessment functions.
Scope exclusion: stand-alone infrared search-and-track sensors embedded inside the airframe, airborne reconnaissance pods that lack laser designation, and land- or ship-based target designators are not counted.
Segmentation Overview
- By Platform
- Combat Aircraft
- Unmanned Combat Aerial Systems (UCAS)
- Attack Helicopters
- Bombers
- By Fit
- Original Equipment Manufacturer (OEM)
- Retrofit/Upgrade
- By Pod Type
- FLIR and Laser-Designator Pods
- Laser Spot-Tracker Pods
- Multispectral/Networked Pods
- IRST-Integrated Pods
- By Technology
- Electro-Optical Imaging
- Infrared Imaging
- Multispectral/Hyperspectral Sensing
- AI-Enabled Sensor Fusion
- 5G/Mesh Networking Enabled
- By Geography
- North America
- United States
- Canada
- Mexico
- Europe
- United Kingdom
- Germany
- France
- Russia
- Rest of Europe
- Asia-Pacific
- China
- Japan
- India
- South Korea
- Australia
- Rest of Asia-Pacific
- South America
- Brazil
- Rest of South America
- Middle East and Africa
- Middle East
- Saudi Arabia
- United Arab Emirates
- Israel
- Rest of Middle East
- Africa
- South Africa
- Rest of Africa
- Middle East
- North America
Detailed Research Methodology and Data Validation
Primary Research
Mordor analysts interviewed program managers in North America, fleet logistics officers in Europe, and procurement integrators across Asia-Pacific to validate unit installation rates, retrofit cycles, and average selling prices.
Short surveys with avionics engineers and sustainment contractors then resolved gray areas around sensor-fusion software upgrade pricing.
Desk Research
We began with defense budget transcripts from sources such as the Stockholm International Peace Research Institute, US DoD green-book tables, and NATO AMDR filings, which clarify spending on pod procurement and upgrades.
Trade association data sets from AIA, ASD-Europe, and the Indian IMTMA registry helped track production runs and retrofit volumes.
Customs statistics in UN Comtrade and Volza clarified cross-border shipments of electro-optical sub-assemblies, while patent families pulled from Questel highlighted emerging multispectral pod designs.
Financial cues came from public 10-K filings and investor decks of major avionics suppliers.
The list above is illustrative; many additional open and paid sources fed our groundwork.
Market-Sizing & Forecasting
A top-down reconstruction starts with platform inventories and new deliveries, which are then multiplied by pod penetration ratios and calibrated ASPs to build the 2025 baseline.
Select bottom-up cross-checks, supplier roll-ups and sampled contract values, tighten the range.
Key variables tracked include combat aircraft backlog, retrofit share, laser-designator attach rate, average pod life, and defense capital-outlay inflation.
We project forward with a multivariate regression that blends projected fleet additions, defense-budget growth, and historical retrofit cadence. Experts review scenario envelopes before numbers lock.
Data Validation & Update Cycle
Our team runs anomaly scans that flag volume-price outliers, compares outputs with open intelligence feeds, and escalates variances for a second-level peer review.
The model refreshes every twelve months, with mid-cycle updates triggered by material contract awards or budget shifts, ensuring clients always receive the latest view.
Why Mordor's Targeting Pods Baseline commands reliability
Published estimates often diverge because firms pick different platform lists, treat retrofit income unevenly, or refresh figures on separate calendars.
Key gap drivers include whether unmanned platforms are fully included, if after-sales software upgrades are booked as separate revenue, and the currency-conversion vintage each firm uses. Our disciplined scope selection, annual refresh, and dual-path validation keep Mordor's view centered and transparent.
Benchmark comparison
| Market Size | Anonymized source | Primary gap driver |
|---|---|---|
| USD 5.65 B (2025) | Mordor Intelligence | |
| USD 5.36 B (2024) | Regional Consultancy A | Excludes retrofit kits; uses list prices without contract escalation |
| USD 5.26 B (2024) | Trade Journal B | Adds non-pod electro-optical sensors, inflating base figure |
| USD 2.60 B (2024) | Industry Association C | Counts only factory-installed pods, omits upgrades and support services |
Taken together, the comparison shows that wide swings arise mainly from scope boundaries and price assumptions.
By anchoring values to verified installation counts, consistent ASP ladders, and an annual audit loop, Mordor Intelligence delivers a balanced, decision-ready baseline.


Key Questions Answered in the Report
What is the current value of the targeting pods market?
The targeting pods market size stands at USD 6.09 billion in 2026.
Which platform segment offers the highest growth potential?
Unmanned combat aerial systems (UCAS) show the fastest growth, projected at 9.63% CAGR through 2031.
How does AI-enabled sensor fusion change the business case for targeting pods?
AI fusion automates target recognition and cuts operator workload, which reduces mission-cycle time and can lower through-life operating cost by up to 15% versus legacy electro-optical pods.
What return on investment can air forces expect from retrofit programs?
Typical pod retrofits cost 20–30% of a new-build sensor fit yet add 8–12 years of platform relevance, giving operators a payback period of roughly three budget cycles.
What technology trend will most influence future pod designs?
AI-enabled sensor fusion that delivers autonomous target recognition and networked data-sharing is forecast to expand at 12.55% CAGR, shaping next-generation pod architectures.
Which region is expected to see the fastest market expansion?
Asia-Pacific is projected to grow at an 8.83% CAGR as regional modernization and security concerns drive procurement.
Page last updated on:


