
Market Overview
| Study Period | 2019 - 2031 |
|---|---|
| Forecast Data Period | 2026 - 2031 |
| Base Year Market Size (2025) | USD 25.16 Billion |
| Market Size (2026) | USD 25.58 Billion |
| Market Size (2031) | USD 28.29 Billion |
| Growth Rate (2026 - 2031) | 2.03 % |
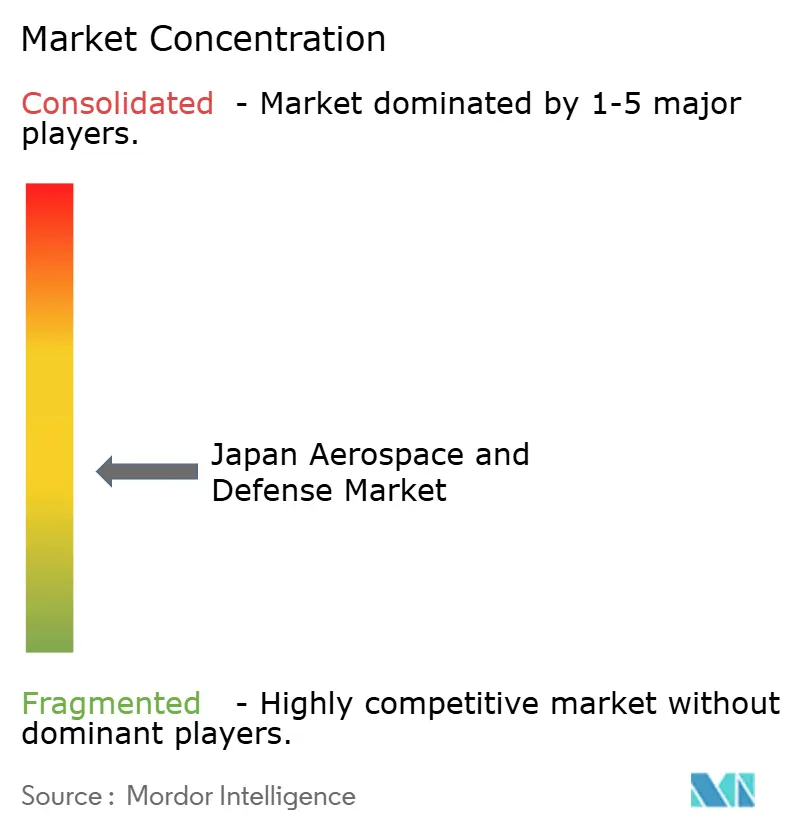
| Market Concentration | Medium |
Major Players *Disclaimer: Major Players sorted in no particular order Image © Mordor Intelligence. Reuse requires attribution under CC BY 4.0. | |
Japan Aerospace and Defense Market Analysis by Mordor Intelligence
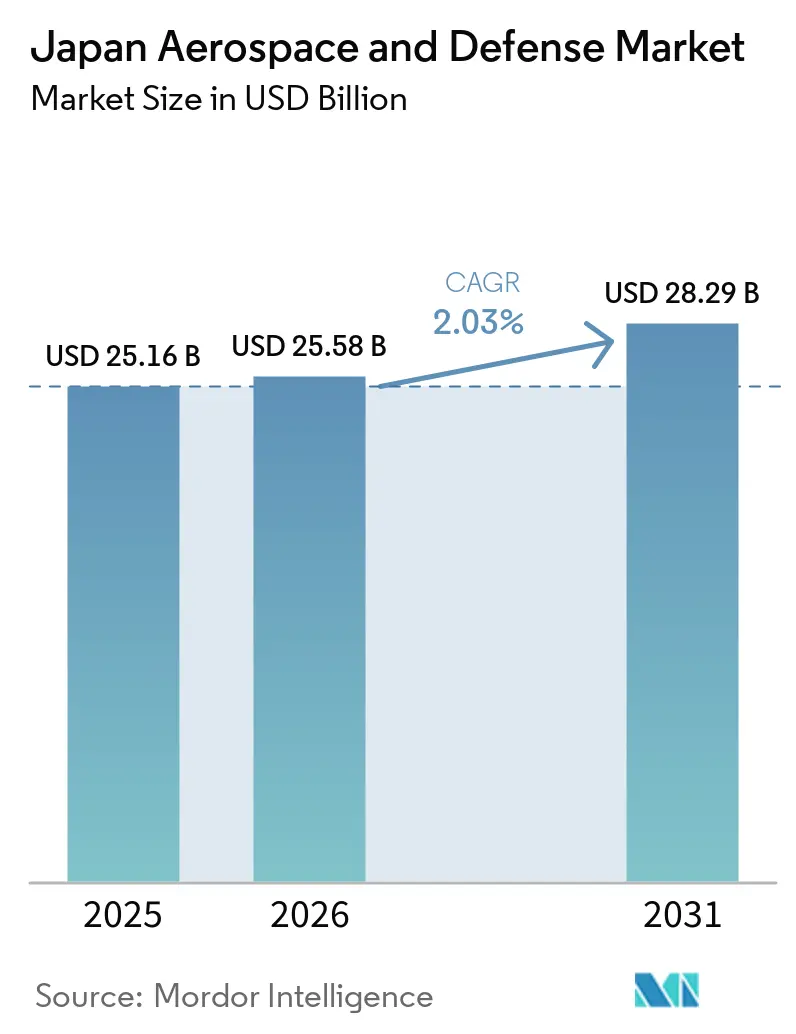
The Japan aerospace and defense market size was valued at USD 25.16 billion in 2025, and is forecast to grow from USD 25.58 billion in 2026 to reach USD 28.29 billion by 2031, at a 2.03% CAGR during the forecast period (2026-2031). The estimate sits beside a larger shift in Japan’s procurement priorities under the Defense Buildup Program. Air and missile defense, long-range strike systems, naval construction, and surveillance satellites are receiving more attention in procurement plans. This is increasing the value of engineering, systems integration, and long-term support work. Domestic prime contractors are positioned to benefit because many programs require local production, certification, and sustainment. Export policy changes also create a possible path for selected firms to build experience with overseas customers.
Key Report Takeaways
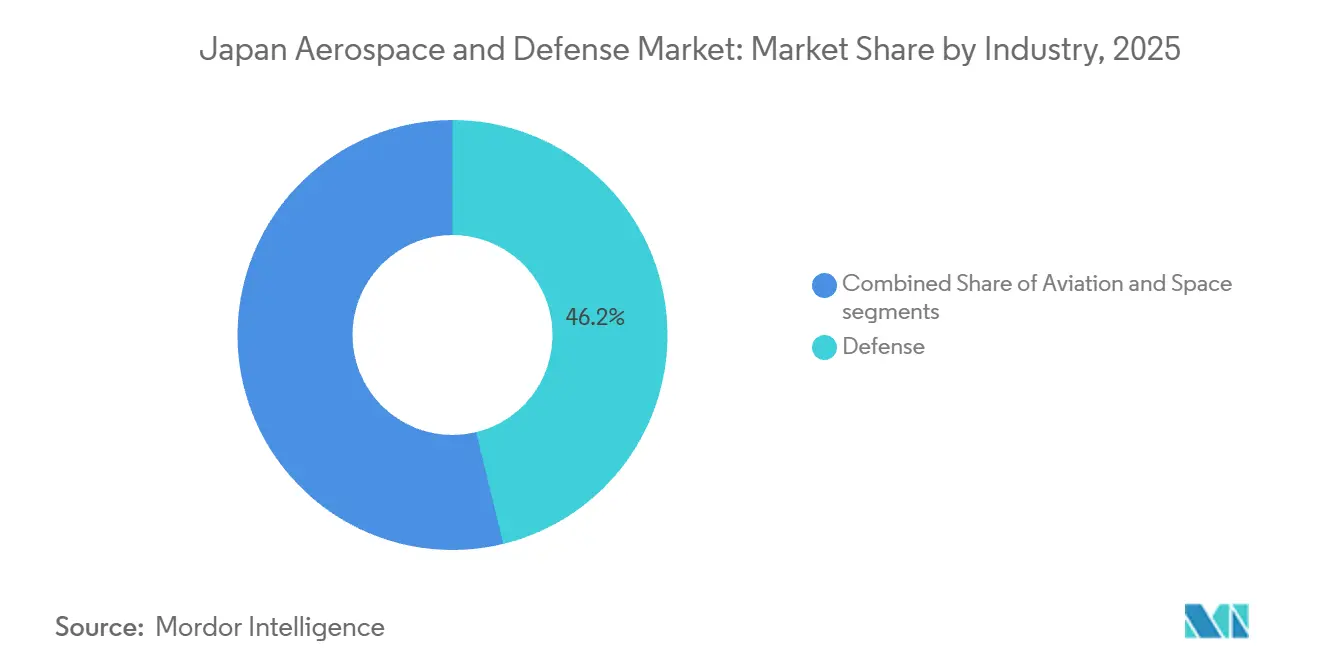
- By industry, defense accounted for 46.20% of revenue in 2025, while space is forecast to grow at a 3.41% CAGR through 2031.
- By type, platforms accounted for 54.15% of revenue in 2025, while systems are projected to grow at a 3.62% CAGR through 2031.
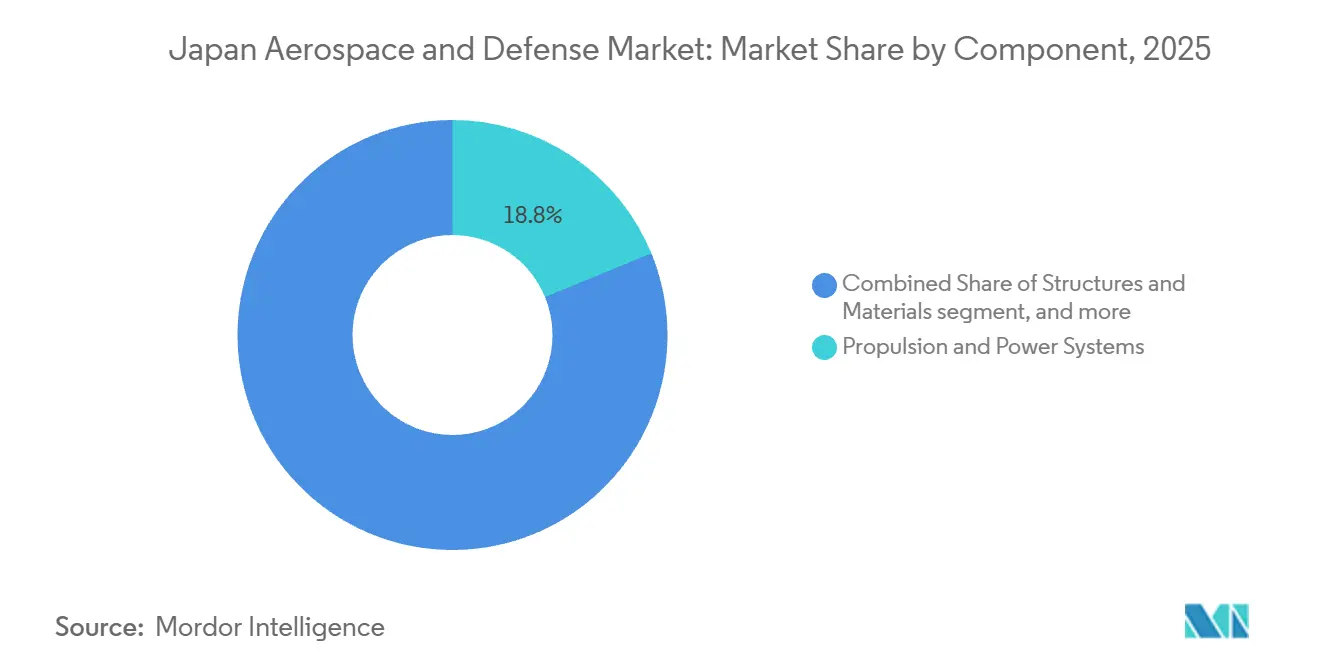
- By component, propulsion and power systems accounted for 18.80% of revenue in 2025, while cyber warfare is forecast to grow at a 3.95% CAGR through 2031.
- By point of sale, OEM accounted for 69.45% revenue share in 2025, while retrofit and upgrade are projected to grow at a 3.75% CAGR through 2031.
Note: Market size and forecast figures in this report are generated using Mordor Intelligence’s proprietary estimation framework, updated with the latest available data and insights as of 2026.
Japan Aerospace and Defense Market Trends and Insights
Drivers Impact Analysis*
| Driver | (~) % Impact on CAGR Forecast | Geographic Relevance | Impact Timeline |
|---|---|---|---|
| Rising defense spending aligned with the 2% of GDP target | +0.50% | National, with procurement concentrated in Tokyo and the Nagoya industrial corridor | Short term (≤ 2 years) |
| Expansion of next-generation fighter aircraft and combat aviation programs | +0.30% | National, with early activity in Nagoya, Akashi, and Itami aerospace clusters | Medium term (2-4 years) |
| Government incentives for indigenous missile and hypersonic system development | +0.25% | National, concentrated in Nagoya and the Tokyo-Yokohama defense corridor | Medium term (2-4 years) |
| Post-pandemic recovery in commercial aviation MRO demand | +0.20% | Tokyo, Osaka, and Naha aviation hubs | Short term (≤ 2 years) |
| Build-out of defense satellite constellations supporting surveillance and targeting | +0.20% | National, with operational centers in Tsukuba and Tokyo | Short term (≤ 2 years) |
| Transition toward domestic MRO hubs under the US-Japan forward sustainment strategy | +0.10% | Naha, Misawa, and Iwakuni forward-basing hubs | Medium term (2-4 years) |
| Source: Mordor Intelligence | |||
Rising Defense Spending Aligned With The 2% Of GDP Target
Japan's FY2025 initial defense-related budget reached JPY 8.70 trillion (USD 55.11 billion), including SACO-related and US Forces realignment expenditures. In FY2026, the broader Ministry of Defense (MoD) defense budget exceeded JPY 9 trillion (USD 58 billion), while defense capability spending and complementary security initiatives across the government reached JPY 10.6 trillion (USD 67 billion). This funding supports continued procurement of stand-off missiles, naval vessels, aircraft, space capabilities, and other equipment with multi-year development and production cycles. As a result, demand in Japan's aerospace and defense market is increasingly driven by contract commitments that extend beyond individual annual expenditure cycles.[1]
The funding profile also supports order visibility for firms capable of delivering complex systems. IHI reported a record group order backlog of JPY 1.95 trillion (USD 12.94 billion) at the end of FY2025, representing an 11.6% increase from the prior year. The company's Aero Engine, Space, and Defense activities gain from sustained engine support and new defense development work. Large contracts can provide a durable workload, but they also require manufacturers to manage materials, skilled labor, testing capacity, and certification. The Japan aerospace and defense market is consequently becoming more dependent on the ability of major contractors to convert orders into deliveries.
Expansion Of Next-Generation Fighter Aircraft And Combat Aviation Programs
The Global Combat Air Programme (GCAP) is a major long-term combat aviation program involving Japan, the UK, and Italy. Japan has reportedly earmarked around JPY 700 billion (USD 4.44 billion) for initial R&D between 2023 and 2027. The program targets the first aircraft entering service in 2035, as Japan begins replacing its Mitsubishi F-2 fleet. GCAP is driving development across aircraft structures, propulsion, integrated sensing, communications, electronic systems, and weapons integration, creating long-term opportunities for Japanese aerospace and defense suppliers.[2]
In September 2026, GCAP Electronics Evolution received an 18-month contract from Edgewing to advance the fighter's Integrated Sensing and Non-Kinetic Effects and Integrated Communications Systems. The consortium includes ELT Group, Leonardo, Mitsubishi Electric, and Leonardo UK, with Mitsubishi Electric representing Japan in this electronics workstream. The program strengthens Japan's position in advanced sensing, communications, and electronic-effects integration within multinational combat-aircraft development, while increasing requirements for interoperability, secure system integration, and program-level engineering capabilities.
Government Incentives For Indigenous Missile And Hypersonic System Development
Japan's stand-off missile programs have moved from development toward operational deployment following the country's 2022 defense policy reforms. In March 2026, the MoD deployed the Type-25 Hyper Velocity Gliding Projectile at Camp Fuji and the Type-25 Surface-to-Ship Missile, formerly the upgraded ground-launched Type 12 SSM, at Camp Kengun. These were Japan's first operational deployments of domestically developed stand-off missiles. The Type-25 SSM is reported to have an extended range of approximately 1,000 km, compared with around 200 km for the original Type 12. However, the MoD does not publicly disclose detailed operational specifications for either system.
Japan is also expanding domestic missile-production capacity. ATLA contracted Mitsubishi Heavy Industries in December 2025 for JPY 43.44 billion (~USD 0.28 billion) of PAC-3 MSE procurement. Japan separately completed its first export of domestically produced PAC-3 interceptors to the United States in November 2025, demonstrating a deeper Japan-US missile-production relationship. The two countries are also jointly developing the Glide Phase Interceptor, with Japan responsible for areas including second-stage rocket motors, steering equipment, and propulsion and steering systems for the kill vehicle. Development is targeted for completion during the 2030s.
Build-Out Of Defense Satellite Constellations Supporting Surveillance And Targeting
Japan’s defense space activity is expanding from individual satellites toward a constellation model. In February 2026, the MoD and the Tri-Sat Constellation consortium signed a JPY 283 billion (~USD 1.82 billion) contract for a satellite imagery and constellation project. The consortium includes Mitsubishi Electric, SKY Perfect JSAT, Mitsui, Axelspace, Synspective, QPS Research Institute, and Mitsui Bussan Aerospace. The project supports surveillance, targeting, and detection requirements associated with stand-off missile operations. Operations are scheduled to begin in FY2026. The Japan aerospace and defense market can benefit from related demand for imagery, ground stations, communications, and data processing.
The constellation uses private-sector participants in a defense procurement activity that traditional prime contractors have historically led. Axelspace is the optical imagery provider under a JPY 48 billion (USD 309.02 million) subcontract. The arrangement brings commercial satellite operators closer to defense requirements for resilient imagery and timely data delivery. Planned AI-enabled analysis in orbit could further increase demand for space-qualified processing hardware and secure communications. This relationship links satellite investment with ground-based command, control, communications, computers, intelligence, surveillance, and reconnaissance systems. The market may therefore see space spending flow into several connected technology areas rather than remain confined to satellite manufacturing.
Restraints Impact Analysis*
| Restraint | (~) % Impact on CAGR Forecast | Geographic Relevance | Impact Timeline |
|---|---|---|---|
| Advanced manufacturing talent shortages and supply chain bottlenecks | -0.25% | National, most acute in Nagoya and Kobe-Nagasaki industrial corridors | Medium term (2-4 years) |
| Stringent export-control policies limiting production scale and market expansion | -0.20% | National, historically acute for missile and aircraft suppliers | Short term (≤ 2 years) |
| Dependence on foreign intellectual property and licensing for core defense platforms | -0.20% | National, especially licensed fighter engines and missile guidance subsystems | Long term (≥ 4 years) |
| Increasing cybersecurity and regulatory compliance costs for defense SMEs | -0.15% | National, with early cost burdens in Tokyo and Osaka | Medium term (2-4 years) |
| Source: Mordor Intelligence | |||
Stringent Export-Control Policies Limiting Production Scale
Japan's defense industry has historically relied heavily on domestic procurement, with restrictions on overseas transfers limiting manufacturers' ability to build production volume through export demand. The April 2026 revision of the Three Principles on Transfer of Defense Equipment and Technology removed the previous five-category restriction covering rescue, transportation, warning, surveillance, and minesweeping equipment. The revised framework allows a broader range of defense equipment, including weapons, to be considered for transfer to countries with which the United States has defense-equipment and technology transfer agreements, subject to National Security Council review, end-use controls, and other safeguards. At the time of the revision, 17 countries qualified under this framework; Canada's agreement entered into force in June 2026, expanding the group to 18 countries.
The policy change creates greater scope for Japanese manufacturers to increase production volumes and gain experience in international defense programs. Mitsubishi Heavy Industries' April 2026 contract to build the first three upgraded Mogami-class frigates for Australia reflects this shift, with initial construction at Mitsubishi Heavy Industries' Nagasaki Shipyard and the first vessel scheduled for delivery in December 2029. Export opportunities remain selective, however, as weapons transfers require government review, technology protection, specification adjustments, end-use controls, and restrictions on subsequent transfer. Japan's defense industry, therefore, remains primarily supported by domestic procurement, while overseas programs provide an additional route for production scale and international growth.
Advanced Manufacturing Talent Shortages And Supply Chain Bottlenecks
Japan's defense-production expansion is occurring alongside broader pressure on skilled technical labor and critical supply chains. NEC's Aerospace and National Security business hired approximately 750 employees in the year ended March 2024 and planned to expand headcount by a further 450 by March 2026, reflecting the additional workforce required as its defense and space activities expanded. More broadly, Japan continues to face strong competition for technical personnel as its working-age population declines and demand for engineering skills increases across advanced technology industries.
Supply-chain resilience is also being treated as a structural defense-industrial requirement rather than a temporary constraint. Japan's Defense Production Base Enhancement Act provides support for supply chain strengthening, manufacturing process efficiency, cybersecurity, and business succession. At the same time, the FY2026 defense budget allocates approximately JPY 95.7 billion (USD 0.64 billion) to reinforce the defense production base, including JPY 30.4 billion (USD 0.20 billion) for supply chain resilience and production efficiency initiatives. Capacity investment is already evident among major contractors: the MoD has highlighted automated, labor-saving welding at Mitsubishi Heavy Industries' Nagasaki facilities, which are simultaneously supporting domestic naval programs and preparations for Australia's upgraded Mogami-class frigates. The ability to expand the pool of qualified suppliers, automate production, and retain specialized engineering and manufacturing talent will therefore remain important for meeting growing aerospace and defense delivery schedules.
*Our forecasts treat driver/restraint impacts as directional, not additive. The impact forecasts reflect baseline growth, mix effects, and variable interactions.
Segment Analysis
By Industry: Defense Leads While Space Expands
Defense accounted for 46.20% of Japan aerospace and defense market in 2025. Its position is supported by major procurement programs covering frigates, combat aircraft, stand-off missiles, integrated air and missile defense (IAMD), sensors, and command-and-control (C2) systems. These programs typically involve high-value equipment and multi-year development, production, and sustainment cycles. Japan's April 2026 defense-export reforms also provide selected domestic manufacturers with a wider route to overseas demand, although domestic MoD procurement remains the primary revenue base for the segment.
Space is forecast to expand at a 3.41% CAGR through 2031, wherein growth is supported by increasing defense demand for persistent surveillance, targeting support, space-domain awareness, secure communications, and resilient satellite infrastructure. In February 2026, the MoD awarded the Tri-Sat consortium a JPY 283.12 billion (USD 1.83 billion) contract for satellite imagery and constellation services. The program expands demand beyond spacecraft manufacturing to include ground infrastructure, imagery processing, communications, payloads, analytics, and integration with broader C4ISR networks.

By Type: Platform Retains Scale While Systems Grow Faster
Platforms accounted for 54.15% of the Japan aerospace and defense market in 2025, driven by military aircraft, naval vessels, unmanned systems, satellites, and commercial aviation activity. Japan continues domestic participation in F-35 production and final assembly, while naval procurement includes the Mogami-class and the planned 12-vessel New FFM program. JMSDF commissioned JS Natori in May 2026 and JS Nagara in June 2026, while the final two vessels in the original 12-ship Mogami program are scheduled for delivery during FY2026.
Systems are projected to grow at a 3.62% CAGR through 2031. Demand is supported by stand-off weapons, IAMD, C4ISR, tactical communications, electronic warfare (EW), sensors, and secure digital networks. Type-25 surface-to-ship missiles, hyper-velocity glide weapons, PAC-3 MSE production, and hypersonic-defense development require supporting command, sensing, targeting, and communications architectures. Training and simulation requirements are also increasing as Japan introduces additional F-35 capabilities and progresses toward the GCAP next-generation fighter.
By Component: Propulsion Leads While Cyber Warfare Accelerates
Propulsion and power systems accounted for 18.80% of the Japan aerospace and defense market in 2025. The segment includes aircraft engines, marine propulsion, auxiliary power systems, and related lifecycle support. IHI manufactures and supports major defense aero-engine programs, including the F100 used on the F-15J/DJ, the F110 used on the F-2, and the F7-10 powering the P-1 maritime patrol aircraft. IHI's Aero Engine, Space and Defense segment generated JPY 651.7 billion (USD 4.36 billion) in FY2025 revenue. Continued engine sustainment and IHI's participation in GCAP power and propulsion development reinforce the importance of propulsion within Japan's aerospace and defense industrial base.[3]
Cyber warfare is forecast to grow at a 3.95% CAGR through 2031. Japan's cyber-policy framework has shifted toward active cyber defense, with the Cyber Response Capability Strengthening legislation being implemented in stages and key provisions scheduled to take effect from October 2026. MOD's Defense Buildup Program separately targets a cybersecurity posture capable of protecting C2 functions and high-priority equipment systems during cyberattacks by FY2027. This supports demand for secure software, cyber monitoring, network protection, resilient communications, and system-level cybersecurity across defense platforms. In June 2026, NEC and BAE Systems signed an MoU to jointly develop and deliver active cyber defense solutions for the Japanese government.
By Point Of Sale: OEM Dominates While Retrofit And Upgrade Advance
OEM procurement accounted for 69.45% of the total market value in 2025, making it the largest point-of-sale segment. New-build aircraft, naval vessels, missiles, satellites, propulsion systems, and associated mission equipment support this position. Japan's 12-vessel Mogami program and the planned 12-vessel New FFM acquisition illustrate the long procurement cycles associated with major platforms. At the same time, domestic participation in F-35 manufacturing continues to support the production of aircraft, engines, and components. OEM programs also generate downstream demand for structures, propulsion, electronics, radar, software, testing, spares, and sustainment across the domestic supply chain.
Retrofit and upgrade are forecast to expand at a 3.75% CAGR through 2031, with demand supported by capability upgrades to platforms that remain in service for extended periods. The MoD has funded Mk 41 VLS equipment for 10 FFM vessels, while JASDF continues modernization of the F-15J/DJ fleet's radar, electronic equipment, and onboard systems. Japan is also progressing the development and deployment of next-generation warning-and-control radar capabilities to strengthen the detection and tracking of advanced airborne and missile threats. These programs create recurring demand for equipment installation, systems integration, testing, software upgrades, electronics, and lifecycle support.
Geography Analysis
Japan's aerospace and defense industrial base is distributed across several specialized manufacturing and technology clusters. The Chubu and Greater Nagoya region is one of the country's most important aerospace centers, hosting Mitsubishi Heavy Industries' Nagoya Aerospace Systems Works and Nagoya Guidance & Propulsion Systems Works, Kawasaki Heavy Industries' Gifu and Nagoya aerospace facilities, and SUBARU's Handa aerospace plants. Mitsubishi Heavy Industries' Aircraft, Defense & Space segment generated JPY 1.39 trillion (USD 9.31 billion) in FY2025 revenue and is forecast to reach JPY 1.50 trillion (USD 10.02 billion) in FY2026, supported by higher activity in defense aircraft, missiles, and other programs.
Other production centers serve more specialized roles. KHI's Gifu facilities support aircraft manufacturing, while Akashi in Hyogo is an important aircraft-engine production base. Kobe has a stronger role in naval and submarine activity, while Nagasaki is a major center for surface-vessel construction. Under the New FFM program, ATLA selected Mitsubishi Heavy Industries as the prime contractor and Japan Marine United as the subcontractor, establishing a structured division of responsibilities for ship design and construction. Mitsubishi Heavy Industries' Nagasaki Shipyard will also construct the first three upgraded Mogami-class frigates ordered by Australia, extending the site's workload into an international naval program. Tokyo and the wider Kanto region form the core of procurement coordination, defense electronics, communications, cyber, space systems, and systems integration. The MoD and ATLA are headquartered in Ichigaya, Tokyo, while NEC, Mitsubishi Electric, and other major electronics companies maintain substantial defense activities in the region. IHI's Mizuho aero-engine facility is also located in Tokyo, while SUBARU's principal aerospace manufacturing complex is in Utsunomiya, Tochigi. NEC's Aerospace/Defense activities generated JPY 473.6 billion (USD 3.17 billion) in FY2026/3 and are forecast to reach JPY 520 billion (USD 3.48 billion) in FY2027/3.
The region's systems-integration role is also strengthening. In September 2026, NEC and Mitsubishi Heavy Industries signed an MoU covering operational planning, command and control, unmanned assets, cloud-integrated defense operations, and data and AI sovereignty. The partnership reflects closer integration among traditional platform engineering, software, data, AI, and secure command architectures within Japan's defense industrial base. Operational demand extends beyond the main industrial centers.
The MoD continues to strengthen force posture across Kyushu and the Southwest Islands, including missile, air defense, ISR, EW, and logistics capabilities. In March 2026, the first Type-25 surface-to-ship missile was deployed at Camp Kengun in Kumamoto, while the first Type-25 HVGP was deployed at Camp Fuji in Shizuoka. Hokkaido also remains an important ground-force region, hosting the Northern Army headquarters and major armored, artillery, missile, and support formations. These deployments generate continuing requirements for infrastructure, sustainment, maintenance, communications, and equipment support outside Japan's primary manufacturing clusters.
Regulatory Landscape
Japan's defense procurement and industrial policy framework is centered on the MoD and the Acquisition, Technology and Logistics Agency (ATLA), which oversees defense equipment acquisition, R&D, project management, and the strengthening of the industrial base. The Act on Enhancing Defense Production and Technology Bases (Act No. 54 of 2023) provides financial support for supply chain resilience, production efficiency, cybersecurity, and business succession. It allows government ownership of manufacturing facilities where necessary to ensure stable production. Japan's Rapid Acquisition Program supports faster introduction of advanced technologies, including stand-off defense, unmanned systems, AI, next-generation communications, space, and integrated information warfare capabilities.
Export controls have constrained scale, but the policy direction has shifted through successive updates. Revised transfer rules issued in March 2024 broadened pathways for third-country sales of co-developed systems. In April 2026, Cabinet-level changes abolished earlier restrictive equipment categories and expanded the scope for exports of lethal equipment to partner nations that have Defense Equipment and Technology Transfer Agreements with Japan. On the technology-governance side, ATLA issued national guidelines in June 2025 for the responsible use of AI in defense equipment R&D, introducing a risk management process (classification plus legal/policy and technical reviews) that increases compliance requirements for contractors and subsystem suppliers involved in autonomy, decision-support, and sensing applications.
Value Chain Analysis
Japan's aerospace and defense value chain is anchored by the MoD's procurement, R&D, and capability requirements, with ATLA playing a central role in defense equipment acquisition, technology development, industrial base strengthening, and industrial security. Major platform contractors such as Mitsubishi Heavy Industries and Kawasaki Heavy Industries are supported by defense-electronics and mission-system suppliers, including Mitsubishi Electric and NEC, as well as a broader network of specialized suppliers in components, materials, manufacturing, and technology.
The production base has been further strengthened through the 2023 Defense Production Base Enhancement Act. Under this law, suppliers of designated defense equipment can submit Equipment Stable Manufacturing Assurance Plans that cover areas such as supply chain resilience, manufacturing process efficiency, cybersecurity, and business succession. Once approved, these plans can receive government financial support, providing a structured mechanism to address production risks and strengthen critical suppliers.
Upstream inputs include advanced materials (notably composites and specialty metals), semiconductors and avionics-grade components, propulsion subassemblies, and secure communications elements. Midstream activities cover design authority (often shared with allied partners for key subsystems), prototype development, testing, and serial manufacturing across air, land, naval, and space programs, with MRO increasingly important as fleet sizes expand. Downstream delivery and sustainment run through SDF depots and prime-led support networks, supported by allied sustainment cooperation. The US-Japan DICAS working-level alignment on missile-related cooperation, ship repair, and aircraft maintenance also expands pathways for Japanese yards and aviation MRO providers to participate in allied logistics and readiness requirements.
Competitive Landscape
The Japanese aerospace and defense industry has a concentrated prime-contractor structure supported by a broad multi-tier supplier base. FY2025 ATLA central-procurement data show Mitsubishi Heavy Industries as the largest Japanese contractor by contract value, followed by Mitsubishi Electric, Kawasaki Heavy Industries, NEC, and Fujitsu. IHI also remains strategically important through its involvement in aero engines, propulsion, space, and missile-related activities. Mitsubishi Heavy Industries holds the broadest domestic position across aircraft, missiles, naval vessels, land systems, and space. Its Aircraft, Defense & Space segment generated JPY 1.39 trillion (USD 9.31 billion) in revenue in FY2025, including JPY 1.14 trillion (USD 7.65 billion) from Defense & Space activities.
Kawasaki Heavy Industries holds major positions in military aircraft, helicopters, aerospace components, aircraft engines, and naval systems, while IHI is strong in aero engines, propulsion, missiles, and space. NEC and Mitsubishi Electric are key suppliers of radar, sensors, C2, communications, space systems, and EW technologies. The September 2026 NEC Corporation–Mitsubishi Heavy Industries, Ltd. alliance reflects the growing integration of traditional defense platforms with AI, unmanned systems, cloud-enabled operations, and secure command architectures. Foreign companies also maintain a significant presence, with Lockheed Martin linked to the F-35 program, BAE Systems involved in GCAP and cyber cooperation, Boeing active across commercial aviation and defense, and Northrop Grumman supplying advanced airborne systems.
Cross-border collaboration is becoming increasingly important to the competitive landscape. Mitsubishi Electric participates in the GCAP Electronics Evolution consortium with ELT Group, Leonardo, and Leonardo UK to develop integrated sensing, non-kinetic effects, and communications capabilities for the future fighter. Mitsubishi Heavy Industries is also expanding internationally through its April 2026 contract to supply three upgraded Mogami-class frigates to Australia. These developments indicate that Japan's aerospace and defense industry remains centered on a small group of large domestic prime contractors, while international partnerships, joint development programs, and selected export opportunities are becoming more important to future growth.
Japan Aerospace and Defense Industry Leaders
-
Mitsubishi Heavy Industries, Ltd.
-
Kawasaki Heavy Industries, Ltd.
-
IHI AEROSPACE Co., Ltd.
-
NEC Corporation
-
The Boeing Company
- *Disclaimer: Major Players sorted in no particular order
Market Opportunities and Future Outlook
A near-term opportunity exists in expanding production capacity and export-ready defense systems as Japan broadens access to overseas markets. The April 2026 revision of the Three Principles on Transfer of Defense Equipment and Technology removed previous restrictions that limited exports to five categories, allowing a wider range of defense equipment to be considered for transfer under case-by-case controls. This creates opportunities for Japanese prime contractors and subsystem suppliers to increase production volumes, reduce unit costs, and strengthen manufacturing capacity for domestic and allied requirements. This opportunity is further supported by growing GCAP industrial activity and MOD investment in EW, sensor networks, resilient communications, and integrated C2 capabilities.
Unmanned and multi-domain capabilities present another opportunity corridor, supported by FY2026 acquisition emphasis and program structure. MoD’s FY2026 budgeting for unmanned assets under the SHIELD program signals a funded pathway for domestic payload suppliers, mission software, datalinks, and maritime-air integration, complementing collaboration moves such as Kawasaki Heavy Industries and Airbus Defence and Space exploring long-endurance UAS cooperation for anti-submarine warfare (June 2026). Capacity expansion in adjacent defense manufacturing also creates supplier space: Japan Steel Works commenced operations at a new assembly shop at its Hiroshima Plant in May 2026 and continued expanding capacity at Muroran to meet defense demand, including artillery and missile canisters. This points to sustained pull-through for machining, specialty materials, and inspection/testing services across the ordnance and missile supply chain.
Recent Industry Developments
- September 2026: Japan-based Tenchijin signed a Memorandum of Understanding (MoU) with France's U-Space to support the development and deployment of a next-generation infrared Earth observation system. The partnership expands Tenchijin's international collaboration in satellite-based Earth observation and strengthens Japan's involvement in advanced infrared sensing technologies.
- June 2026: Kawasaki Heavy Industries signed a memorandum of understanding with Airbus Defence and Space to explore collaboration on long-endurance unmanned aerial systems for anti-submarine warfare (ASW) missions. The work links UAS endurance and payload integration with Japan-centric maritime patrol concepts, creating partnering routes for sensors, mission systems, and sustainment services tied to ASW operations.
- December 2025: Kongsberg Defence and Aerospace signed a fifth follow-on contract with Japan to supply the Joint Strike Missile (JSM) for the F-35A fleet. The continued JSM procurement supports long-range stand-off strike capacity and sustains demand for integration, training, and support across the F-35 weapons ecosystem.
Research Methodology Framework and Report Scope
Market Definition and Coverage
This market tracks the value of aerospace and defense goods and related services delivered within Japan, covering platform programs and aftermarket work that support civil and military operations.
Scope exclusions: We exclude purely internal government wages, veteran benefits, and civil infrastructure spend that is not tied to aerospace and defense equipment or related services.
Segmentation Overview
- By Industry
- Aviation
- Defense
- Space
- By Type
- Platforms
- Commercial Aviation
- General Aviation
- Military Land Vehicles
- Military Aircraft
- Military Naval Vessels
- Unmanned Systems
- Satellites
- Systems
- Weapons and Munitions
- Sensors
- C4ISR and Tactical Communications
- Electronic and Cyber Warfare Systems
- Air and Missile Defense
- Soldier Systems
- Military Infrastructure
- Training and Simulation
- MRO
- Military MRO
- Commercial aviation MRO
- General Aviation MRO
- Platforms
- By Component
- Structures and Materials
- Propulsion and Power Systems
- Mission Payload
- Sensors
- Electronics
- Communications
- Cyber Warfare
- Software and Digital Systems
- Services and Sustainment
- By Point of Sale
- Original Equipment Manufacturer (OEM)
- Retrofit/Upgrade
Data Sources, Market Sizing, and Validation
Desk Research
For this Japan-specific market, we started by mapping the demand side first, then checked what can be supplied domestically versus what is typically imported. Public sources help anchor the model to observable signals, such as Japan defense budget releases and procurement policy changes, which matter in a market shaped by multi-year programs.
Key non-paywalled sources used for inputs and cross-checks include official Japan defense budget and policy releases (such as from the Ministry of Defense), Cabinet-level strategy documents, and trade and tariff statistics (such as from UN Comtrade). We also used IMF and World Bank macro series for inflation and FX context, and aerospace industry publications from trade bodies such as the Society of Japanese Aerospace Companies. We reviewed company filings, investor presentations, and reputable press coverage to validate program timing and service activity. Where needed, we referenced paid subscriptions for company financials, news and financials, patent databases, and defense related market information to resolve unclear values. These examples are not exhaustive, and many other sources were reviewed for data collection, validation, and clarification.
Primary Interviews and Surveys
Primary interviews and surveys were used to pressure-test items desk research cannot confirm well, especially program phasing, typical contract structures, and how much work is booked as manufacturing versus MRO in Japan. We spoke with a mix of supply-chain participants, program and engineering leaders, and buyer-side stakeholders so our assumptions on volumes, pricing movement, and delivery schedules could be corrected where required.
Distribution of primary research fieldwork respondents
| Company type | Respondent position | Region |
|---|---|---|
| Top tier: 28% | CXOs: 13% | |
| Mid tier: 56% | Functional/Unit leaders: 28% | |
| Smaller Players: 16% | Managers: 59% |
Market-Sizing & Forecasting
Market sizing was built using top-down and bottom-up checks. On the top-down side, Japan defense budget and acquisition signals were converted into an addressable equipment and services pool, then split by platform activity visible through program announcements and fleet modernization priorities. We corroborated these totals through selective bottom-up approximations, using sampled ASP-by-volume logic for major platform work and aftermarket intensity checks, then adjusted totals when the two views did not align.
To keep the model grounded, we tracked a short list of fingerprints practitioners could validate, including defense budget allocation direction, major platform delivery and upgrade schedules, MRO share versus new-build mix, engine and mission-system dependency on foreign design authority, and FX timing for imported content. When gaps appeared in supplier roll-ups or when a program value could not be cleanly allocated across years, we filled them using conservative ranges agreed in interviews and narrowed them through follow-up checks.
For the forecast, we relied on scenario analysis supported by trend consensus from primary respondents. This approach tends to fit better than a single curve fit when program timing and policy shifts change yearly spending. Assumptions were then converted into yearly growth paths so the forecast stays traceable to a small set of drivers rather than opaque growth rates.
Data Validation & Update Cycle
We ran multiple checks so totals stay consistent with real-world constraints. Model outputs were compared against independent signals, such as Japan budget growth, announced procurement batches, and visible aerospace production activity, then reviewed for spikes that could not be explained by program timing.
Before sign-off, variance checks were completed across sector and platform splits so the sum of parts stays logical when rolled up. If a major discrepancy remained, we re-contacted selected interviewees to confirm whether it came from scope interpretation, price movement, or timing. Reports are refreshed annually, with interim updates when material events occur, and a final pre-delivery review is completed so clients receive the latest updated view.
Mordor Intelligence's Japan Aerospace and Defense Market Estimate Compared With Other Published Estimates
Published market sizes for Japan aerospace and defense can differ even when the topic label looks similar, because each publisher sets its own boundaries on what counts as aerospace, what counts as defense, and how services like MRO are treated. Differences also come from the year chosen for the headline number and how currency and inflation are handled.
By tracking program-level manufacturing versus MRO splits and refreshing FX timing assumptions, Mordor Intelligence keeps the Japan total tied to deliverable equipment and service activity in-country, which helps reduce over-counting from adjacent security spending or broad national budget aggregates.
Benchmark comparison
| Source | Market Size | Gaps in Research Methodology |
|---|---|---|
| Mordor Intelligence | USD 67.83 B (2025) | |
| Industry Blog A | USD 55.00 B (2024) | Uses an earlier base year and appears to apply a broader packaged total without clearly separating manufacturing from MRO timing, which can understate current program ramp-ups and imported-content value when FX shifts. |
| Market Publisher B | USD 55.00 B (2024) | Relies on a rounded headline number and a wide scope narrative, and the treatment of defense budget figures versus actual procurement and service execution is not made transparent, which can compress the market total. |
The spread in estimates mostly comes from base-year choice and how spend is translated into actual delivered equipment and services. When the boundary is kept consistent across platforms and service types, the resulting market value becomes easier to audit, explain, and update as programs and budgets change.
Key Questions Answered in the Report
What is the forecast growth rate for Japan aerospace and defense through 2031?
The Japan aerospace and defense market is forecast to grow at a 2.03% CAGR from 2026 to 2031, reaching USD 28.29 billion.
Which segment held the largest share in 2025?
Defense led the industry segmentation with 46.20% share, while platforms led the type segmentation with 54.15% share.
Which category is growing the fastest?
Cyber warfare is the fastest-growing component, with a forecast CAGR of 3.95% through 2031.
Why is space activity important to Japan's defense programs?
The JPY 283 billion (~USD 1.82 billion) satellite constellation project supports surveillance, targeting, and detection linked to stand-off missile operations.
What supports retrofit and upgrade demand?
F-15J avionics and radar upgrades, as well as Mogami-class vertical launch system additions, support a 3.75% forecast CAGR.
Which companies are prominent in the sector?
Mitsubishi Heavy Industries, Kawasaki Heavy Industries, IHI Aerospace, and NEC Corporation are key domestic players in the Japanese aerospace and defense market. Major international companies, including The Boeing Company, also operate in the market.