Market Overview
| Study Period | 2019 - 2031 |
|---|---|
| Forecast Data Period | 2026 - 2031 |
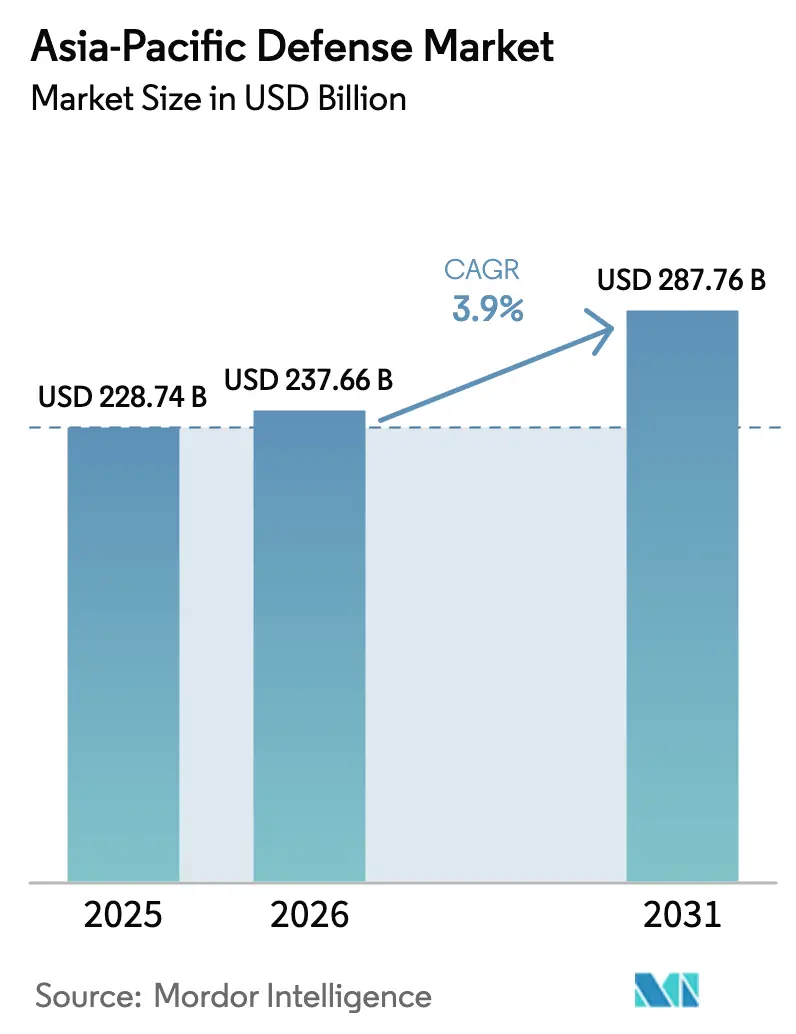
| Base Year Market Size (2025) | USD 228.74 Billion |
| Market Size (2026) | USD 237.66 Billion |
| Market Size (2031) | USD 287.76 Billion |
| Growth Rate (2026 - 2031) | 3.90% CAGR |
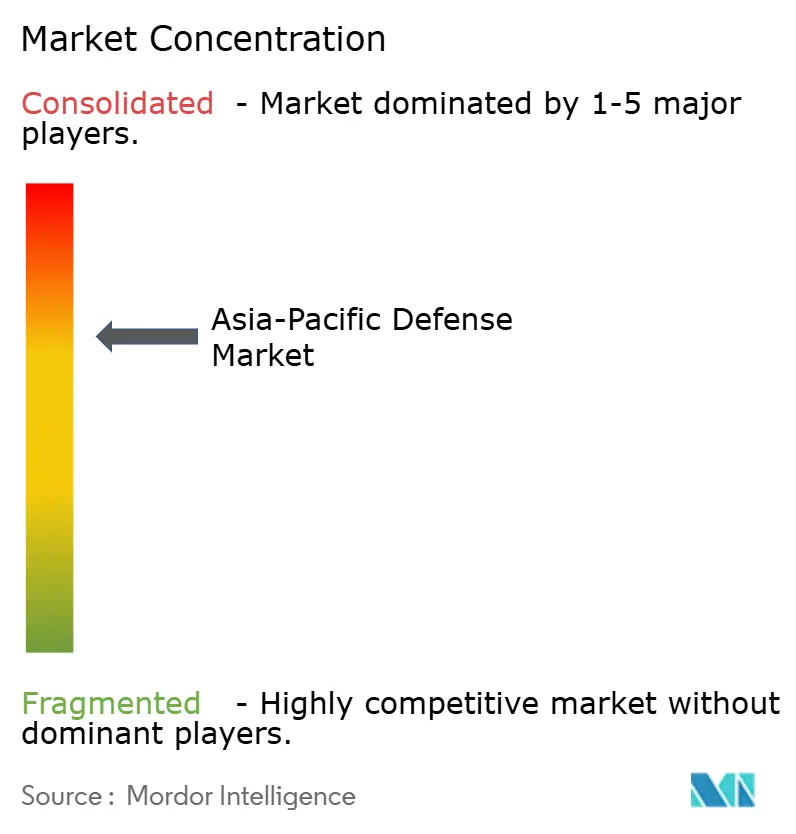
| Market Concentration | Medium |
Major Players *Disclaimer: Major Players sorted in no particular order Image © Mordor Intelligence. Reuse requires attribution under CC BY 4.0. | |
Asia-Pacific Defense Market Analysis by Mordor Intelligence
The Asia-Pacific defense market size is expected to grow from USD 228.74 billion in 2025 to USD 237.66 billion in 2026 and is forecasted to reach USD 287.76 billion by 2031 at a 3.9% CAGR over 2026-2031. Sustained spending is shaped by China's naval build-up, shifting offset rules, and semiconductor export controls that slow high-end imports. Army programs still command the most significant budgets, yet maritime systems are advancing the fastest as coastal nations fortify sea-lane security. Indigenous manufacturing is gaining momentum in India through the Atmanirbhar Bharat initiative and in South Korea with the KF-21 program, even as foreign primes face tightening localization thresholds. Unmanned, AI-enabled, and space-based capabilities are dominating new orders, while budget pressures in some ASEAN capitals are creating near-term troughs that test supplier resilience.
Key Report Takeaways
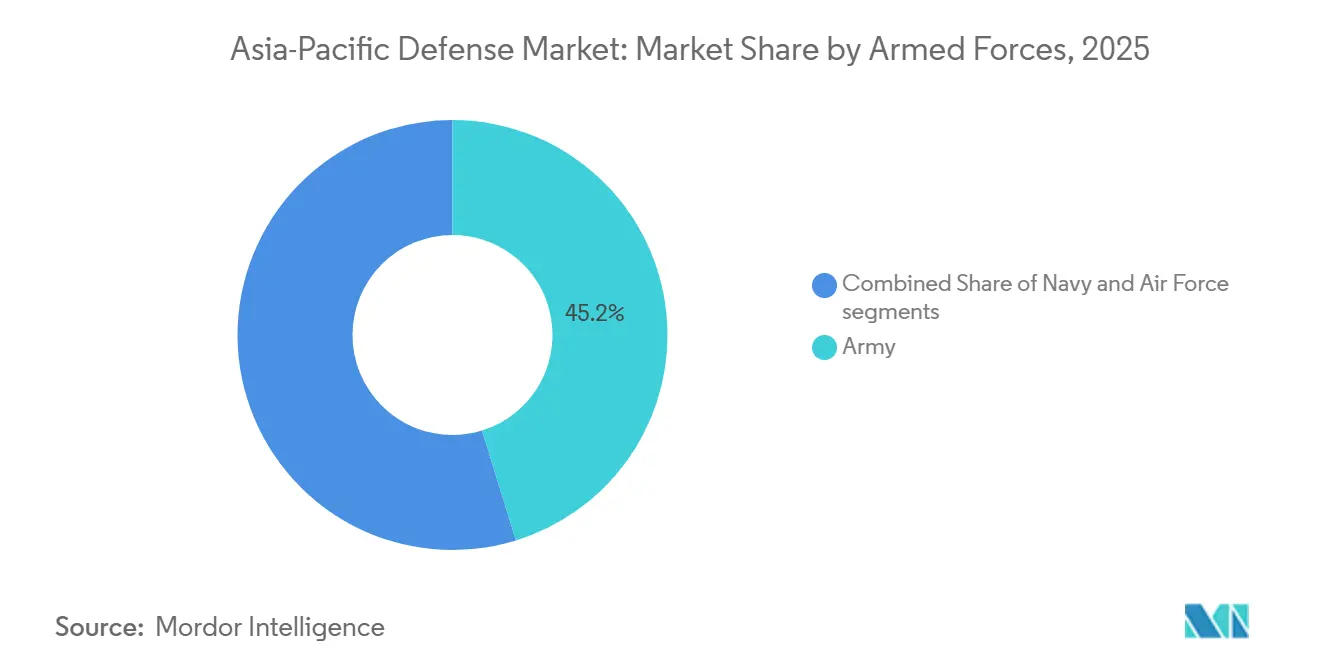
- By armed forces, naval platforms held 45.23% of the Asia-Pacific defense market share in 2025, and are projected to grow at a 4.76% CAGR through 2031.
- By type, weapons and ammunition accounted for 31.25% of the Asia-Pacific defense market in 2025, while unmanned systems are forecast to grow at a 5.98% CAGR through 2031.
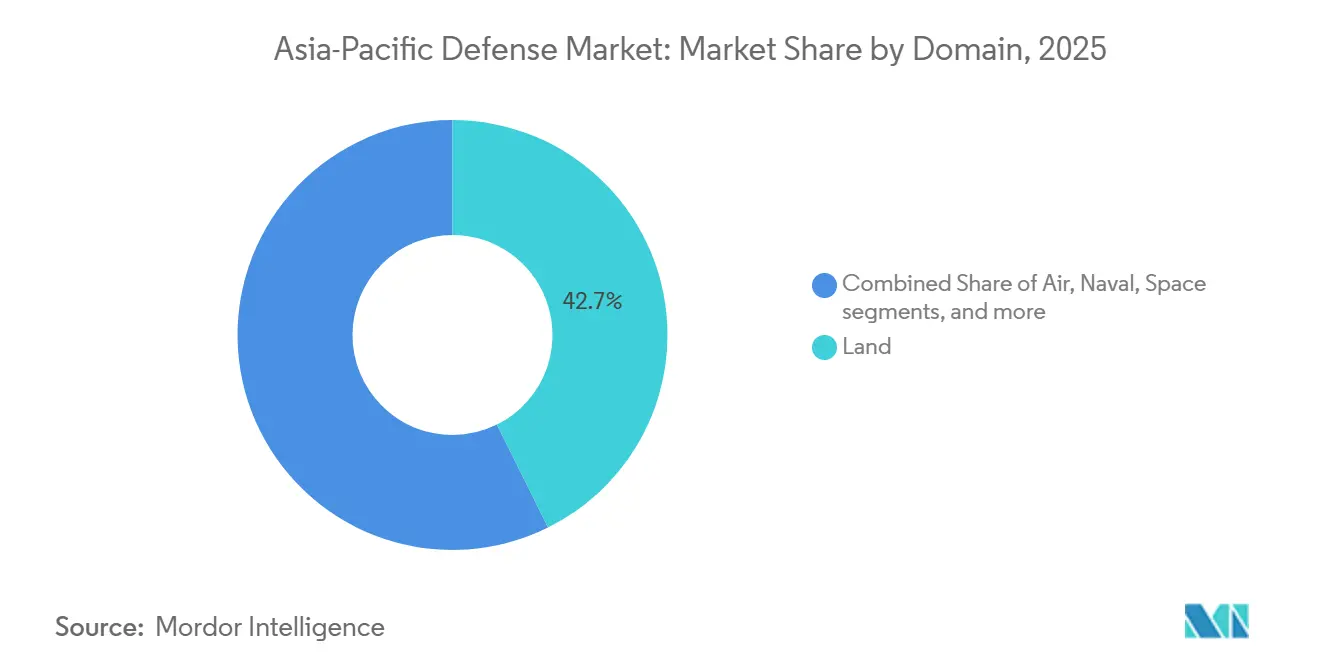
- By domain, land systems accounted for 42.67% of the Asia-Pacific defense market share in 2025; space assets are projected to grow at a 5.65% CAGR through 2031.
- By nature of procurement, indigenous production accounted for 47.03% of spending in 2025 and is forecast to grow at a 5.52% CAGR through 2031.
- By geography, China accounted for 48.43% of the Asia-Pacific defense market share in 2025, and India is forecast to grow at a 5.24% CAGR through 2031 under revised local-content rules.
Note: Market size and forecast figures in this report are generated using Mordor Intelligence’s proprietary estimation framework, updated with the latest available data and insights as of January 2026.
Asia-Pacific Defense Market Trends and Insights
Drivers Impact Analysis*
| Driver | (~) % Impact on CAGR Forecast | Geographic Relevance | Impact Timeline |
|---|---|---|---|
| Strategic pivot to contested Indo-Pacific sea lanes | +1.20% | ASEAN littoral states, Japan, Australia, Taiwan | Medium term (2-4 years) |
| Indigenous defense-industrialization policies | +1.00% | India, South Korea, Japan, Australia | Long term (≥ 4 years) |
| Proliferation of unmanned and autonomous systems | +0.90% | Global early adopters: India, China, South Korea | Short term (≤ 2 years) |
| China’s force-modernization ripple effect | +0.90% | Japan, Taiwan, Philippines, Vietnam | Short term (≤ 2 years) |
| AI-enabled C4ISR and decision platforms | +0.80% | China, Japan, Australia, Singapore | Medium term (2-4 years) |
| AUKUS and Quad technology-sharing initiatives | +0.70% | Australia, India, Japan, US partners | Long term (≥ 4 years) |
| Source: Mordor Intelligence | |||
Strategic Pivot to Contested Indo-Pacific Sea Lanes
Freedom-of-navigation operations in the South China Sea and Taiwan Strait have redirected budgets from land armor to maritime strike, mine countermeasures (MCM), and anti-submarine warfare (ASW). China commissioned eight 10,000-ton coast guard cutters in 2025, blurring the lines between civilian and military roles and prompting neighbors to upgrade their frigates and offshore patrol vessels. Japan added Mogami-class frigates with vertical-launch cells, while Australia reallocated USD 7.20 billion from armored vehicles to destroyer upgrades and MH-60R helicopters. The Philippines and Vietnam accelerated the acquisition of patrol ships and the development of logistics hubs to sustain more extended deployments. A USD 9.90 billion US Pacific Deterrence Initiative for pre-positioned stocks further drives the adoption of common data links across allied navies.[1]U.S. Department of Defense, “Pacific Deterrence Initiative Budget,” defense.gov
Indigenous Defense-Industrialization Policies
Revised offset schemes now emphasize intellectual-property co-development over screwdriver assembly. India reserves 68% of capital spending for “Buy Indian” categories and blocks exports of co-developed platforms without local majority content, pushing Lockheed Martin and GE to transfer wing-box and engine hot-section know-how. South Korea mandates 70% local content on the KF-21, enabling the production of domestic AESA radar that halves the unit cost compared to Western alternatives. Japan relaxed export curbs on jointly built systems, positioning Mitsubishi Electric to sell air-defense radars across the region. Australia’s Sovereign Guided Weapons Enterprise establishes a southern-hemisphere missile hub, while Indonesia’s tank program with Turkey highlights the risk of execution when local maturity is lower.
Proliferation of Unmanned and Autonomous Systems
Lessons from the combat in Ukraine are pushing quadcopter swarms, loitering munitions, and extra-large unmanned underwater vehicles (XLUUVs) into core procurement plans. India fielded Nagastra-1 loitering rounds along the Himalayas, delivering squad-level precision strike without artillery coordination. South Korea demonstrated 50-drone swarms maneuvering in GPS-denied zones, and Australia’s Ghost Shark UUV achieved 60-day submerged endurance at a fraction of crewed-sub costs. Japan and Singapore integrate AI target recognition on unmanned surface and aerial platforms, reducing analyst workloads and enhancing time-sensitive targeting.
AI-Enabled C4ISR and Decision Platforms
Tier-1 militaries compress kill-chain cycles by integrating satellite, airborne, and maritime sensors into a shared operating picture. China’s Integrated Network Electronic Warfare architecture links early-warning radars and cyber units, reducing decision loops to under ten minutes. Japan’s destroyers fire SM-6 missiles guided by F-35 data, decoupling sensors from shooters. Australia’s JP9102 upgrade consolidates Link 16, MADL, and SATCOM feeds, thereby reducing the risk of friendly fire in coalition drills. India’s nationwide IACCS now governs S-400 batteries, Akash missiles, and fighters under an AI threat-prioritization engine.
Restraints Impact Analysis*
| Restraint | (~) % Impact on CAGR Forecast | Geographic Relevance | Impact Timeline |
|---|---|---|---|
| Export-control squeeze on chips and advanced weapons | -0.90% | India, Singapore, Indonesia | Short term (≤ 2 years) |
| Budget pressure from post-pandemic debt loads | -0.70% | ASEAN nations, Pacific islands | Medium term (2-4 years) |
| Fragmented offsets and localization rules | -0.50% | India, Indonesia, Malaysia, Vietnam | Long term (≥ 4 years) |
| Defense-engineering/cyber-talent shortages | -0.40% | Japan, South Korea, Australia, Singapore | Medium term (2-4 years) |
| Source: Mordor Intelligence | |||
Export-Control Squeeze on Chips and Advanced Weapons
US and allied curbs on gallium-nitride semiconductors and AI accelerators have pushed back the schedules for next-generation fighters and missiles by up to three years. India’s Uttam AESA radar slipped when 7 nm RF modules were blocked at TSMC, and Japan’s F-35 sustainment costs climbed 22% as spare parts awaited export licenses.[2]Demetri Sevastopulo, “Chip Curbs Hit Asian Weapons,” ft.com Australia’s Loyal Wingman drone has been equipped with commercial GPUs, accepting lower processing speeds to meet its schedule. South Korea undertook a costly indigenous IMU program after US suppliers declined to export IMUs that met ITAR specifications.
Budget Pressure from Post-Pandemic Debt Loads
Indonesia, Thailand, and the Philippines are redirecting funds to economic recovery, lowering defense outlays as a share of GDP and deferring frigate and fighter purchases into the 2030s. Indonesia cut its defense spending to 0.74% of GDP in 2025, canceling additional Rafale jets and extending payments for the KF-21. Thailand shelved a second Type 26 frigate to finance flood-control works. The Philippines’ USD 4.1 billion budget leaves little for air-defense modernization.
*Our forecasts treat driver/restraint impacts as directional, not additive. The impact forecasts reflect baseline growth, mix effects, and variable interactions.
Segment Analysis
By Armed Forces: Navy Outpaces Land Forces
Naval programs account for 45.23% of spending in 2025 and are growing at a 4.76% CAGR as littoral states reinforce sea-lane security and undersea cable protection. The Asia-Pacific defense market size for naval platforms is set to overtake incremental land-system budgets by 2029. Army systems remain sizable, driven by artillery upgrades along the Himalayas and South Korean armored-vehicle recapitalization, yet see only 3.68% growth. India’s USD 2.80 billion Future Infantry Combat Vehicle (FICV) order and Japan’s 105-strong F-35 fleet illustrate ongoing investments in both ground and air capabilities, but the strategic narrative favors blue-water denial capabilities.[3]Dinakar Peri, “India Orders Future Infantry Combat Vehicles,” economictimes.indiatimes.com
The adoption of nuclear propulsion under SSN-AUKUS, Li-ion submarine batteries in South Korea, and F-35B carriers in Japan signals a shift toward distributed maritime strike. Australia’s eight SSN-AUKUS boats, valued at AUD 368 billion (USD 246.14 billion), will transform regional undersea balances, while South Korea’s Dosan Ahn Changho subs add vertical-launch strike options. India’s Project 75I lags in offsets, yet the commissioning of the BrahMos-armed INS Imphal underscores indigenous progress. Smaller ASEAN navies are pursuing offshore patrol vessels and mobile coastal defense missiles to quickly close capability gaps.


By Type: Unmanned Systems Disrupt Legacy Platforms
Weapons and ammunition commanded 31.25% of the Asia-Pacific defense market share in 2025, underpinned by missile stockpiles along flashpoints. Growth moderates as export controls bite, while unmanned platforms earn the fastest 5.98% CAGR. Swarm drones, loitering munitions, and autonomous surface craft are shifting force-structure doctrine and consuming 8-12% of new capital budgets by 2028. C4ISR and electronic-warfare (EW) systems, which already account for 22% of spending, are expected to rise steadily through the use of AI-enabled sensor fusion. Space and cyber systems, though small today, receive priority as militaries seek resilient communications and spectrum dominance.
Demand for precision artillery sustains South Korea’s K9 howitzer exports and India’s BrahMos missile orders, yet planners increasingly pair these with AI targeting from low Earth orbit (LEO) satellites. Japan’s FPS-7 radar and Australia’s LAND 400 Phase 3 programs show continued sensor and vehicle refresh. At the same time, India’s Ghatak UCAV and Australia’s Ghost Shark UUV mark the transition from manned to autonomous strike assets.
By Domain: Space Emerges as Fifth Warfighting Arena
Land capabilities remain the largest slice at 42.67% in 2025, but space assets exhibit the highest growth at 5.65% CAGR as joint operations demand secure positioning, navigation, and reconnaissance. China’s 38 military-satellite launches in 2025 compelled Japan to accelerate Quasi-Zenith augmentation and Australia to invest in protected SATCOM. Air and naval domains converge around multi-domain command nodes, adding pressure for spectrum and cyber resilience. Cyber commands in Japan and microwave counter-drone weapons in South Korea demonstrate that electromagnetic effects are now core mission areas.
By Procurement Nature: Indigenous Production Gains Momentum
Indigenous programs accounted for 47.03% of spending in 2025 and are expected to rise at a 5.52% CAGR, narrowing the gap with foreign purchases. The Asia-Pacific defense market size tied to local manufacturing grows as India’s Tejas Mk1A ramp-up, South Korea’s KF-21 localization, and Australia’s missile enterprise mature. Foreign procurement continues for nuclear submarines and tankers, where the regional industry lacks depth. However, joint-venture models, such as the Lockheed-Tata wing box and the Raytheon-Australia missile co-production, now dominate, ensuring that technology remains local and export approvals become less contentious.
Geography Analysis
China accounted for 48.43% of regional spending in 2025, but budget growth slowed to a 3.2% CAGR as the PLA prioritized nuclear propulsion and hypersonic R&D over force-structure growth. India is expected to accelerate at a 5.24% CAGR, driven by indigenous procurement, with a capital outlay of USD 28.60 billion in 2026 and channeling 75% of the funds to domestic suppliers, subject to stringent offset penalties for foreign primes. Japan’s USD 320 billion multi-year plan funds stand-off missiles and cyber forces that reverse seven decades of purely defensive posture.
Australia undertakes the region’s largest single program with AUD 368 billion (USD 246.14 billion) for SSN-AUKUS submarines, but gaps remain until deliveries begin in 2040, prompting interim leases of the Virginia-class. South Korea leverages export momentum, USD 17 billion in 2024, selling howitzers and aircraft to NATO allies and ASEAN partners at aggressive price points. ASEAN collectively spends 12% of the regional total yet grapples with fiscal constraints. Singapore tops the list in per-capita spending by purchasing F-35Bs and Invincible-class submarines, while Indonesia, Thailand, and Vietnam defer major programs due to debt pressures. The Philippines breaks the trend by procuring BrahMos missiles to offset delays in US Foreign Military Sales (FMS).
Competitive Landscape
The Asia-Pacific defense market exhibits moderate concentration, with the top five primes, Lockheed Martin Corporation, RTX Corporation, The Boeing Company, Aviation Industry Corporation of China, and Northrop Grumman Corporation, holding a significant share of the revenue. Meanwhile, AVIC, HAL, Mitsubishi Heavy, and Hanwha capture the majority of indigenous contracts through mandated offsets. Joint ventures that mix Western subsystems with regional production dominate new awards, such as GE’s F414 transfer to India’s AMCA and Lockheed-Tata C-130J structures. South Korea’s Hanwha and Korea Aerospace Industries are disrupting the market by offering pricing 30-40% lower than the competition while maintaining full NATO compliance, as evidenced by Poland’s USD 12.40 billion K2 and K9 purchases.[4]Vivienne Machi, “Hanwha Wins $2.1 Billion Australia Deal,” defensenews.com
Export-control friction over gallium nitride (GaN) and AI chips delays F-35 deliveries to Singapore and India’s AMCA timetable, steering customers toward European or Israeli systems less encumbered by U.S. ITAR restrictions. Elbit Systems’ USD 350 million sale of the Hermes 900 to Singapore and Israel Aerospace Industries’ 70%-local MR-SAM partnership with Bharat Electronics demonstrate how ITAR-free paths are gaining favor. Patent filings in autonomous navigation increased by 42% in 2024, with AVIC, Hanwha, and DRDO leading the way, underscoring the rapid pace of regional innovation.
Asia-Pacific Defense Industry Leaders
Lockheed Martin Corporation
The Boeing Company
Aviation Industry Corporation of China
Northrop Grumman Corporation
RTX Corporation
- *Disclaimer: Major Players sorted in no particular order

Recent Industry Developments
- July 2026: Indonesia and India signed a USD 630 million contract for the BrahMos cruise missile system. Under the contract terms, India will supply the BrahMos cruise missile system and the Astra air-to-air missile to Indonesia.
- December 2025: Fincantieri, through its subsidiary WASS Submarine Systems, received a substantial order from the Indian Navy for the supply of Black Shark Advanced (BSA) heavyweight torpedoes. These torpedoes will be deployed on the six Scorpène-class submarines currently in service with the Indian fleet.
- October 2025: Japan awarded Mitsubishi Heavy Industries two contracts to initiate mass production of a submarine-launched guided missile and an enhanced Type 12 surface-to-ship missile.
- February 2025: Thales and Bharat Dynamics Limited announced the signing of an agreement for the initial supply of Laser Beam Riding Man-Portable Air Defense Systems (LBRM). This initiative aligns with the Indian Government's requirements to enhance the country's air defense capabilities.


Asia-Pacific Defense Market Report Scope
The Asia-Pacific defense market study analyzes historical, current, and projected budget allocation and spending patterns. The market encompasses a range of activities, products, and services that support regional defense and security requirements. The region's defense strategy focuses on protecting against external and internal threats while safeguarding strategic interests. The study examines procurement and modernization plans for the armed forces. It also covers investments in satellite development and deployment, as well as the research and development of advanced technologies, including directed energy weapons (DEWs), hypersonic missiles, unmanned systems, advanced composites, and advanced manufacturing technologies such as 3D printing.
The Asia-Pacific defense market is segmented by armed forces, type, domain, and procurement nature. By armed forces, the market is segmented into the air force, the army, and the navy. By type, the market is segmented into personnel training and protection; C4ISR and electronic warfare (EW); vehicles; weapons and ammunition; unmanned systems; and space and cyber systems. By domain, the market is segmented into land, air, naval, space, cyber, and electromagnetic spectrum. By procurement nature, the market is segmented into indigenous production and foreign procurement. The report also covers the market sizes and forecasts for the Asia-Pacific defense market in major countries in the region. For each segment, the market size is provided in terms of value (USD).
By Armed Forces
| Air Force |
| Army |
| Navy |
By Type
| Personnel Training and Protection |
| C4ISR and Electronic Warfare (EW) |
| Vehicles |
| Weapons and Ammunition |
| Unmanned Systems |
| Space and Cyber Systems |
By Domain
| Land |
| Air |
| Naval |
| Space |
| Cyber and Electromagnetic Spectrum |
By Procurement Nature
| Indigenous Production |
| Foreign Procurement |
By Geography
| China |
| India |
| Japan |
| South Korea |
| Australia |
| Rest of Asia-Pacific |
| By Armed Forces | Air Force |
| Army | |
| Navy | |
| By Type | Personnel Training and Protection |
| C4ISR and Electronic Warfare (EW) | |
| Vehicles | |
| Weapons and Ammunition | |
| Unmanned Systems | |
| Space and Cyber Systems | |
| By Domain | Land |
| Air | |
| Naval | |
| Space | |
| Cyber and Electromagnetic Spectrum | |
| By Procurement Nature | Indigenous Production |
| Foreign Procurement | |
| By Geography | China |
| India | |
| Japan | |
| South Korea | |
| Australia | |
| Rest of Asia-Pacific |


Key Questions Answered in the Report
How large is defense spending across Asia-Pacific today and how fast is it growing?
Outlays total USD 237.66 billion in 2026 and are forecasted to reach USD 287.76 billion by 2031 on a 3.90% CAGR trajectory.
Which armed-service branch is projected to expand the fastest in the region?
Naval programs advance at a 4.76% CAGR as coastal nations prioritize blue-water denial and sea-lane security.
What segment shows the highest growth rate among equipment types?
Unmanned platforms, including swarming drones and autonomous underwater vehicles (AUVs), post a 5.98% CAGR, outpacing all legacy categories.
How are indigenous production efforts reshaping procurement patterns?
Local manufacturing already captures 47.03% of budgets and is rising 5.52% yearly, driven by India’s Atmanirbhar Bharat and South Korea’s KF-21 localization.
Which geography is recording the quickest increase in defense outlays?
India leads with a 5.24% CAGR, supported by a USD 28.60 billion capital allocation that reserves 75% for domestic suppliers.
What technology drivers are most influencing new capability investments?
AI-enabled C4ISR, autonomous systems, and space-based communications dominate modernization priorities as militaries compress decision cycles and seek resilient connectivity.
Page last updated on:


