Taiwan Semiconductor Market Size and Share
Market Overview
| Study Period | 2019 - 2030 |
|---|---|
| Forecast Data Period | 2025 - 2030 |
| Historical Data Period | 2019 - 2023 |
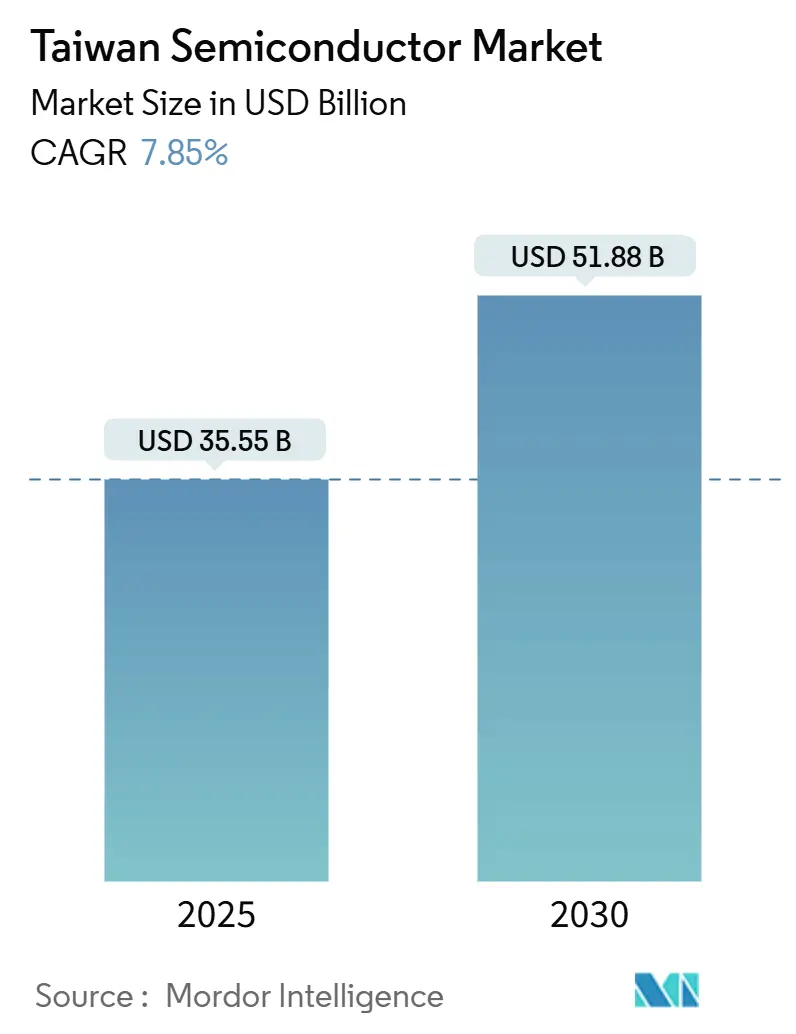
| Market Size (2025) | USD 35.55 Billion |
| Market Size (2030) | USD 51.88 Billion |
| Growth Rate (2025 - 2030) | 7.85% CAGR |
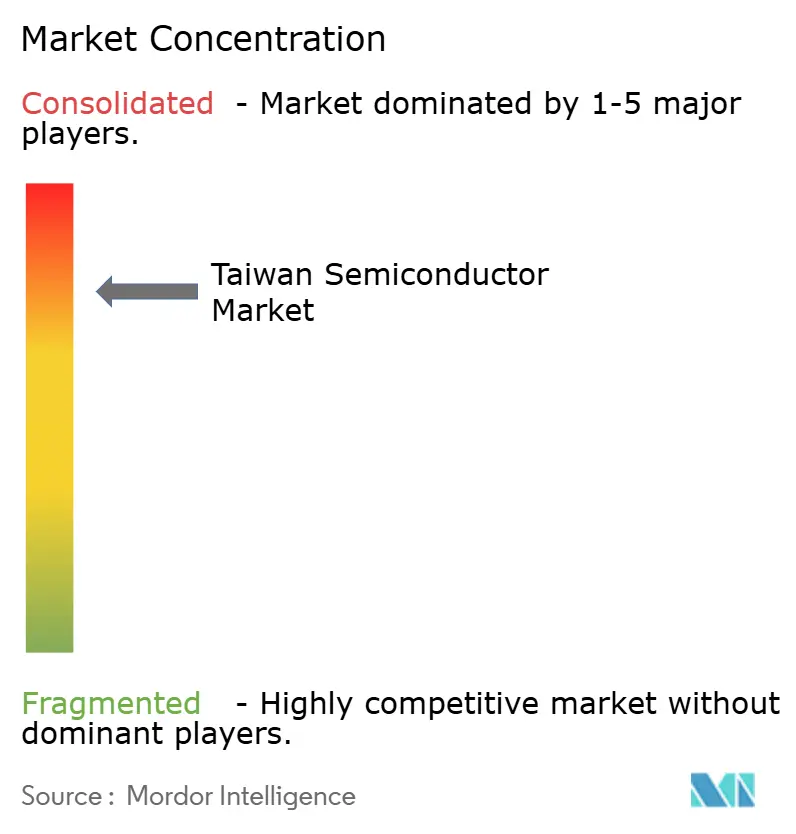
| Market Concentration | High |
Major Players *Disclaimer: Major Players sorted in no particular order Image © Mordor Intelligence. Reuse requires attribution under CC BY 4.0. | |
Taiwan Semiconductor Market Analysis by Mordor Intelligence
The Taiwan semiconductor market size stood at USD 35.55 billion in 2025 and is projected to reach USD 51.88 billion by 2030, registering a 7.85% CAGR during the forecast period. Taiwan remains the indispensable hub for advanced node production, turning more than 90% of the world’s cutting-edge chips and anchoring global demand for physical-AI hardware. High-performance computing already generates more than half of TSMC’s wafer revenue, and mass production of 2 nm devices in late 2025 will deepen that advantage. Near-shoring programs in Japan, Germany, and the United States are accelerating technology transfer while reinforcing Taiwan’s control of sub-7 nm know-how. Energy use, water resilience, and geopolitical tension form the principal headwinds; however, government commitments worth NT$160.1 billion (USD 5.36 billion) and private investments in panel-level packaging suggest that capacity expansions will outpace these constraints through 2030.
Key Report Takeaways
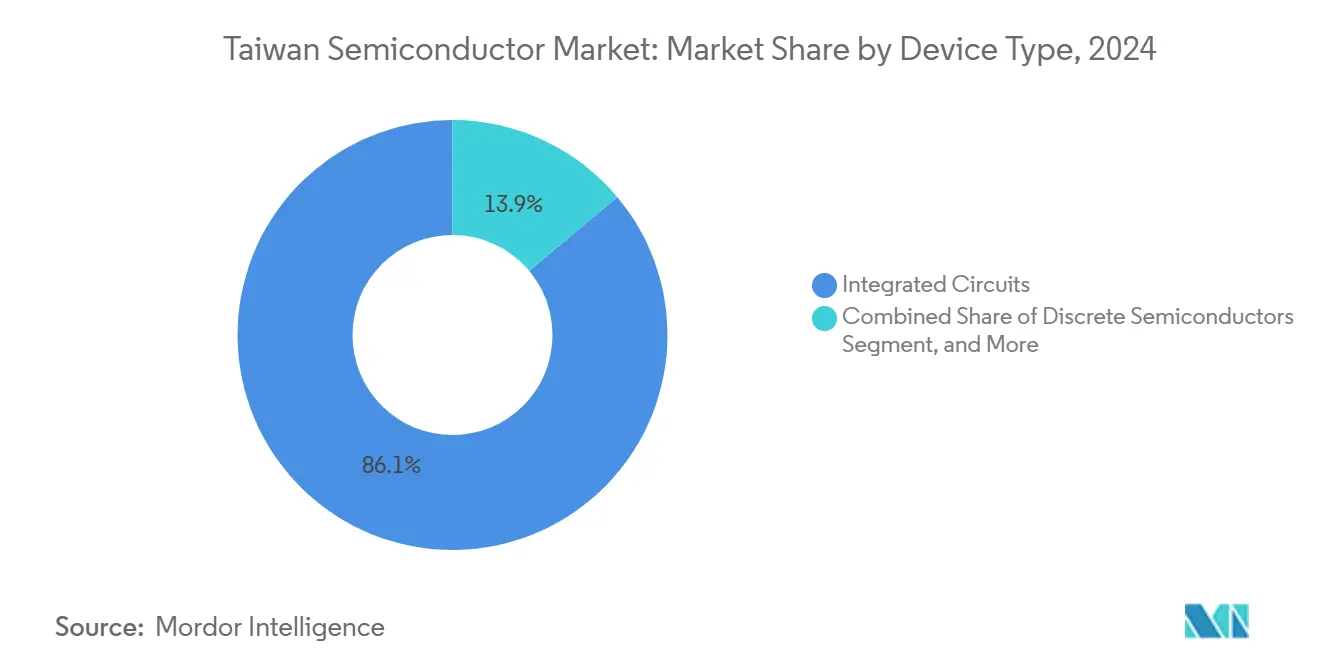
- By device type, integrated circuits held 86.1% of Taiwan's semiconductor market share in 2024 and are forecast to expand at an 8.1% CAGR through 2030, reflecting sustained leadership in 3 nm and 2 nm nodes.
- By business model, design / fabless vendors commanded 67.9% of 2024 revenue, while the segment’s 7.9% CAGR through 2030 underscores the island’s pivot from pure-play foundry work toward ecosystem orchestration.
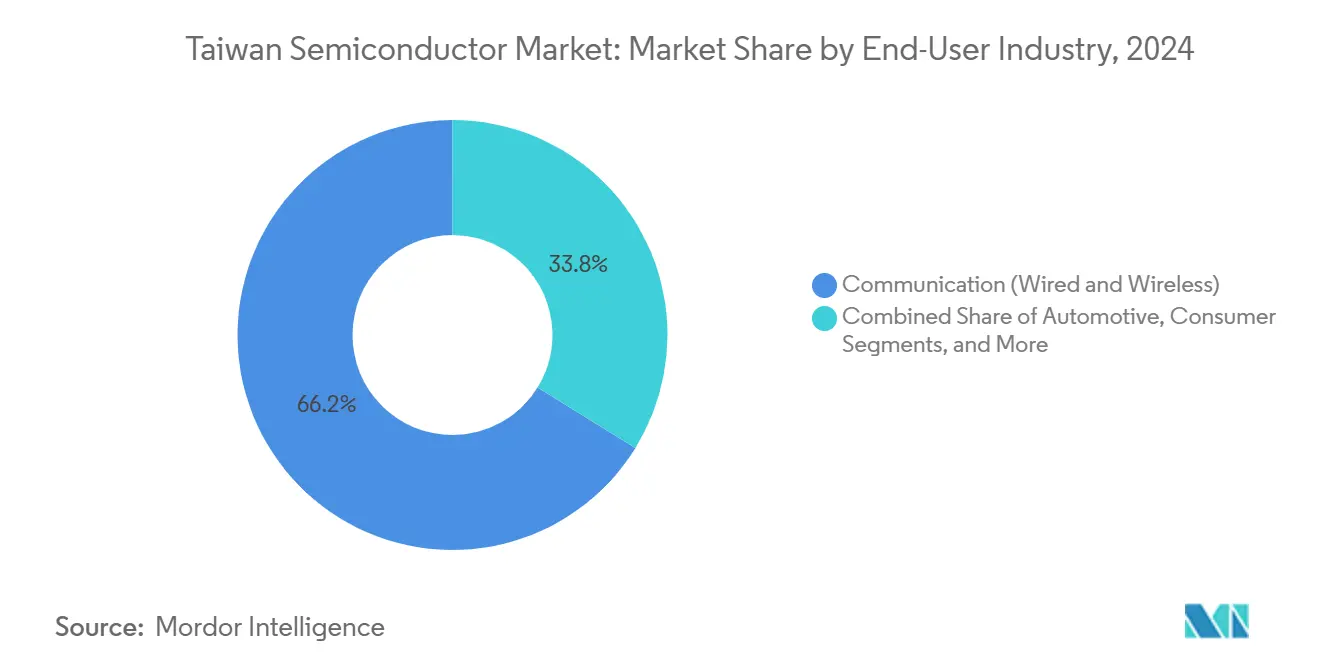
- By end-user industry, communication equipment accounted for 66.2% revenue in 2024; in contrast, AI applications are advancing at a 9.8% CAGR to 2030 and represent the fastest-growing opportunity within the Taiwan semiconductor market.
Taiwan Semiconductor Market Trends and Insights
Drivers Impact Analysis*
| Driver | (~) % Impact on CAGR Forecast | Geographic Relevance | Impact Timeline |
|---|---|---|---|
| Robust global demand for AI/ML accelerators | +2.1% | Global, with a concentration in North America and Asia-Pacific | Medium term (2-4 years) |
| Near-shoring by U.S. and Japanese OEMs is mainstreaming Taiwan fabs | +1.8% | North America, Japan, with spillover to Europe | Long term (≥ 4 years) |
| Automotive SiC/GaN device ramp-up | +1.2% | Global, with early adoption in Europe and North America | Medium term (2-4 years) |
| Mainland China supply-chain de-risking strategies | +0.9% | Asia-Pacific core, with implications for global supply chains | Short term (≤ 2 years) |
| Government-backed 1 nm R&D roadmap | +0.7% | Taiwan national, with global technology spillover | Long term (≥ 4 years) |
| Private-sector investment in advanced heterogeneous integration | +0.6% | Taiwan and key international partnerships | Medium term (2-4 years) |
| Source: Mordor Intelligence | |||
Robust Global Demand for AI / ML Accelerators
High-performance computing supplied 52% of TSMC’s wafer revenue in 2025, and AI processors are on track to reach 20% of the company's sales by 2028. The push toward “physical-AI” robotics elevates logic density requirements that only sub-3 nm nodes can deliver. Such specialization tightens the grip of the Taiwan semiconductor market on next-generation compute architectures. Concurrently, packaging innovation is surging; ASE’s co-packaged optics have achieved energy draw below 5 pJ/bit—sixfold better than existing approaches—cementing the strategic role of advanced packaging alongside foundry capacity. OEMs thus deepen collaboration with Taiwanese suppliers even while seeking geographic diversification, creating a dual dynamic of dependency and de-risking.
Near-shoring by U.S. and Japanese OEMs: Mainstreaming Taiwan Fabs
TSMC’s Kumamoto fab has been running since February 2024, while a second Japanese plant featuring 6 nm capability is planned, confirming a model that prizes ecosystem creation over simple capacity export.[1]Lauly Li, “TSMC to build second Japan plant for 6nm chips as Kumamoto facility begins production,” Nikkei Asia, asia.nikkei.com In Europe, a EUR 10 billion German project couples manufacturing with academic consortia for 2026-2029. Arizona’s USD 65 billion program continues to grapple with cost, talent, and supply-chain gaps, yet it compels the development of modular and repeatable manufacturing flows that ultimately benefit the Taiwan semiconductor market. These projects underscore a reality: near-shoring improves resilience, but leading-edge R&D and pilot runs remain anchored on the island, reinforcing Taiwan’s advanced-node monopoly.
Automotive SiC / GaN Device Ramp-up
Wide-bandgap materials are redrawing Taiwan’s automotive roadmap. GaN-on-QST technology emerging from local fabs targets electric-vehicle inverters that require higher temperature operation than silicon permits. TSMC’s alliance with ROHM Semiconductor signals a decisive move into compound devices. Yet automotive qualification cycles span up to five years, compelling Taiwanese foundries to partner with tier-one module suppliers rather than pursue direct OEM entry. Successful penetration of this capital-intensive space would diversify revenue away from mobile and HPC, tempering cyclicality in the Taiwan semiconductor market.
Mainland China Supply-Chain De-risking Strategies
A suite of measures, including Taiwan’s “N-1” rule restricting export of top-node processes, keeps the newest capabilities at home. Foundries are lowering revenue exposure to China while forging alternative assembly chains in Southeast Asia and India. Parallelly, intellectual-property safeguards such as the “Remote-Poaching Model” limit talent flight. These moves solidify Taiwan’s centrality by ensuring technological leadership rather than merely restricting access. Customers balancing cost efficiency with geopolitical insurance still find the Taiwan semiconductor market indispensable for sub-7 nm output.
Restraints Impact Analysis*
| Restraint | (~) % Impact on CAGR Forecast | Geographic Relevance | Impact Timeline |
|---|---|---|---|
| Escalating energy intensity and carbon-pricing risk | -1.4% | Taiwan national, with global supply chain implications | Short term (≤ 2 years) |
| Geopolitical tension and potential blockade scenario | -1.1% | Taiwan and global semiconductor supply chains | Short term (≤ 2 years) |
| Water-scarcity-driven fab downtime | -0.8% | A Taiwan national, with regional water management challenges | Medium term (2-4 years) |
| Skilled labour plateau despite record STEM graduates | -0.6% | Taiwan national, with spillover to international operations | Long term (≥ 4 years) |
| Source: Mordor Intelligence | |||
Escalating Energy-Intensity and Carbon-Pricing Risk
TSMC drew 7.3% of Taiwan’s electricity in 2024 and could reach 12.5% when 2 nm production matures. Sub-3 nm nodes carry notably higher kilowatt-hour loads per wafer, raising exposure to carbon fees that Taiwan is still formulating. Limited renewable capacity means fabs must rely on conventional generation and energy-attribute certificates to meet sustainability targets. Efficiency initiatives, including 90% water reuse and advanced heat recovery, partially mitigate risk but cannot offset grid constraints in full. Any prolonged power shortage would reverberate through the entire Taiwan semiconductor market.
Geopolitical Tension and Potential Blockade Scenario
Taiwan supplies 92% of the world’s leading-edge chips, turning its fabs into an economic “silicon shield”. Arrests tied to IP theft in August 2025 showcase ongoing technology-security challenges. Customers hedge by dual-sourcing older nodes elsewhere and carrying extra inventory, yet no substitute exists for 3 nm or 2 nm capacity. Defense-oriented export controls protect advanced technologies, but the specter of military conflict continues to weigh on long-term capex decisions. Confidence in uninterrupted shipping lanes remains a prerequisite for the sustained growth of the Taiwan semiconductor market.
*Our forecasts treat driver/restraint impacts as directional, not additive. The impact forecasts reflect baseline growth, mix effects, and variable interactions.
Segment Analysis
By Device Type: Integrated Circuits Command Premium Positioning
Integrated circuits generated 86.1% revenue in 2024, while sub-7 nm logic has already elevated its value density far above other categories. This dominance translates into the largest slice of the Taiwan semiconductor market for any single product grouping. Microprocessors and AI accelerators employ gate-all-around structures that few global peers can replicate at scale. Memory work, centered on Nanya Technology’s DRAM portfolio, remains vital but carries thinner margins. Conversely, optoelectronics, sensors, and discrete components supply display backlights, LiDAR modules, and power-management devices, capturing the balance of market revenue. Although these smaller sectors grow below the 7.85% headline CAGR, their role in diversifying fab utilization keeps them strategically important.
Process-node segmentation further highlights Taiwan’s leadership: commercial production at 2 nm begins in 2H 2025, while pathfinding for 1 nm stretches into the next decade. These efforts justify sustained capex and justify premium pricing, reinforcing the outsized contribution of integrated circuits to the Taiwan semiconductor market share. Discrete and sensor manufacturers exploit the island’s advanced lithography expertise to meet tight tolerances for automotive and industrial customers, but earnings remain heavily weighted toward logic chips. Looking forward, compound devices such as GaN power ICs could shift a slice of incremental growth into the discrete category, though total share is unlikely to rise above mid-teens before 2030.


By Business Model: Design / Fabless Vendors Reshape Value Creation
Design houses controlled 67.9% of 2024 revenue, delivering nimble product cycles and avoiding large capex burdens. This share translates into the single largest slice of the Taiwan semiconductor market size for any business-model grouping. MediaTek’s 14.9% year-over-year sales rebound in Q1 2025 epitomizes the agility of fabless operations as AI-centric smartphones hit the upper-midrange tier.[2]Lisa Wang, “MediaTek Posts Double-Digit Growth on AI Phone Wins,” Taipei Times, taipeitimes.com Access to TSMC’s N3E and N2 processes lets designers target premium performance without directly financing fabrication. The fabless structure thus boosts return on invested capital and supports near-double-digit EPS expansion under moderate top-line growth.
IDM participants hold the remaining 32.1% share and often serve niche or reliability-critical segments such as automotive, DRAM, and NOR flash. Vertical control over design and fabs grants long qualification life cycles, a vital asset when OEM reliability guarantees span a decade. That said, rising lithography tool costs lift economic hurdles for in-house 5 nm or 3 nm transitions. Several IDMs therefore outsource portions of advanced work, effectively adopting a hybrid model that still channels new volume back into the Taiwan semiconductor market.
By End-User Industry: AI Applications Accelerate Market Transformation
Communication gear—including smartphones, routers, and base-station silicon—delivered 66.2% of 2024 demand, giving it the largest customer foothold inside the Taiwan semiconductor market. Yet AI platforms for data-center inference and edge robotics are growing at a 9.8% CAGR to 2030, topping the sectoral expansion chart. TSMC’s forecast of 1.3 billion AI robots by 2035 illustrates the magnitude of this shift. As a result, chip architects migrate toward domain-specific accelerators that optimize matrix math rather than general-purpose compute, increasing transistor counts per die.
Consumer electronics still provide large but flattening output flows as smartphone unit shipments plateau. Industrial IoT, cloud storage, and factory automation add steady mid-single-digit gains, buffering cyclicality in mobile demand. Automotive designs, particularly ADAS processors and power ICs, form a fast-rising niche; however, protracted qualification means revenue ramps trail technological breakthroughs by several years. Government, aerospace, and defense users procure small volumes at premium margins, underscoring the need for foundry flexibility across a broad performance envelope. Overall, the expanding AI domain underpins the next phase of value creation in the Taiwan semiconductor market.
Geography Analysis
Domestic fabrication operates as both a production center and a principal revenue base, enabling cluster economics unmatched elsewhere. Taiwan accounts for 26% of U.S. server imports and 40% of China’s server intake, underscoring the island’s dual-hub status.[3]Joseph Chen, “Asia-Pacific Rises as Infrastructure Powerhouse,” DIGITIMES Asia, digitimes.com Within Asia, partnerships with Singaporean tool vendors support roughly 20% of global semiconductor-equipment output, reinforcing supply resilience. This interwoven trade pattern elevates the Taiwan semiconductor market size while simultaneously magnifying exposure to freight and political risk.
International expansions — Kumamoto, Dresden, and Phoenix — pursue customer proximity and geopolitical hedging without surrendering core R&D. The European Chips Act, backed by EUR 43 billion (USD 50.01 billion) in incentives, funds TSMC’s German venture, coupling lithography pilot lines with university consortia. These alliances widen technology diffusion yet maintain the latest node development exclusively on Taiwanese soil, preserving comparative advantage. Accordingly, even when wafers are processed abroad, photomask design, process recipes, and yield-management analytics continue to flow through the Taiwan semiconductor market.
The geographic concentration of top-tier fabs yields unrivaled scale benefits but creates single-point-of-failure exposure to natural disasters and shipping chokepoints. Government-funded infrastructure hardening, such as redundant high-voltage links and coastal floodwalls, mitigates environmental hazards. Concurrently, remote design enablement platforms allow customers to finalize tape-outs without on-site visits, cushioning short-term travel or logistics disruptions. Taken together, these measures sustain the export engine that underpins nearly 38% of Taiwan’s GDP while reinforcing strategic reliance on the island for advanced logic supply.
Competitive Landscape
TSMC alone holds a significant share of global third-party foundry revenue, defining an oligopolistic hierarchy in which capital intensity and extreme-ultraviolet lithography mastery limit new entrants. United Microelectronics focuses on mature nodes—28 nm and above—serving cost-optimized consumer and industrial segments. Global OSAT leader ASE Technology bridges front-end innovation with back-end integration through a USD 200 million panel-level packaging program slated for late-2025 commercial output.[4]Elaine Huang, “ASE Technology Invests USD 200 Million in Panel-Level Packaging for AI Chips,” Commonwealth Magazine, commonwealthmag.com Together with Powerchip Semiconductor Manufacturing and Nanya Technology, these incumbents form the nucleus of corporate control for the Taiwan semiconductor market.
Competition now extends beyond wafers into whole-stack offerings that merge design services, advanced packaging, and test. For example, ASE’s co-packaged optics target next-generation switches where on-board optics slash energy use per bit by 80% relative to pluggable modules. Meanwhile, collaboration among EDA vendors, silicon IP firms, and foundries accelerates time-to-yield for AI accelerators. Start-ups with novel architectures, such as wafer-scale processors, depend on Taiwanese fabs for risk production, ensuring that new value creation cycles still cycle through the Taiwan semiconductor market.
While economic moat depth increases, buyers push for second sourcing and geographic diversification. Mature-node specialists in China and South Korea capture incremental share for lagging-edge devices, but the absence of 3 nm capability constrains mainstream substitution. Patent cross-licensing and joint development agreements have therefore become the preferred channels for cooperative competition, expanding total market value without provoking capacity overbuild.
Taiwan Semiconductor Industry Leaders
Taiwan Semiconductor Manufacturing Company Limited (TSMC)
MediaTek Inc.
United Microelectronics Corporation (UMC)
Novatek Microelectronics Corp.
Realtek Semiconductor Corp.
- *Disclaimer: Major Players sorted in no particular order

Recent Industry Developments
- August 2025: Taiwan prosecutors arrested six suspects in a TSMC trade-secret theft case, prompting tighter security audits across fabs.
- July 2025: ASE Technology committed USD 200 million for a panel-level packaging line measuring 310 mm × 310 mm, with shipments set for late 2025.
- June 2025: Hon Hai Research Institute and National Yang Ming Chiao Tung University unveiled a silicon-carbide single-chip IC rated above 150 °C for extreme environments.
- June 2025: Academia Sinica opened an 8-inch superconducting quantum-chip pilot line and cryogenic test beds to support domestic quantum research.


Taiwan Semiconductor Market Report Scope
| Discrete Semiconductors | Diodes | ||
| Transistors | |||
| Power Transistors | |||
| Rectifier and Thyristor | |||
| Other Discrete Devices | |||
| Optoelectronics | Light-Emitting Diodes (LEDs) | ||
| Laser Diodes | |||
| Image Sensors | |||
| Optocouplers | |||
| Other Device Types | |||
| Sensors and MEMS | Pressure | ||
| Magnetic Field | |||
| Actuators | |||
| Acceleration and Yaw Rate | |||
| Temperature and Others | |||
| Integrated Circuits | By Integrated Circuit Type | Analog | |
| Micro | Microprocessors (MPU) | ||
| Microcontrollers (MCU) | |||
| Digital Signal Processors | |||
| Logic | |||
| Memory | |||
| By Technology Node (Shipment Volume Not Applicable) | < 3 nm | ||
| 3 nm | |||
| 5 nm | |||
| 7 nm | |||
| 16 nm | |||
| 28 nm | |||
| > 28 nm | |||
| IDM |
| Design / Fabless Vendor |
| Automotive |
| Communication (Wired and Wireless) |
| Consumer |
| Industrial |
| Computing / Data Storage |
| Data Center |
| AI |
| Government (Aerospace and Defense) |
| By Device Type (Shipment Volume for Device Type is Complementary) | Discrete Semiconductors | Diodes | ||
| Transistors | ||||
| Power Transistors | ||||
| Rectifier and Thyristor | ||||
| Other Discrete Devices | ||||
| Optoelectronics | Light-Emitting Diodes (LEDs) | |||
| Laser Diodes | ||||
| Image Sensors | ||||
| Optocouplers | ||||
| Other Device Types | ||||
| Sensors and MEMS | Pressure | |||
| Magnetic Field | ||||
| Actuators | ||||
| Acceleration and Yaw Rate | ||||
| Temperature and Others | ||||
| Integrated Circuits | By Integrated Circuit Type | Analog | ||
| Micro | Microprocessors (MPU) | |||
| Microcontrollers (MCU) | ||||
| Digital Signal Processors | ||||
| Logic | ||||
| Memory | ||||
| By Technology Node (Shipment Volume Not Applicable) | < 3 nm | |||
| 3 nm | ||||
| 5 nm | ||||
| 7 nm | ||||
| 16 nm | ||||
| 28 nm | ||||
| > 28 nm | ||||
| By Business Model | IDM | |||
| Design / Fabless Vendor | ||||
| By End-user Industry | Automotive | |||
| Communication (Wired and Wireless) | ||||
| Consumer | ||||
| Industrial | ||||
| Computing / Data Storage | ||||
| Data Center | ||||
| AI | ||||
| Government (Aerospace and Defense) | ||||


Key Questions Answered in the Report
How large is the Taiwan semiconductor market in 2025?
The Taiwan semiconductor market size reached USD 35.55 billion in 2025 and is projected to grow at a 7.85% CAGR to USD 51.88 billion by 2030.
Which segment is growing fastest inside Taiwans chip sector?
AI applications are expanding at a 9.8% CAGR through 2030, outpacing all other end-user categories.
What share of global advanced chips does Taiwan supply?
Taiwanese fabs manufacture about 92% of the worlds leading-edge semiconductors.
Why is energy consumption a restraint for Taiwanese fabs?
Advanced nodes need far more electricity per wafer; TSMC could draw 12.5% of Taiwans total power once full 2 nm output starts.
How concentrated is the competitive landscape?
The top five firms control roughly 80% of revenue, with TSMC alone holding 61%, yielding a concentration score of 8.
What role does packaging play in future growth?
Panel-level and co-packaged optics technologies add critical value for AI chips, enabling Taiwanese OSATs to capture incremental high-margin revenue.
Page last updated on:


