Tablet PC Market Size and Share
Market Overview
| Study Period | 2020 - 2031 |
|---|---|
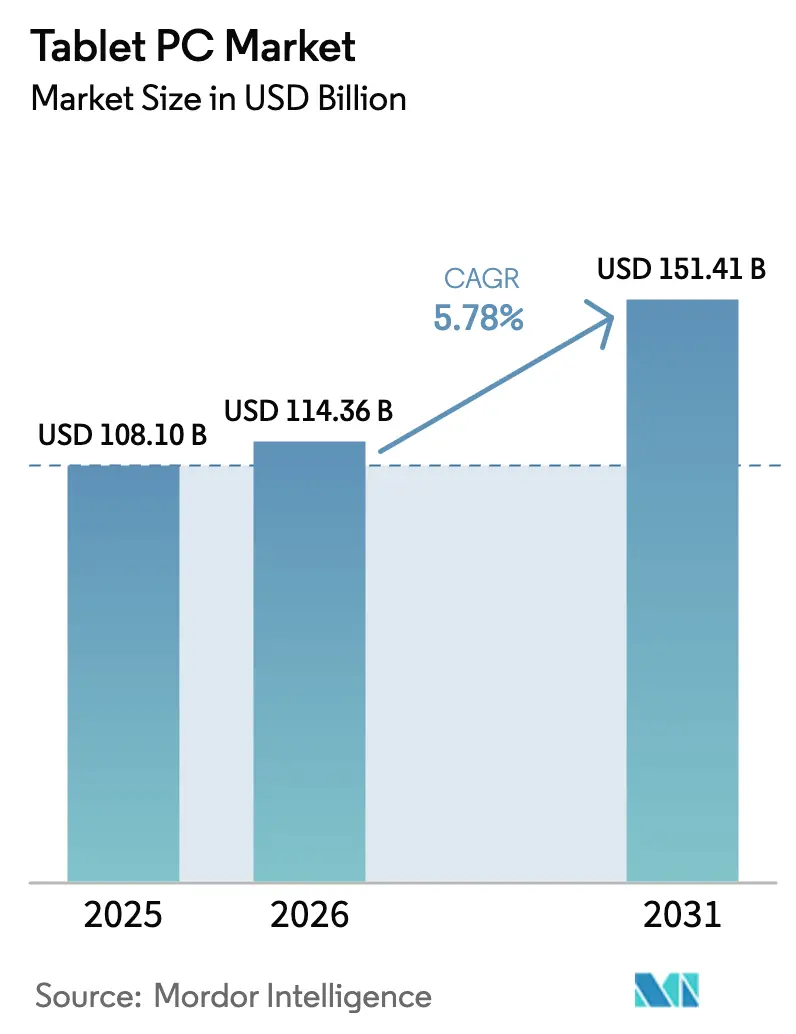
| Market Size (2026) | USD 114.36 Billion |
| Market Size (2031) | USD 151.41 Billion |
| Growth Rate (2026 - 2031) | 5.78% CAGR |
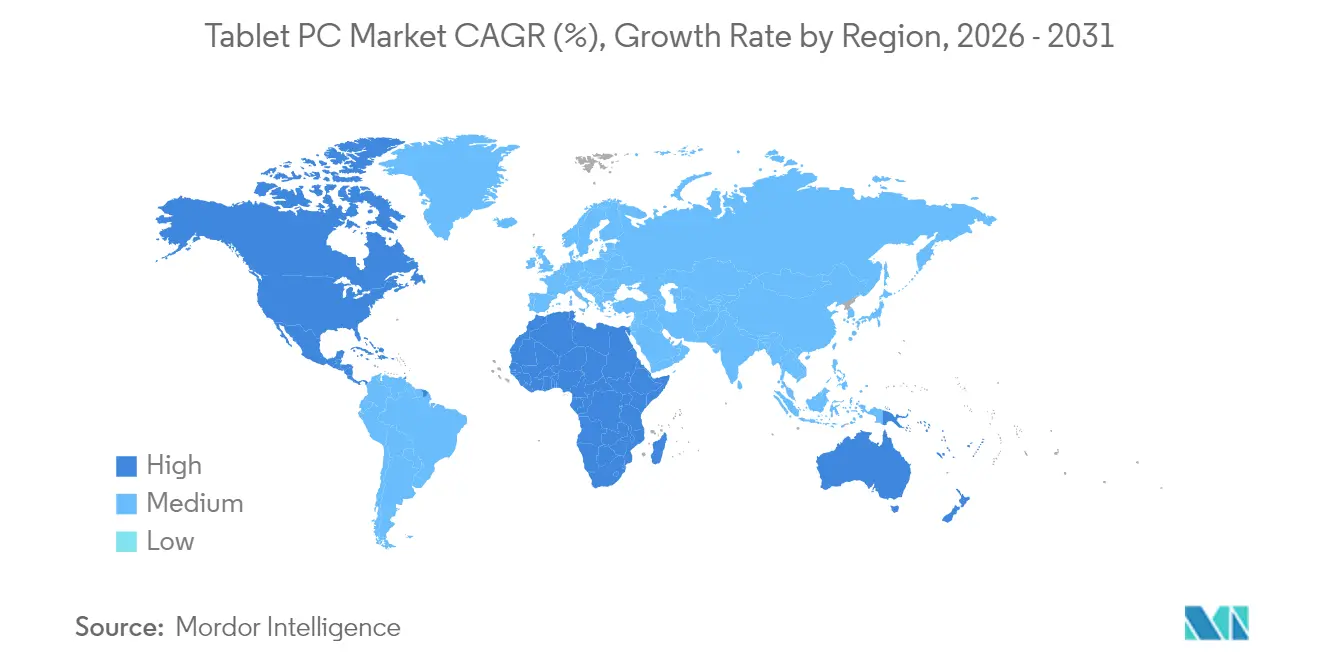
| Fastest Growing Market | Asia Pacific |
| Largest Market | North America |
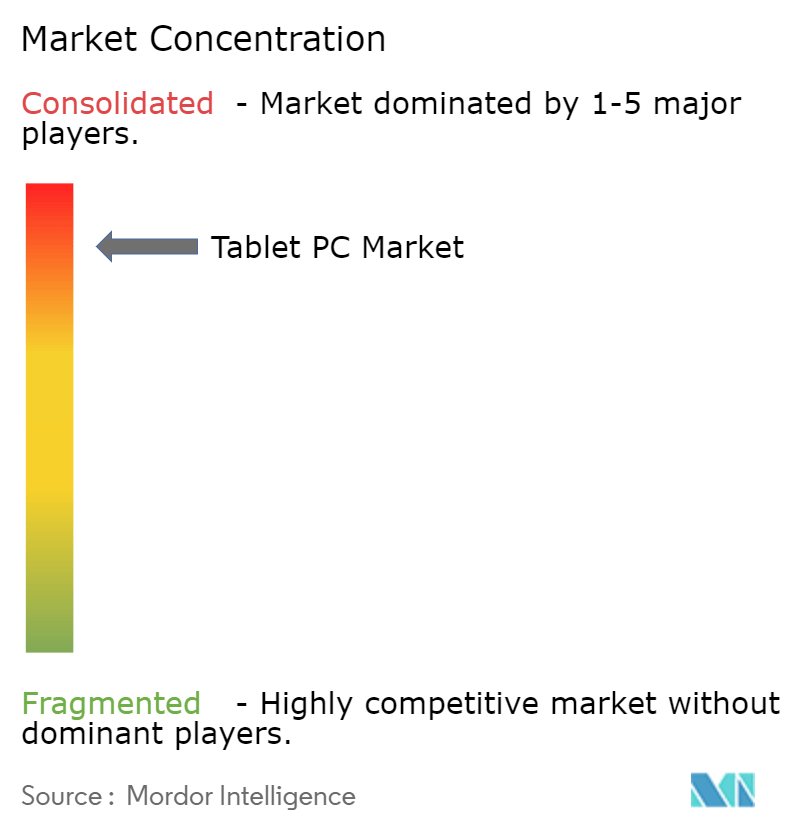
| Market Concentration | High |
Major Players *Disclaimer: Major Players sorted in no particular order Image © Mordor Intelligence. Reuse requires attribution under CC BY 4.0. | |
Tablet PC Market Analysis by Mordor Intelligence
The tablet PC market size was valued at USD 108.1 billion in 2025 and estimated to grow from USD 114.36 billion in 2026 to reach USD 151.41 billion by 2031, at a CAGR of 5.78% during the forecast period (2026-2031). This solid expansion shows how the tablet PC market is shifting from basic media-consumption devices toward productivity-centric computing platforms. Demand rises as mobile employees need lightweight tools that run enterprise apps locally, and as sovereign AI policies favor on-device inference over cloud dependence. ARM-based Windows convergence strengthens the business case, with Snapdragon X Elite processors delivering 26-hour battery life while retaining x86 compatibility. Government-funded digital-learning programs, wider 5G coverage, and online retail growth further amplify momentum, even as long replacement cycles and big-screen phone cannibalization temper unit volumes.
Key Report Takeaways
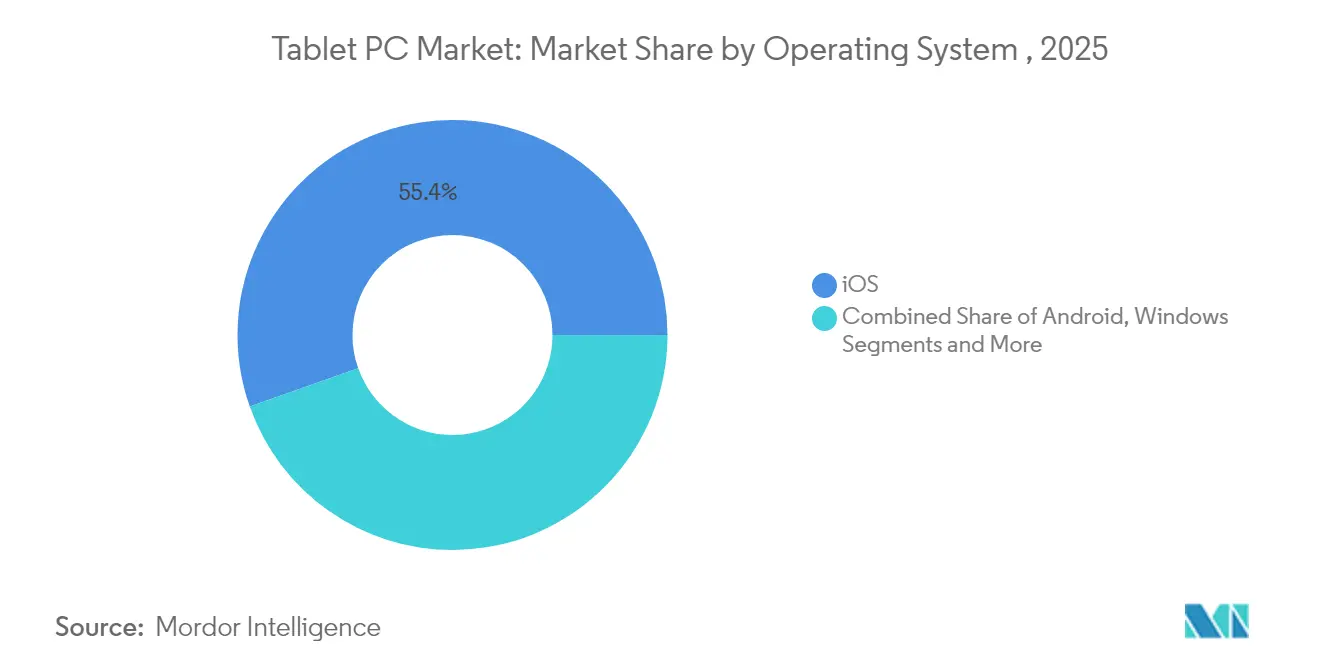
- By operating system, iOS led with 55.40% of the tablet PC market share in 2025, while Android tablets are projected to grow at a 6.89% CAGR to 2031.
- By distribution channel, offline sales held 60.30% of the tablet PC market share in 2025, and Online is advancing at a 9.41% CAGR as direct-to-consumer models gain ground.
- By screen size, the 8–10.9-inch bracket commanded 55.05% of the tablet PC market size in 2025, whereas devices ≥14 inches are climbing at an 8.52% CAGR.
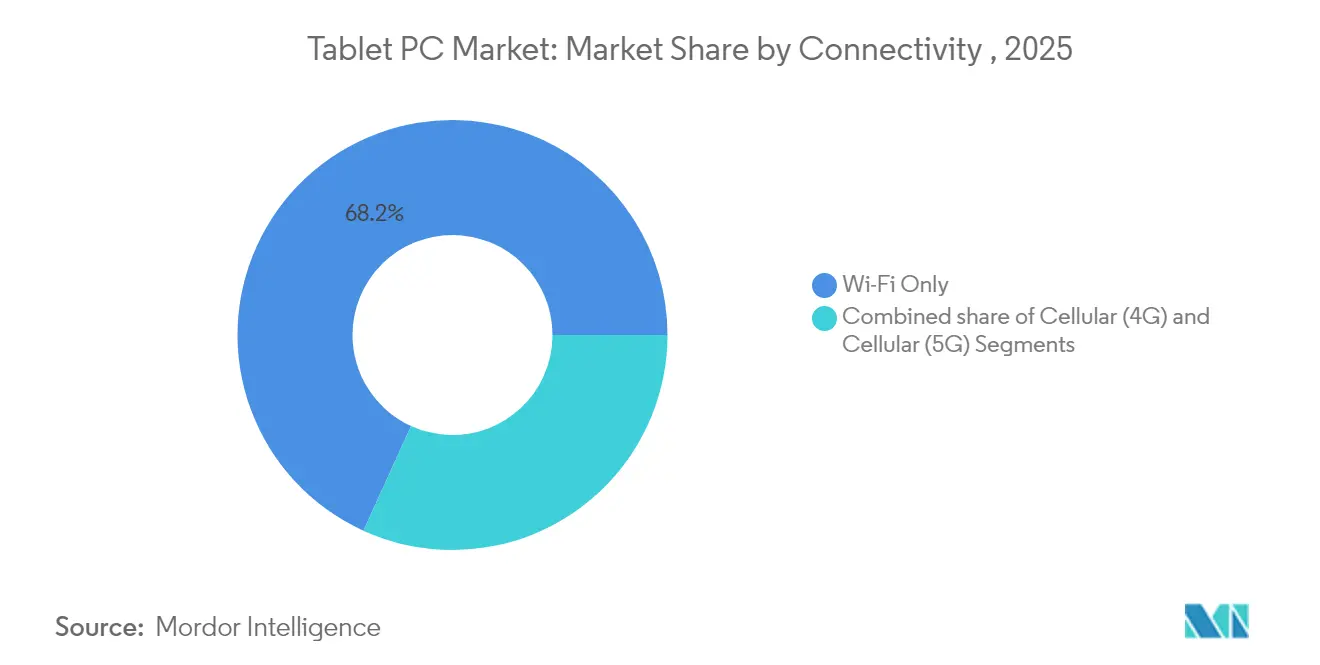
- By connectivity, Wi-Fi-only models represented 68.20% of the tablet PC market size in 2025; 5G cellular tablets are growing at a rapid 13.74% CAGR.
- By price band, mid-range devices (USD 200–499) delivered 47.60% of the tablet PC market size in 2025, while the premium tier (≥USD 500) is widening at a 9.22% CAGR.
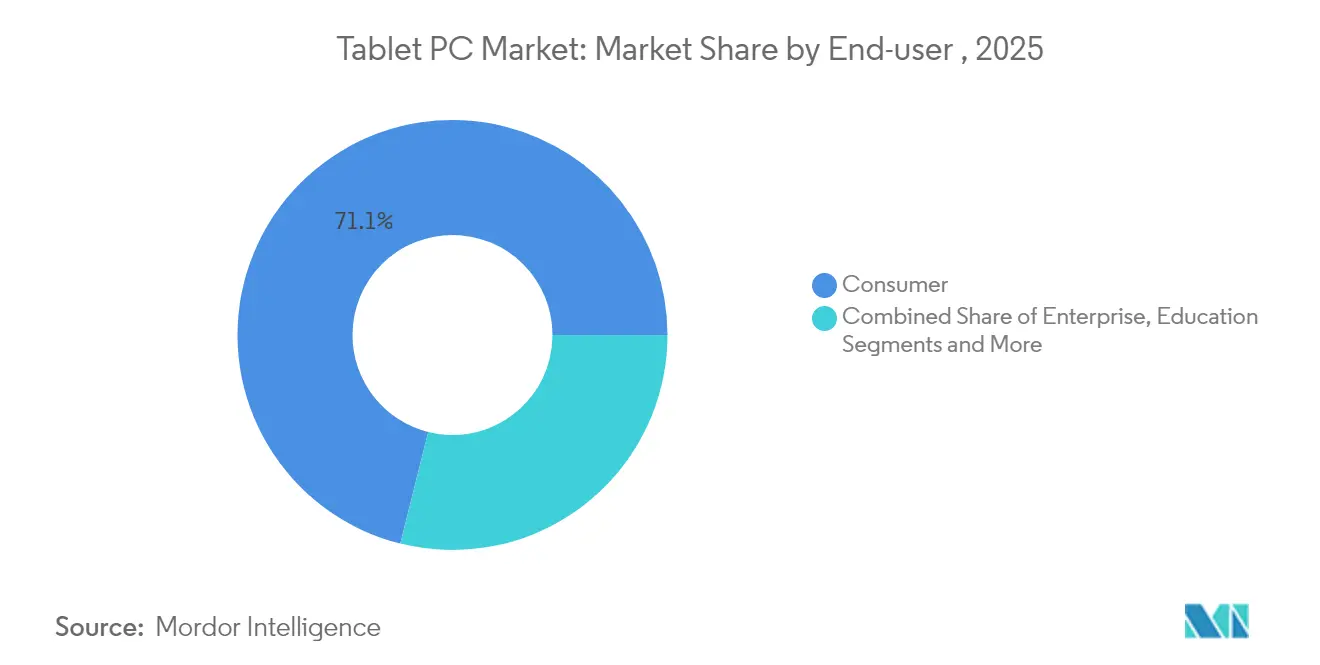
- By end user, the education segment captured 11.02% of the tablet PC market size CAGR outlook, outpacing the consumer segment, which retained a 71.10% revenue share in 2025.
- By geography, Asia-Pacific accounted for 38.65% of the tablet PC market in 2025; Africa is expected to post the fastest regional CAGR of 7.21% through 2031.
Note: Market size and forecast figures in this report are generated using Mordor Intelligence’s proprietary estimation framework, updated with the latest available data and insights as of 2026.
Global Tablet PC Market Trends and Insights
Drivers Impact Analysis*
| Driver | (~) % Impact on CAGR Forecast | Geographic Relevance | Impact Timeline |
|---|---|---|---|
| Government-funded digital education programs | +1.2% | North America and EU | Medium term (2-4 years) |
| Proliferation of 5G and Wi-Fi 6E connectivity | +0.8% | Asia-Pacific core, spill-over to North America | Short term (≤2 years) |
| On-device AI-enhanced productivity apps | +1.5% | Global, early adoption in North America and EU | Long term (≥4 years) |
| Foldable and rollable form factors | +0.6% | Asia-Pacific core, premium segments worldwide | Long term (≥4 years) |
| Enterprise mobility and rugged-tablet demand | +0.9% | Global industrial hubs | Medium term (2-4 years) |
| ARM-based Windows convergence | +1.1% | North America and EU, expanding to Asia-Pacific | Medium term (2-4 years) |
| Source: Mordor Intelligence | |||
Government-Funded Digital Education Programs Drive Institutional Adoption
Public funding is unlocking volume orders that stabilize the tablet PC market. The United States earmarked USD 250 million to expand digital skills, channeling substantial volumes into school districts.[1]NTIA, “Biden-Harris Administration Recommends for Award More Than USD 250 Million to Expand Digital Skills,” internetforall.gov, internetforall.gov The United Kingdom followed with a GBP 1 million initiative to pilot AI teaching assistants. Australia’s Future of Education scheme rolls out free devices for Canberra students, underlining how whole-of-government procurement shapes product standards. Makers that win these contracts gain predictable revenue and public-sector validation that later influences corporate buying.
Proliferation of 5G and Wi-Fi 6E Connectivity Enables Mobile-First Workflows
Private 5G networks are moving from 4,000 sites in 2022 to 60,000 by 2028, turning tablets into primary field computers. Ericsson notes that network slicing prioritizes mission-critical traffic for devices that require constant links.[2]Ericsson, “5G Solutions for Enterprise Network and Connectivity,” ericsson.com Seamless hand-off between 5G and Wi-Fi 6E removes reliance on fixed LANs, pushing the tablet PC market toward always-connected models that support industrial inspection, logistics tracking, and frontline service roles.
On-Device AI-Enhanced Productivity Applications Transform User Expectations
Local inference is redefining value propositions. Qualcomm’s partnership with Personal AI lets firms deploy personal language models that never leave the device, easing regulatory risk in legal and finance. Google’s AI Edge Gallery broadens offline capability for Android tablets. As AI workloads shift from cloud to edge, the tablet PC market rewards vendors that integrate high-performance neural engines and ample storage.
Foldable and Rollable Form Factors Catalyze Premium Upgrades
Huawei’s tri-foldable handset priced at EUR 3,499 shows demand for screen versatility. Global foldable shipments are forecast to reach 45.7 million units by 2028, creating crossover demand. For tablet OEMs, access to advanced OLED panels and hinge designs is becoming a key moat that smaller rivals struggle to replicate.
Restraints Impact Analysis*
| Restraint | (~) % Impact on CAGR Forecast | Geographic Relevance | Impact Timeline |
|---|---|---|---|
| Lengthening replacement cycles | -1.8% | Mature markets worldwide | Medium term (2-4 years) |
| Large-screen smartphone cannibalization | -1.1% | Premium segments globally | Short term (≤2 years) |
| Display and battery supply-chain volatility | -0.7% | Asia-Pacific supply base | Short term (≤2 years) |
| Data-privacy and BYOD compliance hurdles | -0.5% | North America and EU | Long term (≥4 years) |
| Source: Mordor Intelligence | |||
Lengthening Replacement Cycles Challenge Growth Models
CIRP tracking shows 67% of iPad buyers in the year to March 2024 kept older devices instead of trading in, versus 41% of iPhone buyers. Larger batteries and resilient chassis extend usable life beyond four years. Apple Intelligence may shorten cycles to 3.8 years, yet only if AI features prove indispensable. Secondary use in households dampens fresh demand, so manufacturers must deliver breakthrough upgrades to spark purchase intent.
Large-Screen Smartphone Cannibalization Pressures Mid-Range Tablets
Phones above 6.7 inches threaten 8-10 inch tablets, a segment that holds 55.8% share. Samsung Galaxy S24 Ultra and iPhone 15 Pro Max add stylus support and multi-window software, blurring lines. Japan’s 40% shipment leap in 2025 reflects how consumers move up to bigger tablets for clear differentiation. Tablet makers must either price-match in overlapping sizes or target use cases phones cannot meet.
*Our forecasts treat driver/restraint impacts as directional, not additive. The impact forecasts reflect baseline growth, mix effects, and variable interactions.
Segment Analysis
By Operating System: Apple Leadership Meets Rising Android Ambition
iOS retained 55.40% of 2025 revenue, while Android grows at 6.89% to 2031. The tablet PC market size for iOS products stood at about USD 59.9 billion in 2025, whereas Windows and others vied for the rest. Android vendors appeal to cost-sensitive enterprises through flexible customization, while Windows on ARM re-opens a path for corporate IT teams seeking a familiar stack. This mix shows how the tablet industry now mirrors the smartphone ecosystem in platform diversity.
Apple leans on tight hardware-software integration and its M-series silicon. Google champions open ecosystems, allowing TCL to introduce NXTPAPER 4.0 at EUR 249, winning procurement bids where price matters. Qualcomm and Microsoft pitch Snapdragon X-powered detachables as thin Windows workhorses, aiming to claw back enterprise share.


By Distribution Channel: Digital Commerce Redefines Go-to-Market
Offline sellers captured 60.30% of 2025 volume, giving vendors a direct line to users. This share equals roughly USD 65.2 billion of tablet PC market size revenue in the year. Direct stores let brands harvest usage telemetry, run trade-in promotions, and push firmware updates without retail bottlenecks. For customers, quick comparison and same-day delivery make e-commerce the preferred route.
Brick-and-mortar chains fight back with experiential zones that showcase accessories. Carrier stores emphasize 5G bundles, notably in North America where one tablet line can qualify for a multidevice data plan discount. Institutional buyers still rely on resellers that provide imaging, warranty aggregation, and on-site training, illustrating how channel diversity survives even in a digital era.
By End User: Education Sets the Pace for Digital Learning
Education is the fastest-rising end-user slice at 11.02% CAGR. Its share of tablet PC market size will approach USD 26.3 billion by 2031 as classrooms adopt AI-enabled lesson-planning apps. Consumer use held 71.10% of 2025 spend yet is maturing because replacement cycles lengthen. Enterprises follow as mobile workflow pilots reach scale in field service, healthcare, and logistics.
Hospitals purchase medical-grade tablets to interface with electronic health records and medication carts. Government programs such as India’s Umang app streamline citizen services, so agencies buy rugged models that withstand extreme climates. Each vertical needs tailored accessories, prompting OEMs to develop modular lines.
By Screen Size: Bigger Panels Gain Favor for Productivity
Tablets above 14 inches are expanding at an 8.52% CAGR as remote workers crave laptop-like canvases. The category accounted for 12.00% of shipments in 2025 and is on track to double by 2031. The 8–10.9 inch tier still commands majority share, but its grip loosens as phones encroach. A 14.6-inch Galaxy Tab S9 Ultra shows how premium Android models rival ultrabooks for creative tasks.
Ultraportable sub-8-inch devices persist in aviation cockpits and retail queue-busting, though volume declines. Display makers invest in oxide TFT and tandem OLED to cut power draw, allowing large screens without battery penalties. Supply tightness could buoy average selling prices, reinforcing the premiumisation trend.
By Connectivity: 5G Tablets Bring Edge-Compute to the Field
Wi-Fi configurations generated 68.20% of 2025 shipments, yet 5G units surge at 13.74% CAGR. The tablet PC market share of cellular-equipped models will cross 40.00% by 2031 as private networks proliferate. Field engineers use 5G tablets to stream real-time diagnostics from turbines and pipelines. Retail chains deploy them for curbside checkout where Wi-Fi coverage falters.
LTE models continue in education and SMB niches where carriers discount older radios. Vendors are rationalising SKUs by offering modem add-ons to maintain supply flexibility while tariffs swing. Antenna design and thermal tuning gain importance because mmWave modules add heat load.
By Price Band: Premium Tier Captures Value as Entry Level Compresses
Devices priced above USD 500 are pacing 9.22% CAGR, doubling their revenue slice by 2031. Customers view them as laptop alternatives, so willingness to pay rises when neural engines, OLED screens, and pen workflows deliver tangible productivity gains. Mid-range tablets balance cost and capability, staying the volume backbone.
Entry-level units under USD 200 feel the twin squeeze of component inflation and smartphone substitution. Nubia’s Pad Pro launches at USD 419 with Snapdragon 8 Gen 3, signaling how aggressive mid-range positioning can woo buyers away from commodity slates. Smaller brands risk margin erosion unless they specialise.
Geography Analysis
Asia-Pacific delivered 38.65% of 2025 shipments thanks to vast manufacturing ecosystems, cost-efficient labor, and rapid 5G rollouts. Governments use tablets to bridge digital divides, driving large public tenders in India, Vietnam, and Indonesia. China’s expanding semiconductor capacity supplies local OEMs with low-cost chipsets, insulating the regional tablet PC market from global shortages. Japan’s 40% unit spike in 2025 reveals replacement appetite as consumers graduate to larger panels that better distinguish from phablets. South Korean display giants Samsung Display and LG Display enjoy first call on Apple’s OLED needs, reinforcing home-market vertical integration.
North America maintains robust value share due to premium pricing and enterprise contracts. US Federal programs pour funds into classroom modernization, offering a reliable sales baseline even when consumer demand moderates. Corporations adopt Windows on ARM tablets as battery-efficient companions to cloud services, testing deployments across logistics and professional services. In Canada, rural broadband incentives spur purchases of 5G models for telehealth and remote learning.
Europe mirrors North American patterns but places sharper emphasis on data protection. The UK invests in AI-assisted teaching aids that bundle tablets with curriculum software. Nordic states deploy rugged tablets for e-government field work, leveraging strong public digital identities.
Africa records the fastest regional CAGR at 7.21% as low-earth-orbit satellite internet unlocks new connectivity corridors. Ministries of education partner with Chinese OEMs to supply low-cost Android slates bundled with local language content. Latin America grows steadily on the back of Brazilian municipal smart-classroom rollouts and Mexican warehouse automation pilots. The Middle East rounds out growth with oil and gas operators adopting ATEX-certified tablets for hazardous sites.

Competitive Landscape
Competition is moderately concentrated. Apple, Samsung, Lenovo, and Huawei account for a majority of global shipments, though more than a dozen brands contest regional niches. Apple secures profit leadership through proprietary silicon, secure ecosystem lock-in, and a 56% operating-system grip in 2024. Samsung wields an expansive portfolio spanning entry to ultra-premium foldables, serving consumers that value hardware variety. Lenovo executes scale manufacturing and channel reach, dominating in education tenders across Asia and EMEA.
Android challengers differentiate via display tech, stylus innovation, or ruggedisation. TCL’s NXTPAPER line leverages glare-free displays that reduce eye strain, carving space in education and professional drawing. Huawei presses form factor leadership inside China where its HarmonyOS builds a parallel ecosystem. Microsoft and HP pursue ARM-based Windows detachables, banking on Office365 entrenchment to lure enterprise clients.
Strategic moves accentuate ecosystem control. Qualcomm’s Snapdragon X platform gives OEMs a potent ARM compute stack. Amazon uses Kindle Scribe to show how vertical content integration secures device stickiness. Component suppliers such as AUO and E Ink invest in ePaper for emerging epublishing uses, expanding addressable niches.
Tablet PC Industry Leaders
Samsung Electronics Co. Ltd.
Lenovo Group
Acer Inc.
HP Inc.
Dell Inc.
- *Disclaimer: Major Players sorted in no particular order

Recent Industry Developments
- March 2025: TCL launched the NXTPAPER 11 Plus tablet with proprietary NXTPAPER 4.0 displays and AI note-taking.
- February 2025: MediaTek announced generative AI enablement across Android tablet silicon
- January 2025: Microsoft introduced Surface Pro and Surface Laptop Copilot+ PCs running Snapdragon X Elite.
- January 2025: Qualcomm revealed the Snapdragon X chip for USD 600 Windows laptops with 45 TOPS NPU.


Research Methodology Framework and Report Scope
Market Definitions and Key Coverage
Our study defines a tablet PC as a slate-style, touchscreen computer that measures roughly seven to fifteen inches, runs a full mobile or desktop operating system, and is sold factory-new into retail or commercial channels. We track revenue at first sale value, matching every observed shipment with a documented device leaving the factory gate.
We exclude e-readers, rugged industrial tablets, and convertible laptops whose default form factor is a clamshell.
Segmentation Overview
- By Operating System
- Android
- iPadOS
- Windows
- Other Operating System
- By Distribution Channel
- Online
- Offline
- By End-user
- Consumer
- Enterprise
- Education
- Healthcare
- Government
- By Screen Size
- Less Than 8 inch
- 8-10.9 inch
- 11-13.9 inch
- More than 14 inch
- By Connectivity
- Wi-Fi Only
- Cellular (4G / LTE)
- Cellular (5G)
- By Price Band
- Entry-level
- Mid-range
- Premium
- By Geography
- North America
- United States
- Canada
- Mexico
- South America
- Brazil
- Argentina
- Rest of South America
- Europe
- United Kingdom
- Germany
- France
- Italy
- Spain
- Russia
- Rest of Europe
- Asia-Pacific
- China
- Japan
- India
- South Korea
- Australia and New Zealand
- ASEAN
- Rest of Asia-Pacific
- Middle East and Africa
- Middle East
- United Arab Emirates
- Saudi Arabia
- Turkey
- Israel
- Africa
- South Africa
- Nigeria
- Egypt
- Middle East
- North America
Detailed Research Methodology and Data Validation
Primary Research
Expert interviews with OEM strategy leads, national distributors, education procurement officers, and mobility CIOs across North America, Europe, Asia-Pacific, and the Middle East helped confirm shipment totals, refresh cycles, and enterprise demand signals. Follow-up surveys with online retailers and campus IT buyers clarified emerging price bands and warranty preferences.
Desk Research
We began by mapping the global installed base and shipment flow using freely available tier-1 datasets such as IDC quarterly device trackers, International Telecommunication Union connectivity tables, UN Comtrade HS-8471 trade codes, and customs dashboards that reveal cross-border flows. Company filings, investor decks, and major press articles let us follow price moves, product-mix shifts, and launch seasonality that influence average selling prices.
Mordor analysts then tapped D&B Hoovers for manufacturer financial splits, Dow Jones Factiva for channel inventory news, and GSMA Intelligence for 5G penetration, together with notes from the Consumer Technology Association and peer-reviewed journals on mobility adoption. This list is illustrative rather than exhaustive; many other public and subscription sources informed data collection, validation, and research clarification.
Market-Sizing & Forecasting
A top-down model starts with global production and trade statistics, which are then adjusted for channel inventories and gray imports to derive sell-through volumes. Results are corroborated through selective bottom-up estimates that multiply sampled ASPs by vendor unit shipments in five key countries before being filtered through replacement-cycle assumptions. Key variables include GDP per capita trends, primary-school device funding, 5G subscriber counts, OS share drift, and median replacement interval. A multivariate regression links these drivers to historical shipments for the 2025-2030 trajectory, while scenario analysis overlays account for supply-chain shocks.
Data Validation & Update Cycle
Outputs pass two analyst reviews, variance checks against independent shipment trackers, and anomaly flags triggered by quarterly earnings surprises. Reports refresh annually, with interim updates for material events, so clients always receive the latest vetted view.
Why Our Tablet PC Baseline Earns Stakeholder Confidence
Published estimates often diverge because publishers choose different channel scopes, roll ASPs in unique ways, or refresh data on dissimilar cadences.
By anchoring results to verified sell-through and validating every assumption with industry respondents, Mordor Intelligence offers a midpoint executives can defend.
Benchmark comparison
| Market Size | Anonymized source | Primary gap driver |
|---|---|---|
| USD 108.10 Bn (2025) | Mordor Intelligence | |
| USD 114.66 Bn (2025) | Global Consultancy A | Relies on vendor shipment declarations and omits online-only storefronts in emerging regions |
| USD 70.90 Bn (2024) | Trade Journal B | Excludes corporate bulk buys and cellular variants; conservative ASP baseline and older base year |
The comparison shows that narrower scopes or older baselines pull totals down, while shipment-only views push them upward. Our disciplined mix of verified sell-through, blended ASPs, and yearly refresh gives decision-makers a balanced, transparent baseline they can trust.


Key Questions Answered in the Report
What is the current size of the tablet PC market?
The tablet PC market stands at USD 114.36 billion in 2026 and is projected to reach USD 151.41 billion by 2031.
Which operating system leads the tablet PC market?
IOS leads with a 55.40% share in 2025, though Android is expanding at a 6.89% CAGR through 2031.
How quickly are 5G tablets growing?
5G-enabled tablets are advancing at a 13.74% CAGR, the fastest rate among connectivity options.
Why is the education segment important for tablet vendors?
Education shows the highest end-user growth at 11.02% CAGR thanks to digitized curricula and government device subsidies, creating large recurring orders.
Which region holds the largest tablet PC market share?
Asia-Pacific commands 38.65% of global revenue, powered by manufacturing scale and rapid 5G adoption.
What factors restrain tablet PC market growth?
Longer replacement cycles, large-screen smartphones, and supply-chain volatility together subtract over 3% from forecast CAGR, offsetting some demand drivers.
Page last updated on:


