PCaaS Market Size and Share
Market Overview
| Study Period | 2020 - 2031 |
|---|---|
| Market Size (2026) | USD 100.81 Billion |
| Market Size (2031) | USD 252.42 Billion |
| Growth Rate (2026 - 2031) | 20.15% CAGR |
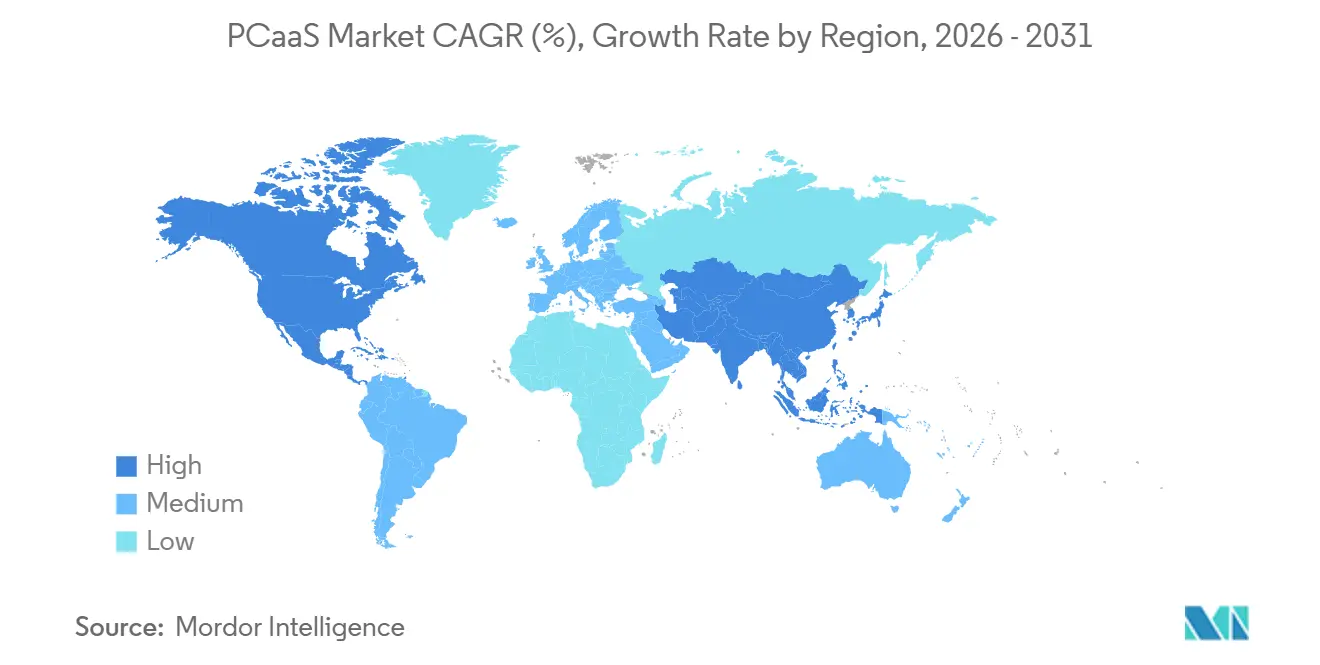
| Fastest Growing Market | Asia-Pacific |
| Largest Market | North America |
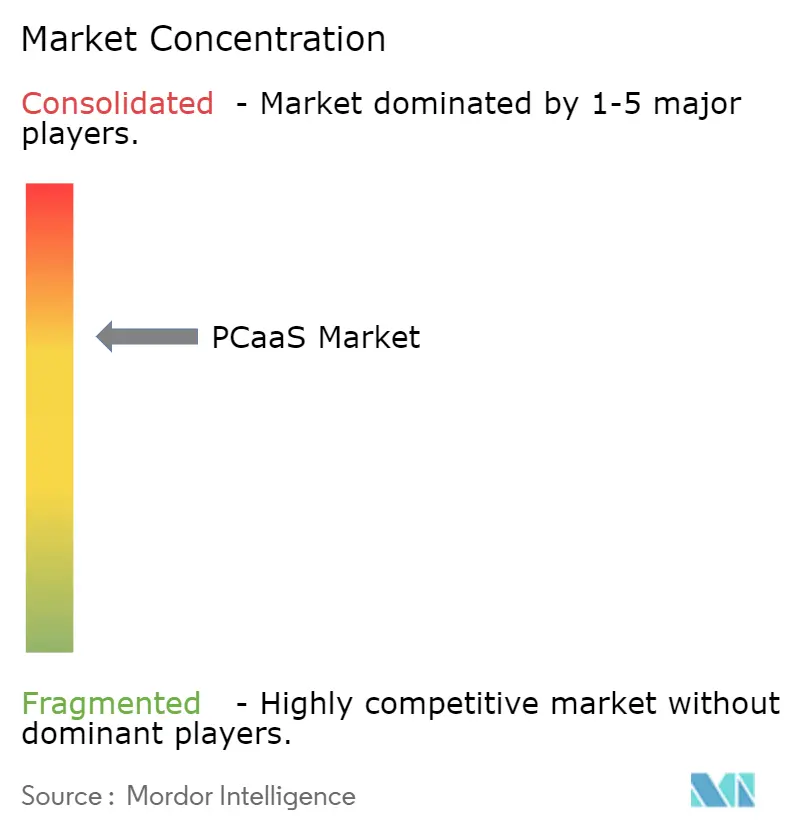
| Market Concentration | Medium |
Major Players *Disclaimer: Major Players sorted in no particular order Image © Mordor Intelligence. Reuse requires attribution under CC BY 4.0. | |
PCaaS Market Analysis by Mordor Intelligence
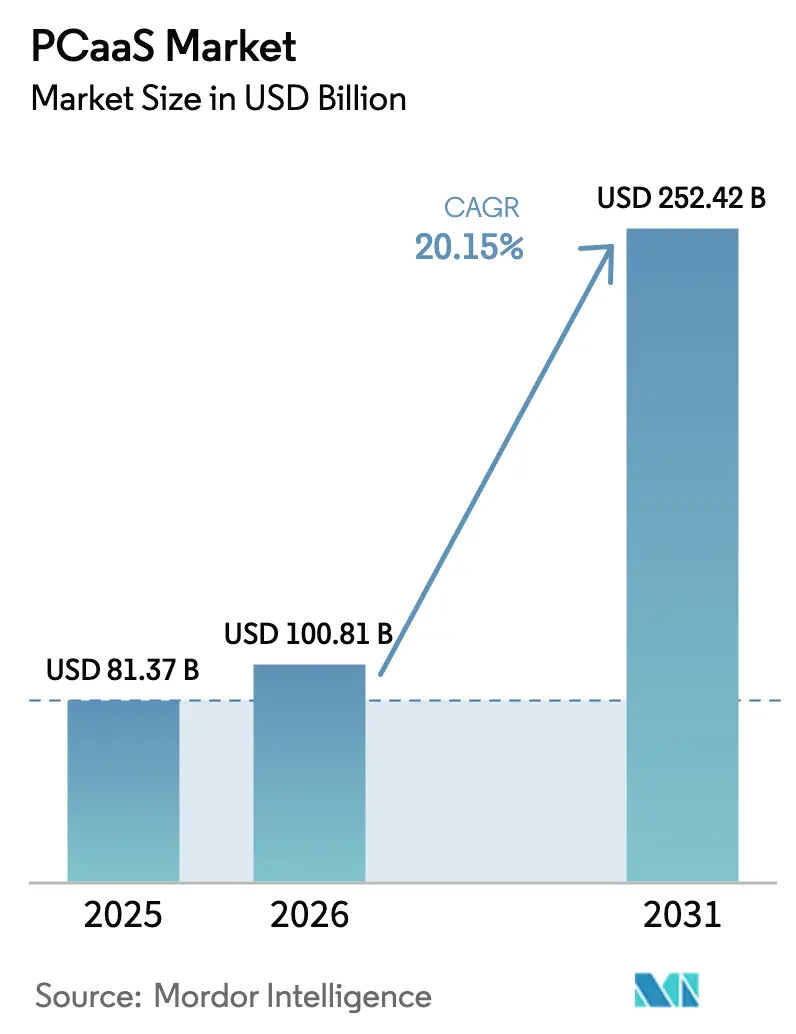
The PCaaS market size is expected to grow from USD 81.37 billion in 2025 to USD 100.81 billion in 2026 and is forecasted to reach USD 252.42 billion by 2031 at 20.15% CAGR over 2026-2031. This rapid expansion stems from a structural pivot in enterprise procurement toward operating-expense models that align device costs with refresh velocity. Growing telecom carrier bundles, tightened ESG regulations that favor centralized take-back programs, and chiplet-based modular architectures that lower residual-value risk are reinforcing demand across every major vertical. Small and medium enterprises are the volume engine, yet large enterprises increasingly negotiate bespoke service-level agreements that elevate average contract values. Competitive intensity remains moderate because no single provider controls the entire as-a-service layer, even though five OEMs ship 65% of global PCs.
Key Report Takeaways
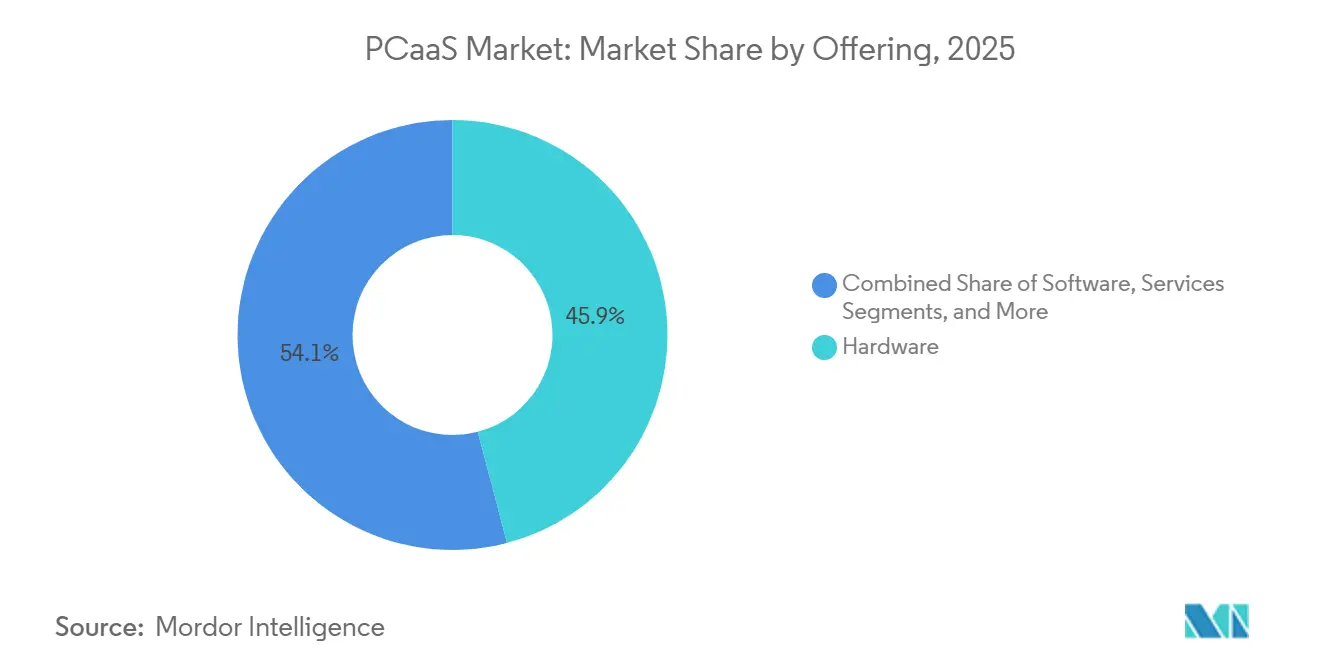
- By offering, hardware captured 45.92% share of the PC-as-a-Service (PCaaS) market size in 2025; bundled solutions are forecast to register the fastest 21.53% CAGR through 2031.
- By organization size, small and medium enterprises held 60.44% of the PC-as-a-Service market share in 2025, whereas large enterprises are projected to expand at a 20.66% CAGR from 2026 to 2031.
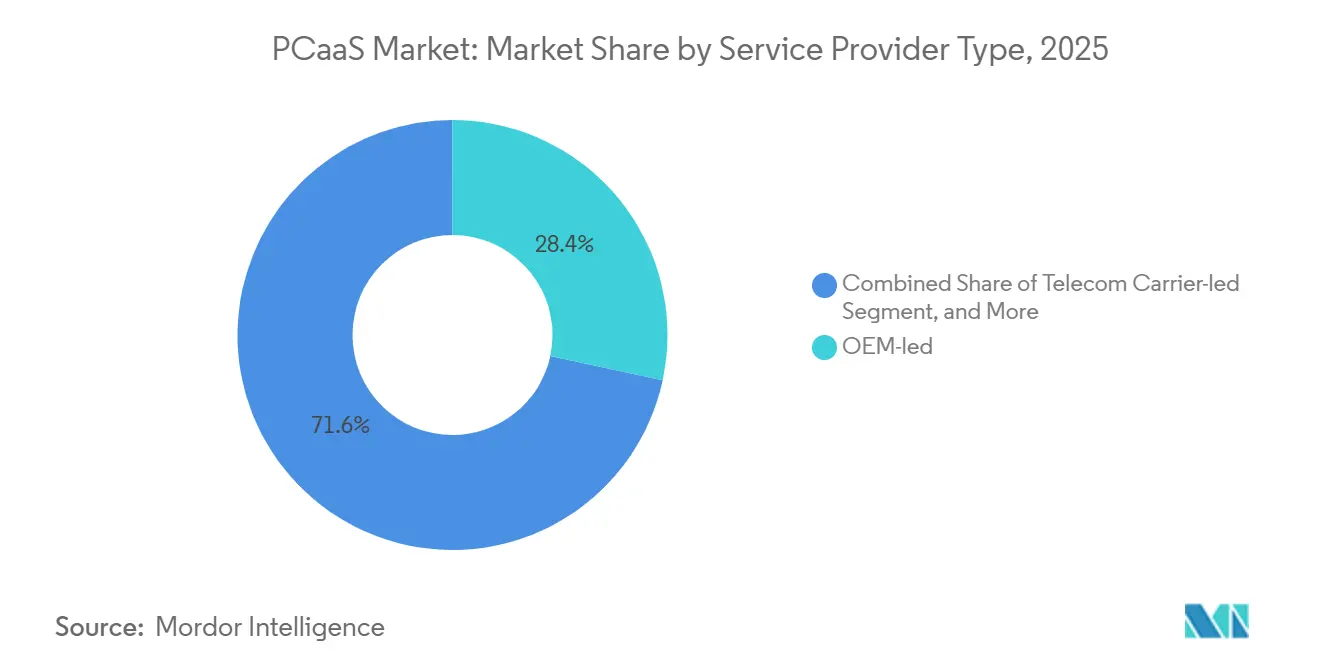
- By service-provider type, OEM-led programs led with 28.37% revenue share in 2025, while telecom carrier-led subscriptions are poised to grow at a 21.05% CAGR.
- By end-user industry, IT and Telecom captured 58.86% share of the market in 2025, whereas the Healthcare and Life Sciences segment is projected to expand at a 20.92% CAGR through 2031.
- By geography, North America commanded 37.21% revenue in 2025; Asia Pacific is anticipated to grow at the fastest 22.44% CAGR to 2031.
Note: Market size and forecast figures in this report are generated using Mordor Intelligence’s proprietary estimation framework, updated with the latest available data and insights as of January 2026.
Global PCaaS Market Trends and Insights
Drivers Impact Analysis*
| Driver | (~)% Impact on CAGR Forecast | Geographic Relevance | Impact Timeline |
|---|---|---|---|
| OPEX Preference and Predictable Budgeting for SMEs | +3.2% | Global, with concentration in North America and Europe | Medium term (2-4 years) |
| Shorter PC Refresh Cycles from Hybrid Work Adoption | +4.1% | North America, Europe, Asia Pacific urban centers | Short term (≤ 2 years) |
| Bundled Security and Lifecycle Management Reducing IT Workload | +3.8% | Global, particularly SMEs lacking in-house IT teams | Medium term (2-4 years) |
| ESG-driven Device Circularity Mandates Boosting PCaaS | +2.9% | Europe (EU Ecodesign Regulation), North America (state-level e-waste laws) | Long term (≥ 4 years) |
| Chiplet-based Modular PCs Enabling Upgradeable Leases | +2.3% | North America and Asia Pacific (early adopter markets) | Long term (≥ 4 years) |
| 5G-laptop eSIM Bundles from Telcos Accelerating Subscriptions | +2.7% | North America, Europe, Asia Pacific (5G coverage zones) | Medium term (2-4 years) |
| Source: Mordor Intelligence | |||


OPEX Preference and Predictable Budgeting for SMEs
Many small and medium enterprises face tighter credit conditions than large corporations. Subscription arrangements eliminate upfront capital hurdles, maintain flat monthly payments, and provide tax advantages under short-term lease accounting. McKinsey reported that adoption rates can hit 30% within a year when switching costs remain under 15% of annual spend. Dell’s APEX customers realized a 170% three-year ROI through avoided financing fees and lower provisioning labor. This dynamic drives sustained volume growth for providers that package data migration and device-agnostic consoles into their baseline offerings.
Shorter PC Refresh Cycles from Hybrid Work Adoption
Hybrid work compressed refresh cycles from four years to roughly two as devices endure more physical stress and remote helpdesk constraints. HP’s 2025 survey found 89% of IT leaders saw productivity gains when refresh timelines aligned with warranty coverage. Intel telemetry revealed that aging devices generate 2.4 times more support tickets, costing USD 450 yearly per unit. Subscription models shift this obsolescence burden to the provider, ensuring predictable performance.
Bundled Security and Lifecycle Management Reducing IT Workload
New HIPAA proposals require multi-factor authentication, encryption at rest, and network segmentation by December 2024.[1]U.S. Department of Health and Human Services, “HHS Proposes Rule to Strengthen HIPAA Security Standards,” hhs.gov Providers now embed endpoint detection and response, vulnerability patching, and secure data-wipe services in standard bundles. Coforge remotely triages 1.5 million tickets annually, and cuts mean time to resolution by 40%. These factors make bundled subscriptions attractive substitutes for piecemeal procurement.
ESG-Driven Device Circularity Mandates Boosting PCaaS
The EU Ecodesign for Sustainable Products Regulation enforces repairability thresholds and recycled-plastic quotas from 2024 onward. Subscription providers manage centralized take-back schemes, meeting compliance at scale. Lenovo’s refurbishment extends device life by up to three years, while Cascade Asset Management observed a 35-40% residual value after three-year leases, which is well above the value of five-year owned fleets.
Restraint Impact Analysis*
| Restraint | (~)% Impact on CAGR Forecast | Geographic Relevance | Impact Timeline |
|---|---|---|---|
| Lack of Product Differentiation and Vendor Lock-in Fears | -1.8% | Global, particularly large enterprises with multi-vendor IT estates | Medium term (2-4 years) |
| Higher TCO for Long-life Workstation Workloads | -1.4% | North America and Europe (engineering, media, scientific computing hubs) | Long term (≥ 4 years) |
| Data-sovereignty and Cross-border Compliance Hurdles | -1.2% | Europe (GDPR), China (Cybersecurity Law), emerging markets | Medium term (2-4 years) |
| Second-hand Device Glut Lowering Residual-value Forecasts | -1.6% | Global, with acute pressure in North America and Europe | Short term (≤ 2 years) |
| Source: Mordor Intelligence | |||
Lack of Product Differentiation and Vendor Lock-In Fears
Enterprises fear that proprietary consoles and non-transferable licenses will trap them on a single-vendor roadmap. Diverging AI-PC architectures from Intel and AMD compound integration risk. Early-termination clauses add 8-12% to monthly fees, making flexibility costly. System integrators such as SHI International aggregate multi-vendor fleets under a unified SLA, but the underlying lock-in perception still limits uptake.
Higher TCO for Long-Life Workstation Workloads
Engineering and media houses amortize high-end workstations over a period of up to seven years. Dell Precision units cost USD 3,000-8,000 but translate to a monthly ownership cost of under USD 100, whereas a three-year subscription often exceeds USD 180. Interest-rate hikes to 7.5% on equipment leases widened this gap.[2]U.S. Federal Reserve, “Federal Funds Rate,” federalreserve.gov NVIDIA RTX 6000 Ada cards maintain strong resale value, making outright purchase economical for GPU-intensive workloads.
*Our forecasts treat driver/restraint impacts as directional, not additive. The impact forecasts reflect baseline growth, mix effects, and variable interactions.
Segment Analysis
By Offering: Integrated Bundles Erode Hardware-Only Dominance
Hardware captured 45.92% share of the PCaaS market in 2025. Providers, however, face declining unit margins as component commoditization intensifies. Bundled solutions, including devices, software, and lifecycle services, are forecast to grow at a 21.53% CAGR. Their higher 25-35% gross margins incentivize vendors to emphasize holistic value rather than chipset specifications. Microsoft’s Surface Plus plan locks customers into a biannual refresh cycle, generating recurring revenue and reinforcing ecosystem stickiness.[3]Microsoft Corporation, “Surface Plus,” microsoft.com
Demand for software-only subscriptions, including virtual desktop and mobile-device-management licenses, is expanding at a 20.1% CAGR, supported by rising compliance overhead. Stand-alone services add another 12.5% to 2025 revenue, particularly depot repair and helpdesk outsourcing, which mitigate labor shortages. Framework’s modular laptop remains a niche counter-current, drawing sustainability-minded buyers even as most customers default to turnkey convenience.


By Organization Size: SME Volume vs. Enterprise Customization
Small and medium enterprises controlled 60.44% of the PCaaS market share in 2025. Ongoing credit constraints heighten the appeal of two-year, fixed-fee plans, which simplify budgeting. Typical contracts limit device selection to fewer than five SKUs, thereby reducing operational complexity for both the buyer and the vendor.
Large enterprises, which account for only 39.56% of 2025 revenue, negotiate customized requirements such as white-glove deployment, multi-vendor fleets, and quarterly governance. The TePAS 2 framework in the UK aggregated public-sector demand worth USD 15 billion equivalent, demonstrating the purchasing power of coordinated enterprise procurement.
By Service Provider Type: Carriers Monetize 5G Assets
OEM-led programs claimed 28.37% of the revenue in 2025 in the PCaaS market, leveraging direct control of supply chains to ensure break-fix within 48 hours. Managed service providers and system integrators jointly accounted for 46.9%, differentiating through consulting and vendor-agnostic procurement.
Telecom carriers are the breakout category, holding 24.74% share yet forecasting a 21.05% CAGR. T-Mobile’s enterprise virtual cellular network delivers sub-20 millisecond latency to laptops, bundling connectivity and hardware into a single invoice. Such convergence compresses OEM margin capture, reallocating value toward network operators.
By End-User Industry: Compliance Drives Healthcare Uptake
The IT and telecom industries accounted for 58.86% of the revenue in 2025 in the PCaaS market, as tech firms treat devices as disposable endpoints and scale their fleets through hiring cycles. Healthcare and life sciences are the fastest-growing verticals, with a 20.92% CAGR, as HIPAA updates compel encryption and network segmentation, features now baked into subscription offers.
The BFSI sector represented 12.4% share, replacing Windows 10 machines ahead of the 2025 end-of-support milestone. Government and defense buyers favor operating-expense financing aligned with annual budgets, whereas education institutions use national frameworks to lease Chromebooks bundled with filtering and management licenses.
Geography Analysis
North America held a 37.21% share of the PC-as-a-Service market in 2025. Enterprises favored operating leases to preserve borrowing capacity as policy rates climbed above 5%. Canada’s rising labor costs and Mexico’s nearshoring boom are driving demand for bilingual helpdesk support and cross-border asset tracking services from regional MSPs.
Asia Pacific is the fastest-growing region at a projected 22.44% CAGR from 2026 to 2031. India’s PC shipments rose 8.1% year over year in Q1 2025, marking seven consecutive quarters of increase. ASEAN’s digital economy surpassed USD 300 billion in gross merchandise value, creating fertile ground for subscription-based financing.[4]Google, Temasek, and Bain and Company, “e-Conomy SEA 2025,” bain.com Japan’s cultural preference for long-term vendor relationships, South Korea’s 50% 5G penetration, and China’s rising urban wages collectively reinforce demand for outsourced device management.
Europe controlled 28.6% revenue in 2025. ESG mandates, such as the EU Ecodesign Regulation, push companies toward centralized take-back programs that are inherently suited to the subscription model. The TePAS 2 framework lowered per-unit subscription costs by up to 18%, enabling smaller public-sector bodies to ride larger economies of scale. South America, the Middle East, and Africa together contribute a small share of 2025 revenue. Saudi Vision 2030 and UAE digital initiatives drive public-sector adoption, while Brazil’s expanding digital economy underpins private-sector demand.

Competitive Landscape
Innovation and Flexibility Drive Market Success
Success in the PCaaS market increasingly depends on providers' ability to offer flexible subscription models, comprehensive device management, and robust security. Market leaders are focusing on developing advanced analytics platforms, automated management tools, and enhanced security solutions to differentiate their offerings. Companies are also investing in building robust partner ecosystems, developing industry-specific solutions, and creating seamless integration capabilities with existing IT infrastructure to address diverse customer needs. The ability to deliver scalable solutions, rapid deployment, and efficient lifecycle management services has become crucial for maintaining a competitive advantage.
For new entrants and smaller players, success lies in identifying underserved market segments, developing specialized solutions for specific industries, and building strong local support networks. Companies need to focus on creating value-added services, implementing efficient operational processes, and maintaining high service quality standards to compete effectively.
The market is increasingly emphasizing sustainability initiatives, circular economy practices, and environmental compliance as key differentiators. Future success will depend on providers' ability to adapt to changing work environments, integrate emerging technologies, and maintain strong customer relationships while managing operational costs effectively. Additionally, the rise of computer leasing and managed workplace solutions is becoming a significant trend, offering businesses flexible and cost-effective options.
PCaaS Industry Leaders
Lenovo Group Ltd
HP Inc.
Dell Technologies Inc.
SHI International Corp.
CompuCom Systems Inc.
- *Disclaimer: Major Players sorted in no particular order

Recent Industry Developments
- December 2025: Asus India announced a plan to raise AI-enabled laptop penetration to 30% by end-2026 through subscription bundles with system integrators.
- October 2025: Microsoft ended Windows 10 support, catalyzing a global device refresh surge serviced largely through zero-upfront-cost subscriptions.
- July 2025: The EU Ecodesign Regulation entered enforcement, boosting subscription models that incorporate centralized take-back programs.
- March 2025: Canalys reported India’s PC market grew 8.1% year on year, underlining robust demand for device subscriptions.
- January 2025: Google, Temasek, and Bain documented Southeast Asia’s USD 300 billion digital economy, spotlighting subscription financing as an enabler for SME digital tools.


Global PCaaS Market Report Scope
PC as a Service (PCaaS), in which a person or organization pays a monthly subscription fee to a vendor to lease endpoint hardware and management services, brings together the user's PC hardware, PC management tools, and PC support specialists.
The PCaaS Market Report is Segmented by Offering (Hardware, Software, Services, Bundled Solutions), Organization Size (Small and Medium Enterprises, Large Enterprises), Service Provider Type (OEM-led, Managed Service Provider-led, Telecom Carrier-led, System Integrator-led), End-User Industry (BFSI, Healthcare and Life Sciences, IT and Telecom, Government and Defense, Education, Retail and E-commerce, Manufacturing, Other End-User Industries), and Geography (North America, South America, Europe, Asia-Pacific, Middle East, Africa). The Market Forecasts are Provided in Terms of Value (USD).
| Hardware |
| Software |
| Services |
| Bundled Solutions |
| Small and Medium Enterprises (SMEs) |
| Large Enterprises |
| OEM-led |
| Managed Service Provider-led |
| Telecom Carrier-led |
| System Integrator-led |
| BFSI |
| Healthcare and Life Sciences |
| IT and Telecom |
| Government and Defense |
| Education |
| Retail and E-commerce |
| Manufacturing |
| Other End-User Industries |
| North America | United States |
| Canada | |
| Mexico | |
| South America | Brazil |
| Argentina | |
| Rest of South America | |
| Europe | Germany |
| United Kingdom | |
| France | |
| Italy | |
| Spain | |
| Rest of Europe | |
| Asia-Pacific | China |
| Japan | |
| India | |
| South Korea | |
| ASEAN | |
| Rest of Asia-Pacific | |
| Middle East | Saudi Arabia |
| United Arab Emirates | |
| Rest of Middle East | |
| Africa | South Africa |
| Nigeria | |
| Rest of Africa |
| By Offering | Hardware | |
| Software | ||
| Services | ||
| Bundled Solutions | ||
| By Organization Size | Small and Medium Enterprises (SMEs) | |
| Large Enterprises | ||
| By Service Provider Type | OEM-led | |
| Managed Service Provider-led | ||
| Telecom Carrier-led | ||
| System Integrator-led | ||
| By End-User Industry | BFSI | |
| Healthcare and Life Sciences | ||
| IT and Telecom | ||
| Government and Defense | ||
| Education | ||
| Retail and E-commerce | ||
| Manufacturing | ||
| Other End-User Industries | ||
| By Geography | North America | United States |
| Canada | ||
| Mexico | ||
| South America | Brazil | |
| Argentina | ||
| Rest of South America | ||
| Europe | Germany | |
| United Kingdom | ||
| France | ||
| Italy | ||
| Spain | ||
| Rest of Europe | ||
| Asia-Pacific | China | |
| Japan | ||
| India | ||
| South Korea | ||
| ASEAN | ||
| Rest of Asia-Pacific | ||
| Middle East | Saudi Arabia | |
| United Arab Emirates | ||
| Rest of Middle East | ||
| Africa | South Africa | |
| Nigeria | ||
| Rest of Africa | ||


Key Questions Answered in the Report
What is the expected revenue for the PCaaS market in 2031?
The PCaaS market is projected to reach USD 252.42 billion by 2031.
How fast is Asia Pacific growing in PCaaS adoption?
Asia Pacific is forecast to register a 22.44% CAGR between 2026 and 2031, the fastest across all regions.
Why are telecom carriers entering the PC subscription space?
Carriers bundle 5G connectivity with laptops, creating a single invoice and monetizing network investments more effectively.
Which segment holds the largest share of PCaaS revenue?
Hardware remains the largest revenue contributor, accounting for 45.92% of 2025 revenue.
What regulatory changes are influencing European adoption?
The EU Ecodesign for Sustainable Products Regulation mandates repairability and recycled-content thresholds that favor centralized take-back programs delivered through subscriptions.
How does hybrid work affect device refresh cycles?
Hybrid work shortens refresh cycles to about two years due to higher wear and remote support limitations, making subscription models more cost-effective.
Page last updated on:


