Synthetic Food Colorant Market Size and Share
Market Overview
| Study Period | 2021 - 2031 |
|---|---|
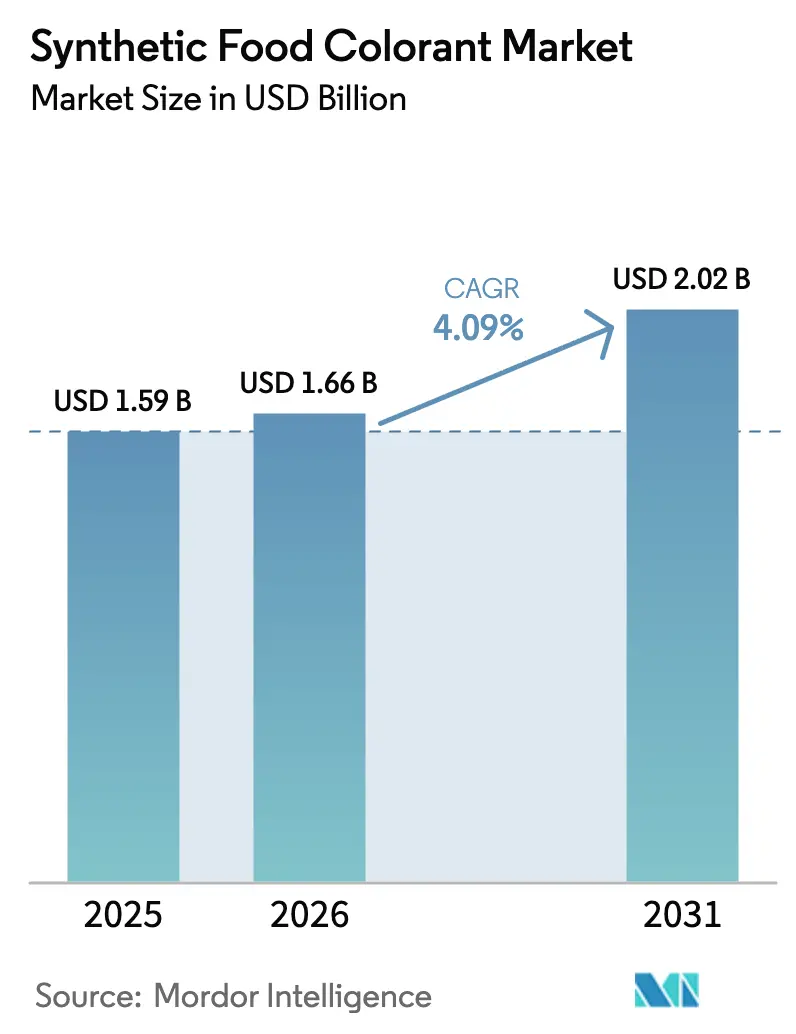
| Market Size (2026) | USD 1.66 Billion |
| Market Size (2031) | USD 2.02 Billion |
| Growth Rate (2026 - 2031) | 4.09% CAGR |
| Fastest Growing Market | Asia Pacific |
| Largest Market | North America |
| Market Concentration | Medium |
Major Players
*Disclaimer: Major Players sorted in no particular order Image © Mordor Intelligence. Reuse requires attribution under CC BY 4.0. |
|
Synthetic Food Colorant Market Analysis by Mordor Intelligence
Synthetic food colorant market size in 2026 is estimated at USD 1.66 billion, growing from 2025 value of USD 1.59 billion with 2031 projections showing USD 2.02 billion, growing at 4.09% CAGR over 2026-2031. The synthetic food colorant market continues to exhibit robust growth, despite the rising consumer inclination toward natural alternatives. This sustained demand is underpinned by the distinct advantages synthetic colorants provide, particularly in terms of functionality and cost efficiency. These benefits are especially significant for food manufacturers who must navigate inflationary pressures while ensuring their products maintain visual appeal and quality. Additionally, synthetic colorants offer superior stability compared to natural alternatives, allowing manufacturers to achieve consistent product performance over extended shelf lives. Furthermore, their lower usage levels and reduced production costs enhance their economic viability, making them a strategic choice for manufacturers aiming to optimize operational efficiency and meet evolving market demands. These factors collectively reinforce the market's resilience and highlight the critical role synthetic colorants play in addressing industry challenges.
Key Report Takeaways
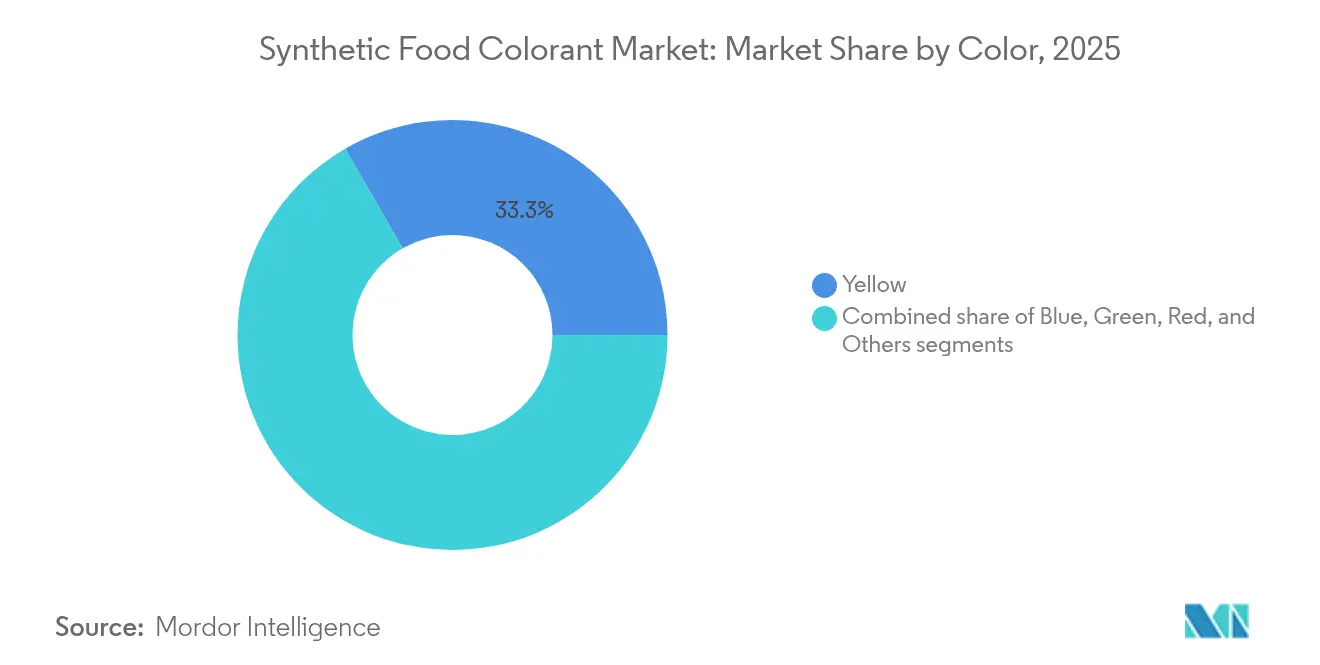
- By color, yellow shades lead with a 33.31% share in 2025, whereas vivid blues accelerate at a 4.63% CAGR for 2026-2031.
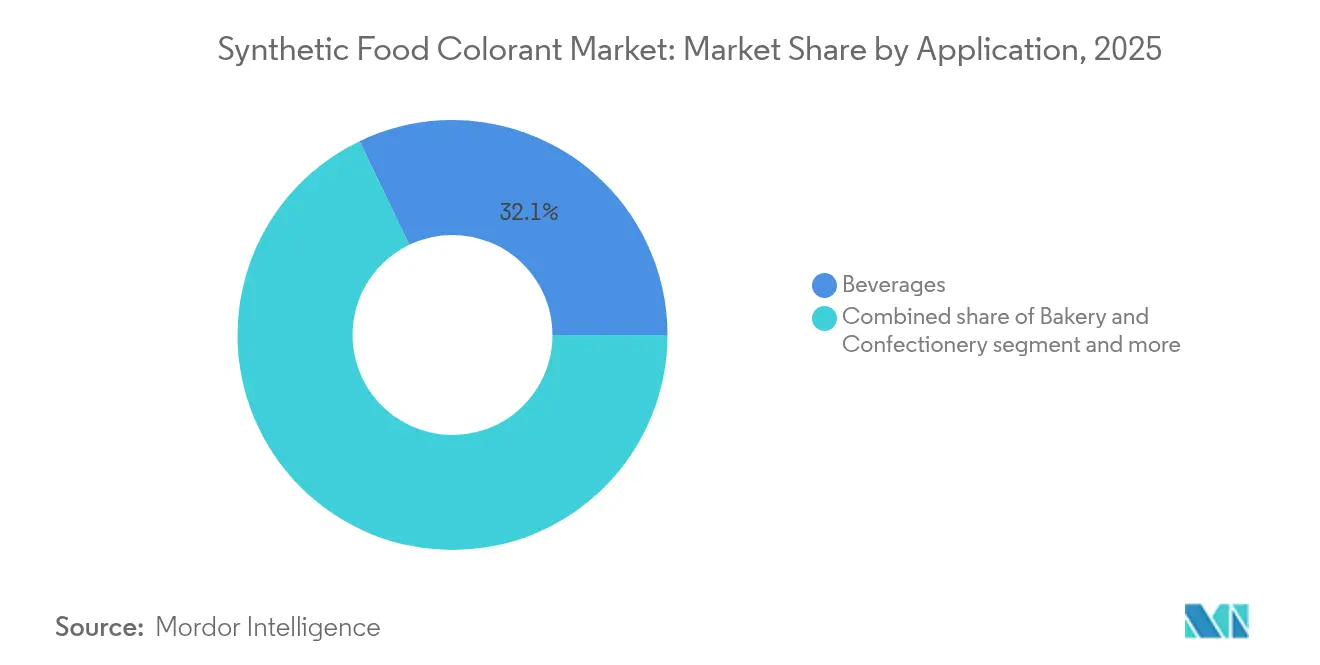
- By application, beverages capture the largest 2025 synthetic food colorant market share at 32.12%, while dairy-based products post the fastest 2026-2031 CAGR of 4.9%.
- By form, powder formats command a dominant 63.65% share in 2025, but liquid dispersions are set to expand at a 5.28% CAGR through 2031.
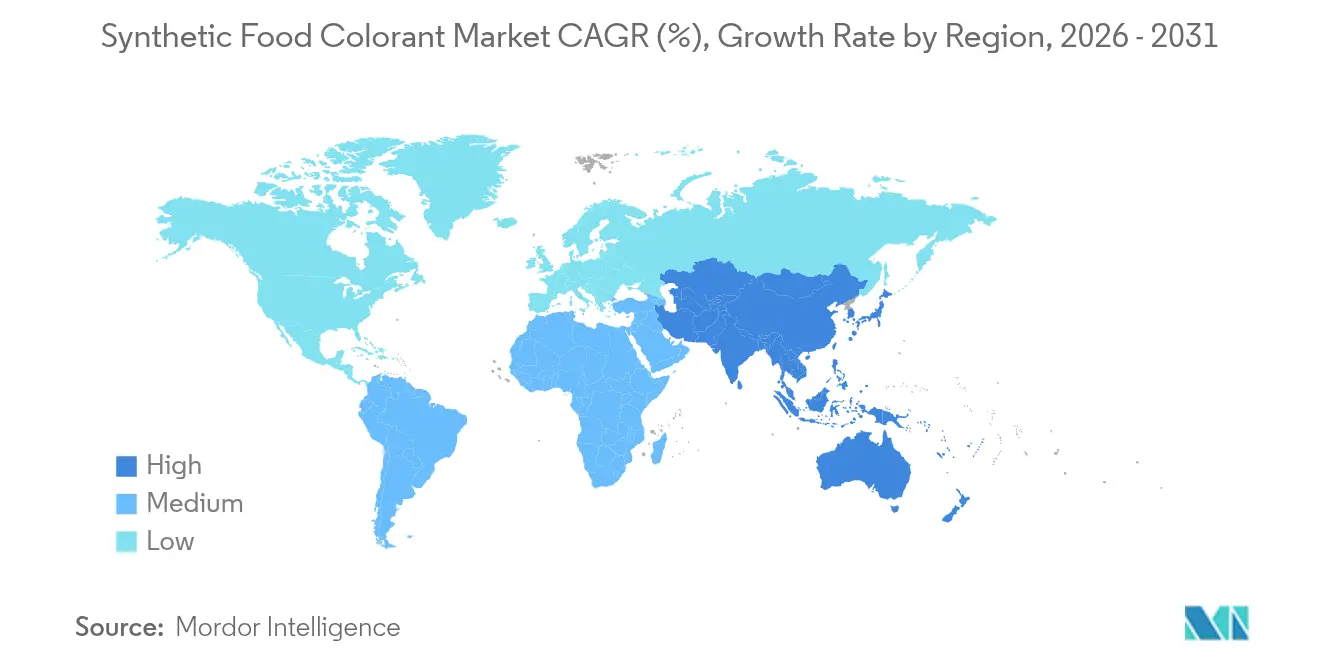
- By geography, North America retains the top regional share at 32.28% in 2025, yet Asia-Pacific is on course for the sharpest growth with a 5.42% CAGR through 2031.
Note: Market size and forecast figures in this report are generated using Mordor Intelligence’s proprietary estimation framework, updated with the latest available data and insights as of 2026.
Global Synthetic Food Colorant Market Trends and Insights
Drivers Impact Analysis*
| Driver | (~) % Impact on CAGR Forecast | Geographic Relevance | Impact Timeline |
|---|---|---|---|
| Higher color stability associated with synthetic food colorant to boost the market growth | +1.2% | Global; stronger in North America and Europe | Medium term (2–4 years) |
| Cost effectiveness to fuel the market for synthetic food colorant market | +0.9% | Asia-Pacific | Short to medium term (1–3 years) |
| Production effectiveness of synthetic food colorants drives market growth | +0.4% | Global | Long term (≥ 4 years) |
| Emerging demand from developing market | +0.3% | Gulf Cooperation Council states | Short term (1–2 years) |
| Relaxation of maximum permitted levels for allura red | +0.3% | Indonesia | Medium term (2–4 years) |
| Expansion of synthetic-only halal certification | +0.2% | Sub-Saharan Africa | Medium term (3–5 years) |
| Source: Mordor Intelligence | |||
Higher Color Stability Associated with Synthetic Food Colorant to Boost the Market Growth
Synthetic food colorants hold a dominant position in the market due to their exceptional ability to maintain stability across a wide range of pH levels, processing temperatures, and shelf-life conditions. Their robust molecular structure ensures high resistance to degradation, even under extreme processing environments. This makes them indispensable for industries such as beverages and baked goods, where maintaining consistent color quality throughout manufacturing and storage processes is crucial.
Also, synthetic dyes such as Tartrazine (yellow) and Allura Red deliver consistent, vibrant colors and extended shelf life compared to natural colorants, making them essential for candies, beverages, and processed snacks. Their stability minimizes product recalls and enhances visual appeal, which impacts consumer acceptance. Fanta implements synthetic colorants in multiple markets to ensure its standardized orange color across varying temperature and storage conditions. The reliability and cost-efficiency of synthetic dyes drive their widespread implementation in industrial food production. Furthermore, this stability significantly reduces material wastage and the need for costly reformulations, offering a strategic advantage as production volumes increase, particularly in emerging markets where scalability is a key growth driver.
Cost Effectiveness to Fuel the Market for Synthetic Food Colorant Market
Food manufacturers are increasingly turning to synthetic colorants due to their cost-effectiveness amid rising ingredient and operational expenses. As reported by the USDA, synthetic colorants are 30-60% more cost-effective compared to natural alternatives. Additionally, they require significantly lower dosages to achieve equivalent color intensity, making them a more economical and efficient choice for businesses. This cost efficiency is particularly critical for mass-market products, where price sensitivity limits reformulation flexibility.
Moreover, in November 2024, the United States Food and Drug Administration (FDA) recently raised certification fees for synthetic colorants, increasing the rate from USD 0.35 to USD 0.45 per pound and the minimum fees from USD 224 to USD 288 [1]Source: United States Food and Drug Administration, "Color Additive Certification; Increase in Fees for Certification Services", fda.gov. These regulatory cost increases, as noted by the Food and Drug Administration, add to manufacturers' expenses. However, synthetic colorants continue to offer a competitive advantage for large-scale production, especially in developing markets where cost considerations often take precedence over clean-label preferences.
Production Effectiveness of Synthetic Food Colorants Drives Market Growth
Synthetic food colorants have emerged as a strategic advantage in the manufacturing sector due to their reliable production processes, scalability, and robust supply chain, which collectively surpass the limitations of natural alternatives. Unlike natural colorants, synthetic variants can be manufactured consistently throughout the year, eliminating seasonal disruptions and ensuring adherence to precise color specifications. This reliability is crucial for maintaining global brand consistency and meeting the high standards of international markets.
Moreover, advancements in microencapsulation technologies are significantly enhancing the functional capabilities of synthetic colorants. By leveraging carriers such as maltodextrin, gum arabic, and whey protein isolate, manufacturers are achieving improved stability in complex food formulations, addressing the demands of diverse applications. Additionally, the controlled synthesis environment inherent to synthetic colorant production minimizes batch-to-batch variability, a critical factor for large-scale food companies focused on delivering consistent visual quality across their global operations.
Emerging Demand from Developing Markets
Developing markets are driving robust growth in synthetic food colorant consumption, propelled by the expansion of the middle class and rapid urbanization, which are accelerating the adoption of processed foods. These regions prioritize synthetic colorants due to their cost-efficiency and durability, particularly in distribution networks with limited cold chain infrastructure.
Additionally, less restrictive regulatory frameworks in many developing nations, compared to Europe or North America, create opportunities for synthetic colorants that face regulatory challenges in developed markets. The increasing preference for Western-style processed foods in countries such as China and India is significantly boosting the demand for yellow and red synthetic colorants, particularly in snack foods, confectionery, and beverages. Concurrently, regional food manufacturers in these markets are increasingly utilizing synthetic colorants to maintain competitive pricing while meeting consumer expectations for visually appealing products.
Restraints Impact Analysis*
| Restraint | (~) % Impact on CAGR Forecast | Geographic Relevance | Impact Timeline |
|---|---|---|---|
| Regulatory restrictions limiting synthetic food colors market | -0.7% | Global; stronger in Europe and North America | Medium term (2–4 years) |
| Health-related concerns restraining market growth | -0.4% | United States and Canada | Short to medium term (1–3 years) |
| Supply tightness of key petrochemical intermediates | -0.4% | Global; acute in Asia-Pacific | Short term (≤ 2 years) |
| Stringent environmental regulations impacting production | -0.3% | Europe; gaining traction in Australasia | Medium term (2–5 years) |
| Source: Mordor Intelligence | |||
Regulatory Restrictions Limiting Synthetic Food Colors Market
Regulatory frameworks are increasingly impacting the synthetic food colorant market as authorities implement stricter limitations driven by emerging health research. In January 2025, the FDA announced the revocation of Red No. 3's authorization for use in food and ingested drugs, providing manufacturers until January 2027 to reformulate their products. This decision aligns with European practices, such as requiring warning labels on products containing specific synthetic colorants.
Additionally, the California Environmental Protection Agency's review, which links synthetic food dyes to potential neurobehavioral issues in children, adds further complexity to the regulatory environment and could influence national policies. These regulatory developments are creating market uncertainty, compelling manufacturers to invest in more stable synthetic alternatives or transition to natural options, despite the higher costs and technical challenges associated with the latter.
Health-Related Concerns Restraining Market Growth
Emerging research is driving shifts in consumer preferences and influencing manufacturers to reformulate products, as synthetic food colorants are increasingly linked to potential health risks. Additionally, toxicological research has raised red flags about commonly used colorants such as Red 40, Yellow 5, and Yellow 6, which have been found to contain carcinogenic contaminants and may cause hypersensitivity reactions in certain individuals. Also, Yellow 5 (Tartrazine), a synthetic colorant, maintains a significant market presence in processed foods, beverages, and pharmaceutical products due to its color stability. Research indicates Yellow 5's association with adverse reactions, specifically in aspirin-sensitive individuals, and potential behavioral effects in children.
The presence of carcinogenic compounds such as benzidine and 4-aminobiphenyl, or their metabolic precursors, has resulted in enhanced regulatory oversight and a market shift toward natural alternatives. Regulatory pressures are intensifying, as seen in the Center for Science in the Public Interest's push for state-level bans and warning labels, along with California's consideration of legislation to prohibit synthetic dyes in public schools. These developments could have a significant impact on market growth.
*Our forecasts treat driver/restraint impacts as directional, not additive. The impact forecasts reflect baseline growth, mix effects, and variable interactions.
Segment Analysis
By Color: Yellow Dominates While Blue Accelerates
Yellow synthetic colorants command the largest market share at 33.31% in 2025, driven by their widespread application in beverages, confectionery, and baked goods, where they create appealing golden and amber hues. Their market dominance is driven by their superior stability under varying pH levels and processing temperatures, making them highly suitable for complex food formulations.
In contrast, blue colorants represent the fastest-growing segment, with a projected CAGR of 4.63% during 2026-2031. This growth is attributed to their expanding applications in confectionery, beverages, and dairy products, which aim to enhance differentiation through innovative visual appeal. Additionally, recent toxicological studies reveal that certain blue colorants, such as Brilliant Blue FCF (FD&C Blue No. 1), exhibit lower inhibitory effects on serotonin release compared to other synthetic colorants. This positions them as potentially safer alternatives amid increasing health-related concerns.


By Form: Powder Leads While Liquid Gains Momentum
The powder form dominates the synthetic food colorant market with a 63.65% share in 2025, benefiting from its extended shelf life, ease of transportation, and precise dosing capabilities in dry food applications. Powder colorants provide manufacturers with key logistical advantages, including reduced shipping expenses and simplified storage without refrigeration.
Conversely, the liquid segment is projected to grow at a faster pace, with a 5.28% CAGR from 2026 to 2031, owing to its superior dispersion properties and operational efficiency in beverages and dairy products. Advancements in liquid colorant formulations are improving their stability under varying pH and temperature conditions, addressing previous limitations. Furthermore, regulatory frameworks established by the European Chemicals Agency are influencing formulation strategies, encouraging manufacturers to develop specialized liquid colorants that comply with stringent purity standards while maintaining high performance.
By Application: Beverages Dominate While Dairy Products Surge
Beverages represent the largest application segment for synthetic food colorants with a 32.12% market share in 2025, driven by the category's massive production volumes and technical requirements for colorants that maintain stability across varying pH levels and processing conditions. Key categories such as carbonated soft drinks, sports drinks, and flavored waters depend on synthetic colorants for their reliable performance and cost efficiency. Also, the beverage industry has witnessed a shift in consumer demand beyond basic hydration needs, with soft drinks now required to deliver diverse experiences through color variations and flavor profiles. This market evolution has driven increased demand for synthetic food colors among soft drink manufacturers. The British Soft Drinks Association reported that carbonated soft drink consumption in the United Kingdom rose from 14.9 billion liters in 2022 to 15 billion liters in 2023 .
Concurrently, the dairy segment is positioned as the fastest-growing application, with a projected CAGR of 4.9% during 2026-2031. This growth is driven by increasing consumer demand for visually appealing products, including yogurts, flavored milk, and ice cream. Advancements in microencapsulation technologies are instrumental in protecting synthetic colorants from interactions with dairy proteins and fats, thereby enhancing their stability throughout the product's shelf life. Whey protein isolate in encapsulation, demonstrating its ability to improve synthetic colorant stability under high humidity and digestive conditions, making it particularly valuable for dairy applications.
Geography Analysis
North America holds the largest share of the synthetic food colorant market at 32.28% in 2025, driven by its advanced food processing infrastructure and strong demand for colored processed foods. However, the market faces a complex regulatory environment. The FDA's recent decision to revoke authorization for Red No. 3 in food and ingested drugs by January 2027 has initiated significant reformulation efforts across the industry . This regulatory change, highlighted by the Food and Drug Administration, is fostering innovation in alternative synthetic colorants that address safety concerns while maintaining performance. Additionally, advocacy from the Center for Science in the Public Interest for state-level restrictions on synthetic colorants has created a fragmented regulatory framework, compelling manufacturers to develop region-specific formulation strategies.
The Asia-Pacific region is projected to be the fastest-growing market for synthetic food colorants, with a CAGR of 5.42% forecasted for 2026-2031. This growth is attributed to rapid urbanization, an expanding middle class, and increasing consumption of processed foods. China and India are key growth drivers, with their large populations and evolving dietary habits fueling demand for visually appealing food products. Compared to Europe and North America, the region's less restrictive regulatory environment offers opportunities for synthetic colorants that face limitations in developed markets. Local manufacturers are increasingly adopting synthetic colorants to balance competitive pricing with consumer expectations for visually attractive products. Moreover, the region's tropical climate and logistical challenges favor synthetic colorants due to their superior stability under varying temperature and humidity conditions.
Europe's synthetic food colorant market is shaped by its stringent regulatory framework. The European Food Safety Authority (EFSA) requires warning labels for certain synthetic colors and conducts ongoing reassessments of previously approved additives. This regulatory environment has driven many manufacturers to reformulate products using natural alternatives, despite their higher costs and technical challenges. The European Commission's Regulation (EU) No 231/2012 outlines detailed specifications for food additives, including strict purity standards for synthetic colorants, such as limits on heavy metals and other contaminants. These rigorous requirements influence global formulation strategies, as manufacturers aim to meet these high standards while ensuring consistent visual appeal across international markets.

Competitive Landscape
The synthetic food colorant market is moderately consolidated, with leading companies leveraging their technical expertise and regulatory compliance to sustain their competitive edge. Prominent players such as Sensient Technologies Corporation, Vibfast Pigments Pvt. Ltd, Red Sun Dye Chem, Roha Group, and Neelikon Food Dyes & Chemicals are increasingly investing in the development of synthetic colorants that offer enhanced safety and application-specific performance.
Opportunities are emerging in the development of specialized synthetic colorants for complex applications, such as plant-based dairy and meat alternatives, where maintaining color stability during processing and storage remains a significant challenge. Smaller innovators are gaining market traction by focusing on microencapsulation technologies that improve the performance of synthetic colorants in specific food matrices.
Leading beverage companies are forming strategic partnerships with chemical suppliers to pilot "post-Red 3" scarlet colors under real-world logistical conditions. Patent activity highlights increasing interest in water-soluble aluminum lake formulations designed to minimize bleed in layered confectionery products. Simultaneously, ingredient distributors are enhancing their technical support capabilities to assist small and medium-sized bakeries in adapting to evolving compliance requirements. This shift underscores how support services have transitioned into a distinct revenue stream, complementing pigment sales and strengthening client relationships.
Synthetic Food Colorant Industry Leaders
-
Sensient Technologies Corporation
-
Vibfast Pigments Pvt. Ltd
-
Red Sun Dye Chem
-
Roha Group
-
Neelikon Food Dyes & Chemicals
- *Disclaimer: Major Players sorted in no particular order

Recent Industry Developments
- October 2022: Sensient Technologies Corporation established a new research and development facility in Somerset, New Jersey. The 21,000-square-foot facility focuses on research and development operations. The company manufactures and markets colors, flavors, and specialty ingredients globally.
- March 2021: Univar Solutions Inc., a global chemical and ingredient distributor, signed an expanded distribution agreement with Sensient Technologies to supply synthetic coloring products in Mexico. The agreement encompasses the food, beverage, nutraceutical, and pharmaceutical markets.


Research Methodology Framework and Report Scope
Market Definitions and Key Coverage
Our study defines the synthetic food colorant market as the total revenue earned from chemically synthesized color additives sold in powder or liquid form for human food and beverage formulations worldwide.
Scope Exclusions: Natural, nature-identical, caramel colors, and all non-food end uses are outside scope.
Segmentation Overview
-
By Color
- Blue
- Green
- Red
- Yellow
- Others
-
By Form
- Powder
- Liquid
-
By Application
- Bakery and Confectionery
- Dairy-based Products
-
Beverages
- Alcoholic Beverages
- Non-alcoholic Beverages
- Nutraceuticals
- Snacks and Cereals
- Other Applications
-
By Geography
-
North America
- United States
- Canada
- Mexico
- Rest of North America
-
Europe
- Germany
- United Kingdom
- Italy
- France
- Spain
- Netherlands
- Poland
- Belgium
- Sweden
- Rest of Europe
-
Asia-Pacific
- China
- India
- Japan
- Australia
- Indonesia
- South Korea
- Thailand
- Singapore
- Rest of Asia-Pacific
-
South America
- Brazil
- Argentina
- Colombia
- Chile
- Peru
- Rest of South America
-
Middle East and Africa
- South Africa
- Saudi Arabia
- United Arab Emirates
- Nigeria
- Egypt
- Morocco
- Turkey
- Rest of Middle East and Africa
-
North America
Detailed Research Methodology and Data Validation
Primary Research
Mordor analysts spoke with formulation chemists at beverage brands, regional food-safety officers, and managers at dye manufacturers across North America, Europe, and Asia. These discussions validated average inclusion rates, price tiers, and demand swings before projections were finalized.
Desk Research
We collated price and shipment volumes from United States ITC, Eurostat Comext, UN Comtrade, and India's DGFT trade codes that isolate artificial coloring preparations. Regulatory ceilings and intake limits were mapped from the FDA Color Additive Status List, EFSA opinions, and FSSAI standards, while listed producers' 10-Ks and press releases revealed selling-price trends that fed our model. Subscription datasets such as D&B Hoovers and Dow Jones Factiva verified company revenue splits and plant capacities. The sources noted are illustrative; many further publications were reviewed for completeness.
Market-Sizing & Forecasting
A top-down construct began with global synthetic dye output reported in customs data, adjusted by the food-use share and weighted average selling price to arrive at the market value. Supplier roll-ups on six leading producers served as a bottom-up check. Key drivers include packaged beverage production, snack volumes, legislative caps on azo dyes, formulation dosage norms, and currency trends. A multivariate regression with ARIMA overlay projected each driver through the forecast period, with data gaps bridged by utilization factors agreed during expert calls.
Data Validation & Update Cycle
Outputs undergo peer review and variance screening against historic trade, corporate guidance, and producer price indices. Reports refresh every twelve months, with interim updates triggered by major regulatory or capacity shifts so clients receive the latest view.
Why Mordor's Synthetic Food Colorant Baseline Commands Reliability
Published estimates often diverge because firms mix natural and synthetic ranges, apply different dosage factors, or lock assumptions for several years.
Key Gap Drivers include the blending of natural pigments into totals, reliance on unverified producer questionnaires, or currency treatments that do not match trade realities, unlike Mordor's disciplined scope choices and annual refresh. Estimates from one global consultancy place the broader food colors market at USD 4.0 billion for 2025, while a trade journal cites USD 3.31 billion for 2024.
Benchmark comparison
| Market Size | Anonymized source | Primary gap driver |
|---|---|---|
| USD 1.59 bn (2025) | Mordor Intelligence | - |
| USD 4.00 bn (2025) | Global Consultancy A | Combines natural and synthetic colors; limited trade verification |
| USD 3.31 bn (2024) | Trade Journal B | Relies on retail-price extrapolation and infrequent model refresh |
These comparisons show that Mordor's stepwise, source-traceable process yields a balanced, dependable baseline for decision-makers.


Key Questions Answered in the Report
What is the synthetic food colorant market size forecast for 2031?
The global market is forecast to reach USD 2.02 billion by 2031 on a 4.09% CAGR trajectory.
Which region commands the largest market share?
North America leads, holding 32.28% of 2025 revenue, owing to a mature processing ecosystem and well-defined FDA certification procedures.
Which application segment is expected to grow fastest?
Dairy-based products are projected to post the highest value CAGR (4.9%) through 2031, driven by encapsulation technologies that preserve color in high-protein matrices.
What is the outlook for liquid synthetic colour formulations?
Liquids should outpace powders due to their instantaneous dispersion in beverages and compatibility with high-speed inline dosing systems.
Page last updated on:


