Big Data Engineering Services Market Size and Share
Market Overview
| Study Period | 2020 - 2031 |
|---|---|
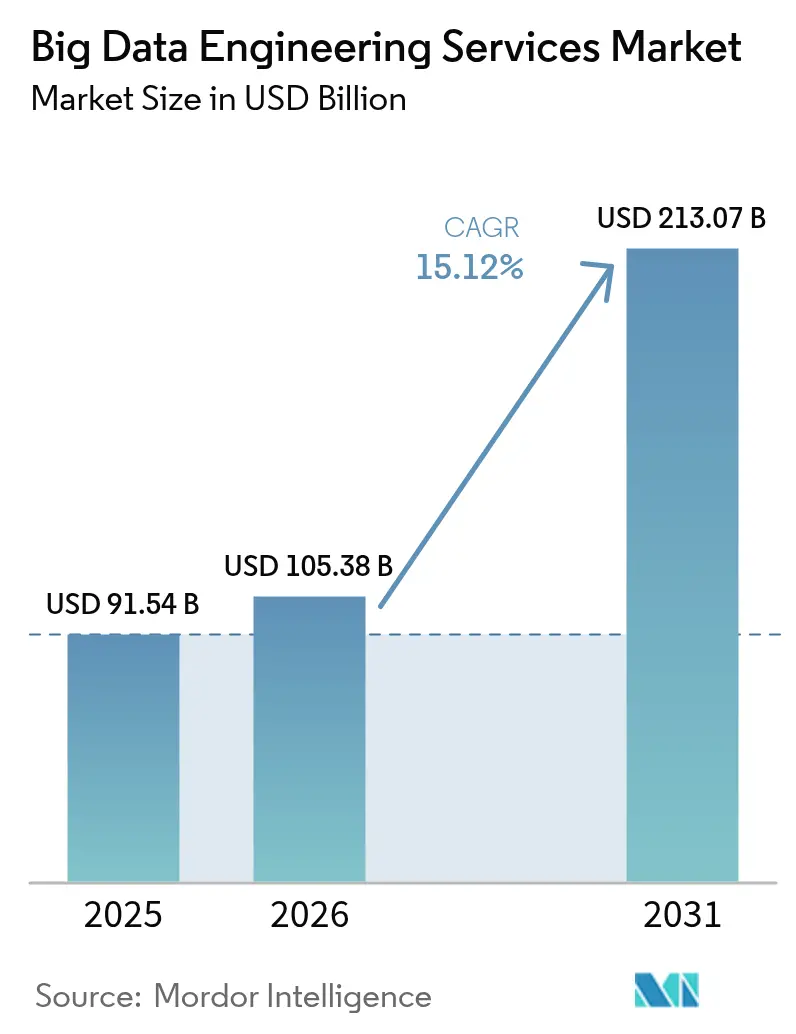
| Market Size (2026) | USD 105.38 Billion |
| Market Size (2031) | USD 213.07 Billion |
| Growth Rate (2026 - 2031) | 15.12% CAGR |
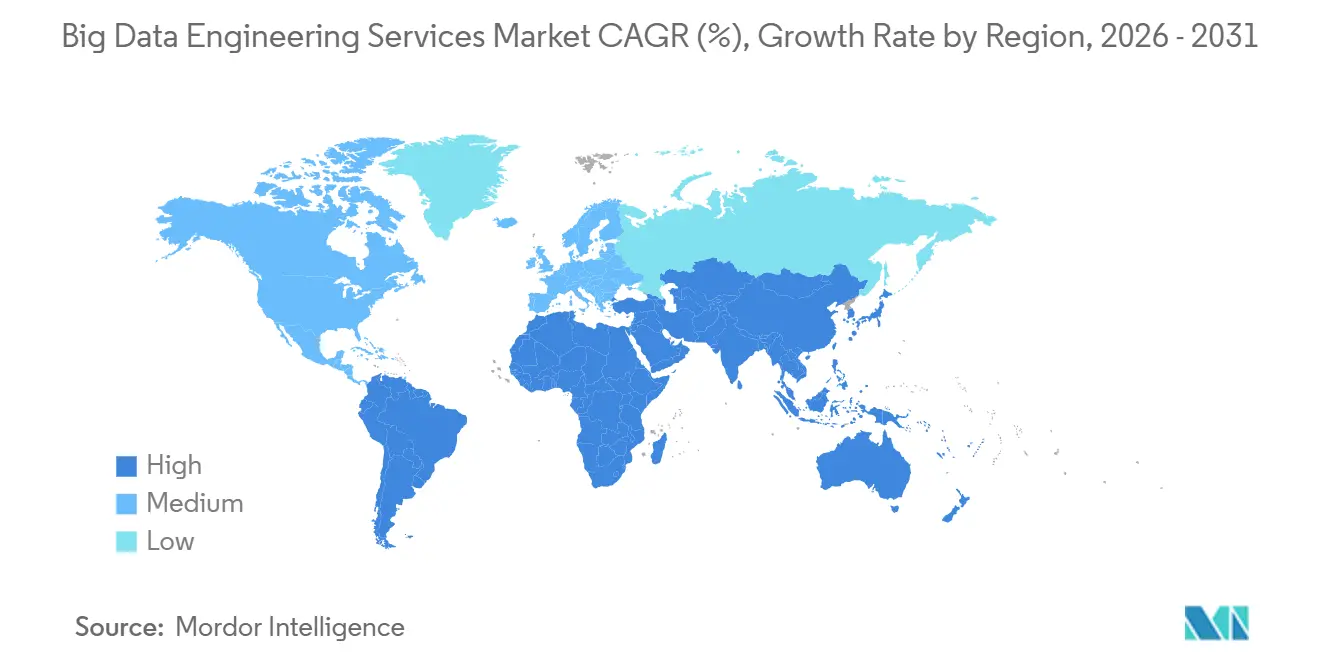
| Fastest Growing Market | Asia Pacific |
| Largest Market | North America |
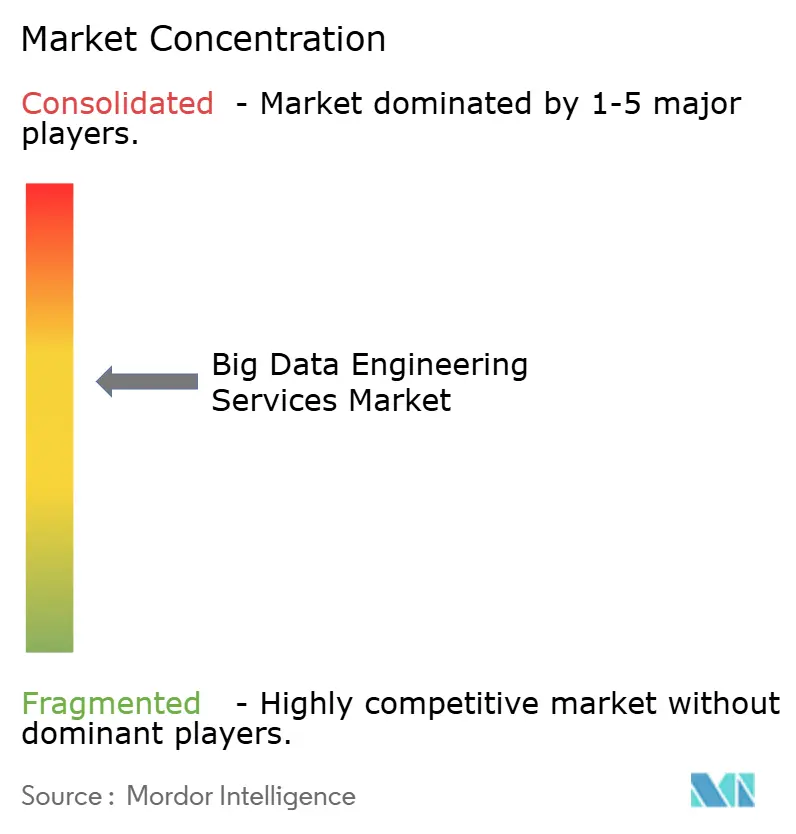
| Market Concentration | Medium |
Major Players *Disclaimer: Major Players sorted in no particular order Image © Mordor Intelligence. Reuse requires attribution under CC BY 4.0. | |
Big Data Engineering Services Market Analysis by Mordor Intelligence
The big data engineering services market size is expected to grow from USD 91.54 billion in 2025 to USD 105.38 billion in 2026 and is forecast to reach USD 213.07 billion by 2031 at a 15.12% CAGR over 2026-2031. Growing volumes of sensor telemetry, social media streams, and video files have propelled enterprises to replace batch data warehouses with real-time lakehouse pipelines. Cloud-native deployments already underpin more than 60% of production environments, while AI-driven orchestration cuts extract-transform-load cycles from weeks to hours. Hybrid architectures are gaining favor in regulated sectors that must retain sensitive records on-premises while still needing elastic compute for non-critical analytics. A persistent talent shortage and rising compliance costs temper growth, yet outcome-based pricing models lower entry barriers for small and medium enterprises, broadening the big data engineering services market footprint.
Key Report Takeaways
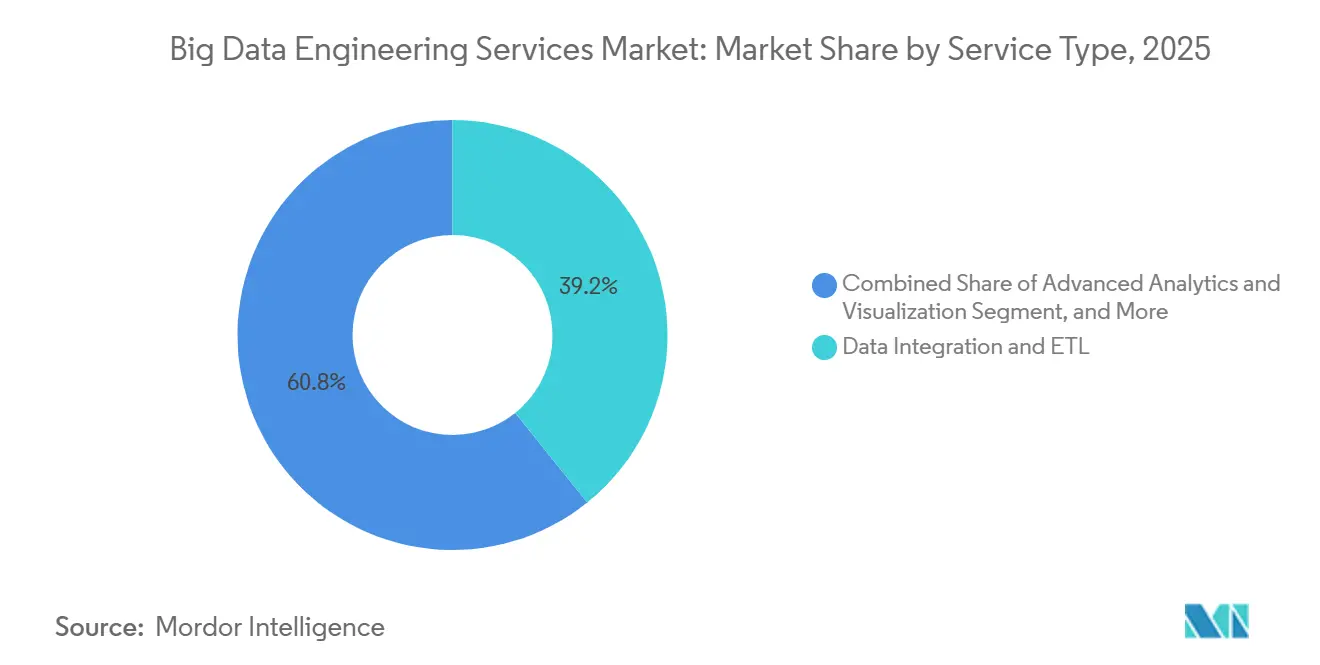
- By service type, Data Integration and ETL led with 39.22% of the big data engineering services market share in 2025, while Advanced Analytics and Visualization is projected to expand at a 15.91% CAGR through 2031.
- By business function, Marketing and Sales accounted for 34.86% of spending in 2025; Operations and Supply Chain are set to grow at a 15.96% CAGR to 2031.
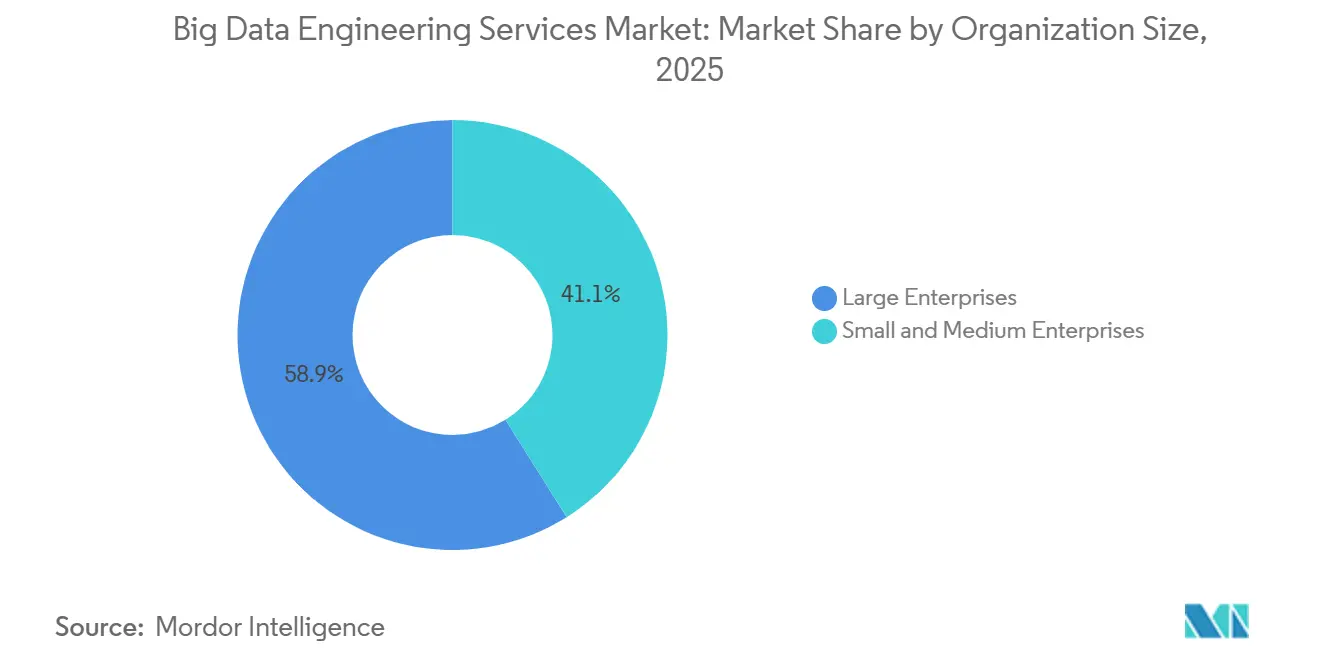
- By organization size, Large Enterprises captured 58.91% of the big data engineering services market share in 2025, whereas Small and Medium Enterprises are forecast to advance at a 15.56% CAGR.
- By deployment mode, cloud deployments held 63.47% of the big data engineering services market share in 2025, yet hybrid architectures will register the fastest 15.78% CAGR through 2031.
- By geography, North America dominated with a 42.38% share in 2025, and Asia-Pacific is expected to post the strongest 16.14% CAGR over the forecast period.
Note: Market size and forecast figures in this report are generated using Mordor Intelligence’s proprietary estimation framework, updated with the latest available data and insights as of 2026.
Global Big Data Engineering Services Market Trends and Insights
Drivers Impact Analysis*
| Driver | (~) % Impact on CAGR Forecast | Geographic Relevance | Impact Timeline |
|---|---|---|---|
| Proliferation of Unstructured IoT and Social Data | +3.5% | Global, concentrated in North America manufacturing belt and Asia-Pacific smart-city corridors | Medium term (2-4 years) |
| Cost-Efficient, Outcome-Based Service Contracts | +2.8% | North America and Europe, expanding in Asia-Pacific | Short term (≤ 2 years) |
| Cloud-Native Big-Data Stack Adoption | +3.2% | Global, led by North America and Europe, rapid uptake in India and Southeast Asia | Short term (≤ 2 years) |
| Regulatory Push for Data-Driven Decision Making | +2.5% | Europe, North America, Asia-Pacific emerging frameworks | Long term (≥ 4 years) |
| Rise of AI-Automated Data Pipelines | +3.0% | Global, early adoption in North America technology sector and Asia-Pacific e-commerce | Medium term (2-4 years) |
| Industry-Specific Data Marketplaces | +2.0% | North America healthcare and finance, Europe manufacturing, Asia-Pacific retail | Long term (≥ 4 years) |
| Source: Mordor Intelligence | |||
Proliferation of Unstructured IoT and Social Data
Enterprises now ingest millisecond sensor readings, surveillance video, and conversational transcripts that together surpassed 181 zettabytes in 2025. Manufacturing lines stream vibration metrics from every robotic joint to remote object stores, while retailers fuse ceiling-mounted camera feeds with point-of-sale receipts to refine planograms.[1]Siemens AG, “Annual Report 2025,” siemens.com Social channels add sentiment signals that marketers activate within minutes, forcing a pivot from nightly batches to continuous pipelines. Schema-on-read techniques postpone modeling until query time, avoiding rigid relational constraints. The big data engineering services market, therefore, prioritizes streaming platforms that keep latency below 1 minute to minimize customer churn.
Cost-Efficient, Outcome-Based Service Contracts
Variable billing tied to queries processed or records scanned lets finance chiefs match spend with revenue. Service-level agreements now promise 99.9% pipeline uptime, shifting risk to vendors and spurring automation that curbs labor hours.[2]Accenture plc, “Annual Report 2025,” accenture.com Mid-market firms benefit most, gaining enterprise-grade data infrastructure without capital expenditure shocks. Penalties for missed performance targets heighten provider accountability, fostering the use of reusable accelerators over custom code. This commercial realignment expands the big data engineering services market beyond Global 2000 buyers.
Cloud-Native Big-Data Stack Adoption
Lakehouse designs unify object storage and SQL governance, so firms retire parallel Hadoop and relational estates. Zero-ETL replication moves transactions from operational databases to analytical stores in seconds, turning month-end reporting into near-real-time dashboards. Elastic clusters scale to zero when idle, trimming infrastructure bills by 60%. Open table formats like Iceberg enable time-travel queries and schema evolution, cementing the cloud as the preferred foundation. This adoption wave underpins more than half of current engagements in the big data engineering services market.
Regulatory Push for Data-Driven Decision Making
GDPR penalties reached EUR 4.5 billion (USD 5.0 billion) during 2024-2025, compelling the adoption of traceable data lineage and real-time consent management.[3]European Data Protection Board, “Annual Report 2025,” edpb.europa.eu U.S. state laws shortened data access deadlines, pressuring retailers to deploy instant query capabilities. Bank regulators require feature-level provenance, and healthcare auditors demand immutable access logs. Compliance now consumes a fifth of data engineering budgets, yet it also drives demand for governance toolchains delivered as managed services. Policy momentum, therefore, bolsters the trajectory of the big data engineering services market.
Restraints Impact Analysis*
| Restraint | (~) % Impact on CAGR Forecast | Geographic Relevance | Impact Timeline |
|---|---|---|---|
| Acute Shortage of Data-Engineering Talent | −2.5% | Global, most severe in North America and Europe | Short term (≤ 2 years) |
| Cyber-Security and Privacy Compliance Costs | −2.0% | Europe, North America, rising in Asia-Pacific | Medium term (2-4 years) |
| Legacy System Integration Complexity | −1.8% | North America and Europe mainframe estates | Long term (≥ 4 years) |
| Cloud-Egress and Vendor-Lock-In Economics | −1.5% | Global multi-national enterprises | Medium term (2-4 years) |
| Source: Mordor Intelligence | |||
Acute Shortage of Data-Engineering Talent
Demand exceeded supply three-to-one in 2025 as new tools outpaced university curricula. Senior engineers in Silicon Valley now command USD 250,000 packages. Offshore centers in India and Eastern Europe offer relief, yet coordination overhead dilutes savings. The gap fuels premium pricing for managed services, but it also slows internal projects, restraining the big data engineering services market in the near term.
Cyber-Security and Privacy Compliance Costs
The average breach cost hit USD 4.88 million in 2025. Mandatory encryption and multi-cloud key rotation add operational drag, cutting query speeds by up to 40%. Audit evidence consumes hundreds of engineering hours each year, diverting talent from innovation. These overheads raise the total cost of ownership and can defer adoption among budget-constrained organizations, moderating the growth of the big data engineering services market.
*Our forecasts treat driver/restraint impacts as directional, not additive. The impact forecasts reflect baseline growth, mix effects, and variable interactions.
Segment Analysis
By Service Type: Integration Core, Analytics Ascending
Data Integration and ETL services captured 39.22% of the big data engineering services market share in 2025, making them the single largest revenue stream within the segment mix. Clients depend on these engagements to unify siloed ERP, CRM, and IoT data into lakehouse environments, ensuring schema consistency and reliable lineage. The big data engineering services market size tied to Integration and ETL remains resilient because schema drift and legacy system quirks continue to break pipelines, requiring constant refactoring. Meanwhile, Advanced Analytics and Visualization is projected to grow at a 15.91% CAGR through 2031 as enterprises move beyond descriptive insights to predictive and prescriptive models that recommend real-time actions.
Zero-ETL replication technologies that stream operational data directly into analytical stores are compressing latency, yet they shift transformation ownership to domain teams and heighten governance complexity. Vendors now bundle observability, cataloging, and lineage tracking with core ingestion work to safeguard metric consistency across business units. Automated data quality checks flag duplicate records or out-of-range sensor readings before they tarnish executive dashboards, reinforcing demand for integrated platforms. As a result, buyers increasingly favor single-vendor offerings that span ingestion to visualization, compressing procurement cycles and reducing vendor sprawl within the big data engineering services market.


By Business Function: Marketing Commands, Operations Accelerates
Marketing and Sales accounted for 34.86% of the big data engineering services market in 2025 as firms raced to build customer data platforms that deliver millisecond-level personalization. These projects stitch together clickstream, call-center, and point-of-sale data so that recommendation engines can adapt website content on the fly. Real-time audience segmentation demands sub-second query performance, which drives heavy investment in in-memory feature stores and streaming orchestration. In parallel, Finance leverages streaming analytics for fraud detection and regulatory reporting, while Human Resources pilots attrition-prediction models, although privacy sensitivities in Europe slow the latter.
Operations and Supply-Chain workloads are set to expand at a 15.96% CAGR, positioning them as the fastest-rising business function through 2031. Predictive maintenance algorithms parse industrial IoT telemetry to forecast equipment failures days in advance, avoiding costly unplanned downtime. Retailers and manufacturers also integrate shipping manifests and GPS feeds to reroute inventory when ports clog or geopolitics shifts. Reverse ETL tools that send analytical outputs back into operational systems ensure frontline teams see propensity scores or risk alerts where they work, closing the action loop. This front-to-back integration elevates Operations from a cost center to a strategic growth lever, widening its role in the big data engineering services market.
By Organization Size: Enterprises Lead, SMEs Gain Pace
Large Enterprises accounted for 58.91% of the big data engineering services market share in 2025, driven by multi-year cloud migrations that often exceed USD 50 million in spend. These organizations prioritize providers with global delivery, 24/7 support, and exhaustive security certifications, which tilts awards toward tier-one integrators. Long budgeting cycles and complex governance reviews extend project timelines, yet once underway, contracts can span five years and hundreds of workloads, anchoring predictable revenue for service vendors.
Small and Medium Enterprises will post a robust 15.56% CAGR through 2031 as consumption pricing aligns spend with revenue growth. Low-code data pipeline tools let ten-person engineering teams achieve maturity once reserved for firms with 100 engineers, trimming time-to-insight from months to days. Managed services priced on rows processed or queries executed further reduce entry barriers and sidestep the talent crunch. Still, SMEs remain cautious of vendor lock-in from proprietary transformation layers, prompting hybrid operating models that combine open-source frameworks with commercial accelerators. This careful balancing act underscores the widening opportunity for right-sized offerings within the big data engineering services market.
By Deployment Mode: Cloud Dominant, Hybrid Rising
Cloud deployments accounted for 63.47% of big data engineering services market revenue in 2025, as enterprises embraced managed elasticity, automated scaling, and lower upfront costs. Managed lakehouse platforms eliminate hardware refresh cycles and patch management, freeing engineers to focus on model development rather than infrastructure upkeep. Multi-region availability zones also underpin global disaster-recovery strategies, an essential requirement for always-on digital businesses.
Hybrid deployment models, however, are forecast to achieve the highest CAGR of 15.78% because regulated industries must retain sensitive records on premises while tapping cloud burst capacity for non-sensitive analytics. Financial institutions often keep transaction ledgers in local data centers yet push risk simulations to public-cloud GPU clusters, blending compliance with compute elasticity. Stateful edge devices in manufacturing plants similarly stream only summarized telemetry to cloud stores, minimizing egress costs while satisfying latency demands. Kubernetes-based analytic engines promise portability across environments but require advanced DevOps skills, creating fresh advisory opportunities. This dual-footprint strategy expands total addressable demand and cements hybrid solutions as a critical growth vector for the big data engineering services market.
Geography Analysis
North America contributed 42.38% of 2025 revenue thanks to dense hyperscaler footprints in low-cost power regions and a patchwork of state privacy statutes that necessitate fine-grained governance. Venture capital continues to finance open-source commercializations, feeding a pipeline of acquisition targets for global integrators. Canada grapples with cross-border data transfer assessments under PIPEDA, while Mexico’s near-shoring boom boosts supply-chain telemetry projects.
Asia-Pacific is set to be the fastest-growing region, with a 16.14% CAGR. India’s Digital India fund injects USD 1.2 billion into national data infrastructure, and China’s provincial subsidies offset half of migration costs for state-owned manufacturers. Japan mandates digital twins across automotive plants by 2026, driving IoT integration work. South Korea extends subject rights to algorithmic transparency, increasing demand for explainable AI pipelines. Australia designates data centers as critical infrastructure, triggering managed security projects bundled with engineering services.
Europe remains governed by GDPR, which levied EUR 4.5 billion (USD 5.0 billion) in fines across 2024-2025, making lineage and consent management non-negotiable. Germany enforces on-premises rules for critical infrastructure, France funds a sovereign cloud, and the United Kingdom’s post-Brexit adequacy is still provisional, adding uncertainty. South America starts with Brazil’s LGPD, while Middle East sovereign funds finance hyperscale data centers as part of smart-city initiatives. Africa sees pilots in South Africa and Nigeria, though unreliable grids restrict broader adoption.

Competitive Landscape
The big data engineering services market is moderately fragmented, with the top 10 vendors accounting for roughly 45% of the market share. Accenture, IBM, and Cognizant leverage global delivery centers for follow-the-sun support, whereas hyperscalers blur the lines between software and consulting by embedding professional services into platform subscriptions. Indian majors such as Tata Consultancy Services and Infosys compete on cost arbitrage, yet wage inflation narrows that gap.
Niche consultancies like Thoughtworks and Slalom differentiate through agile, on-site engagement models that speed knowledge transfer. Platform vendors, notably Databricks and Snowflake, now hire ex-Big Four consultants to deliver end-to-end implementations, disintermediating traditional integrators. Patent trends underscore specialization. IBM focuses on federated learning while Palantir advances graph-based lineage management.
Industry-specific data marketplaces are emerging as a new battleground. Healthcare clearinghouses and retail point-of-sale aggregators require tight schema harmonization, creating openings for boutique firms with vertical expertise. Security certifications such as ISO 27001 and SOC 2 Type II have become table stakes, with procurement teams excluding uncertified bidders from shortlists.
Big Data Engineering Services Industry Leaders
Accenture plc
Cognizant Technology Solutions Corporation
Capgemini SE
Infosys Limited
Genpact Limited
- *Disclaimer: Major Players sorted in no particular order

Recent Industry Developments
- January 2026: Snowflake released Snowpark Container Services to run custom Python and Java inside its data cloud without data egress.
- December 2025: Databricks acquired Tabular for USD 1.2 billion to bolster Iceberg table capabilities.
- November 2025: Tata Consultancy Services won a USD 500 million contract to migrate more than 200 Teradata warehouses to Google BigQuery for a European automaker.
- October 2025: Amazon Web Services introduced Aurora-to-Redshift Zero-ETL replication, reducing dashboard latency to under one minute.


Global Big Data Engineering Services Market Report Scope
The Big Data Engineering Services Market Report is Segmented by Service Type (Data Modelling and Architecture, Data Integration and ETL, Data Quality and Governance, Advanced Analytics and Visualization), Business Function (Marketing and Sales, Finance, Operations and Supply-Chain, Human Resources), Organization Size (Small and Medium Enterprises, and Large Enterprises), Deployment Mode (Cloud, On-Premises, Hybrid), and Geography (North America, South America, Europe, Asia-Pacific, Middle East and Africa). The Market Forecasts are Provided in Terms of Value (USD).
| Data Modelling and Architecture |
| Data Integration and ETL |
| Data Quality and Governance |
| Advanced Analytics and Visualization |
| Marketing and Sales |
| Finance |
| Operations and Supply-Chain |
| Human Resources |
| Small and Medium Enterprises |
| Large Enterprises |
| Cloud |
| On-Premises |
| Hybrid |
| North America | United States | |
| Canada | ||
| Mexico | ||
| South America | Brazil | |
| Argentina | ||
| Rest of South America | ||
| Europe | United Kingdom | |
| Germany | ||
| France | ||
| Italy | ||
| Rest of Europe | ||
| Asia Pacific | China | |
| Japan | ||
| India | ||
| South Korea | ||
| Rest of Asia Pacific | ||
| Middle East and Africa | Middle East | United Arab Emirates |
| Saudi Arabia | ||
| Rest of Middle East | ||
| Africa | South Africa | |
| Egypt | ||
| Rest of Africa | ||
| By Service Type | Data Modelling and Architecture | ||
| Data Integration and ETL | |||
| Data Quality and Governance | |||
| Advanced Analytics and Visualization | |||
| By Business Function | Marketing and Sales | ||
| Finance | |||
| Operations and Supply-Chain | |||
| Human Resources | |||
| By Organization Size | Small and Medium Enterprises | ||
| Large Enterprises | |||
| By Deployment Mode | Cloud | ||
| On-Premises | |||
| Hybrid | |||
| By Geography | North America | United States | |
| Canada | |||
| Mexico | |||
| South America | Brazil | ||
| Argentina | |||
| Rest of South America | |||
| Europe | United Kingdom | ||
| Germany | |||
| France | |||
| Italy | |||
| Rest of Europe | |||
| Asia Pacific | China | ||
| Japan | |||
| India | |||
| South Korea | |||
| Rest of Asia Pacific | |||
| Middle East and Africa | Middle East | United Arab Emirates | |
| Saudi Arabia | |||
| Rest of Middle East | |||
| Africa | South Africa | ||
| Egypt | |||
| Rest of Africa | |||


Key Questions Answered in the Report
How fast is spending on big data engineering growing worldwide?
Global revenue is projected to rise at a 15.12% CAGR from 2026 to 2031, more than doubling from USD 105.38 billion in 2026 to USD 213.07 billion in 2031.
Which regions will see the quickest uptake of real-time data pipelines?
Asia-Pacific leads with a forecast 16.14% CAGR as public initiatives in India, China, and Japan fund national data infrastructure and industrial IoT programs.
What service category currently brings in the most revenue?
Data Integration and ETL accounts for 39.22% of 2025 spending, reflecting persistent demand for connecting diverse source systems.
Why are hybrid deployments growing faster than pure cloud?
Regulated industries keep sensitive records on premises for residency and latency reasons, yet burst non-critical workloads to the cloud for elastic compute, driving a 15.78% CAGR in hybrid adoption.
How severe is the talent shortage in data engineering?
In 2025 demand outstripped supply three-to-one, with senior engineers commanding USD 250,000 total compensation, pushing many firms toward managed services.
What is the main compliance pressure shaping data platforms?
Enforcement of GDPR and similar privacy laws has levied USD 5.0 billion in fines since 2024, making auditable lineage and consent management mandatory features.
Page last updated on:


