
Market Overview
| Study Period | 2021 - 2031 |
|---|---|
| Forecast Data Period | 2026 - 2031 |
| Base Year Market Size (2025) | 9.67 gigawatt |
| Market Volume (2026) | 10.96 gigawatt |
| Market Volume (2031) | 20.47 gigawatt |
| Growth Rate (2026 - 2031) | 13.32 % |
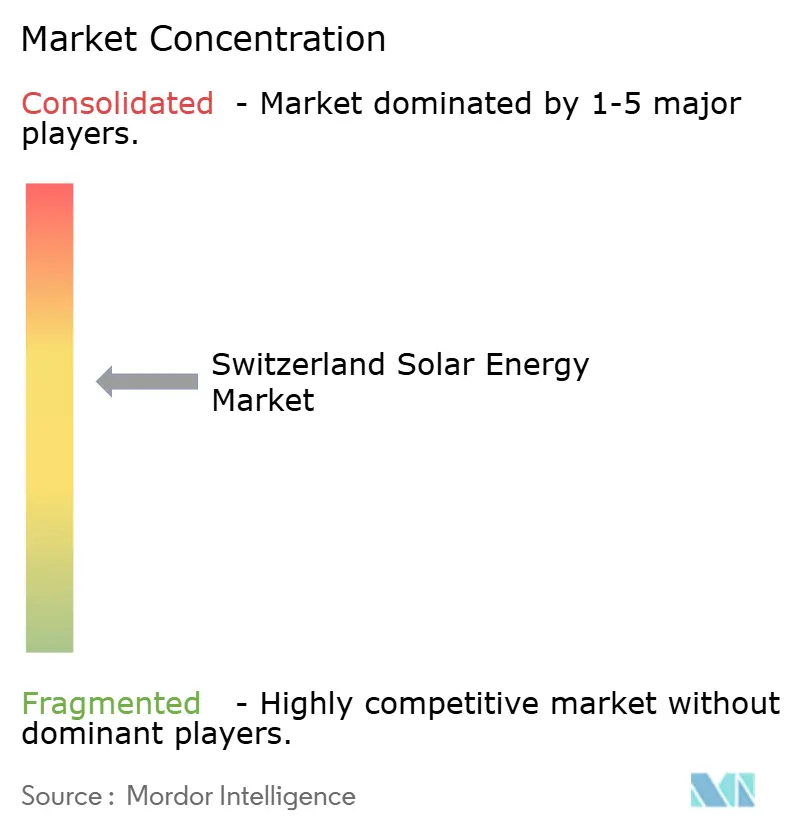
| Market Concentration | Medium |
Major Players *Disclaimer: Major Players sorted in no particular order Image © Mordor Intelligence. Reuse requires attribution under CC BY 4.0. | |
Switzerland Solar Energy Market Analysis by Mordor Intelligence
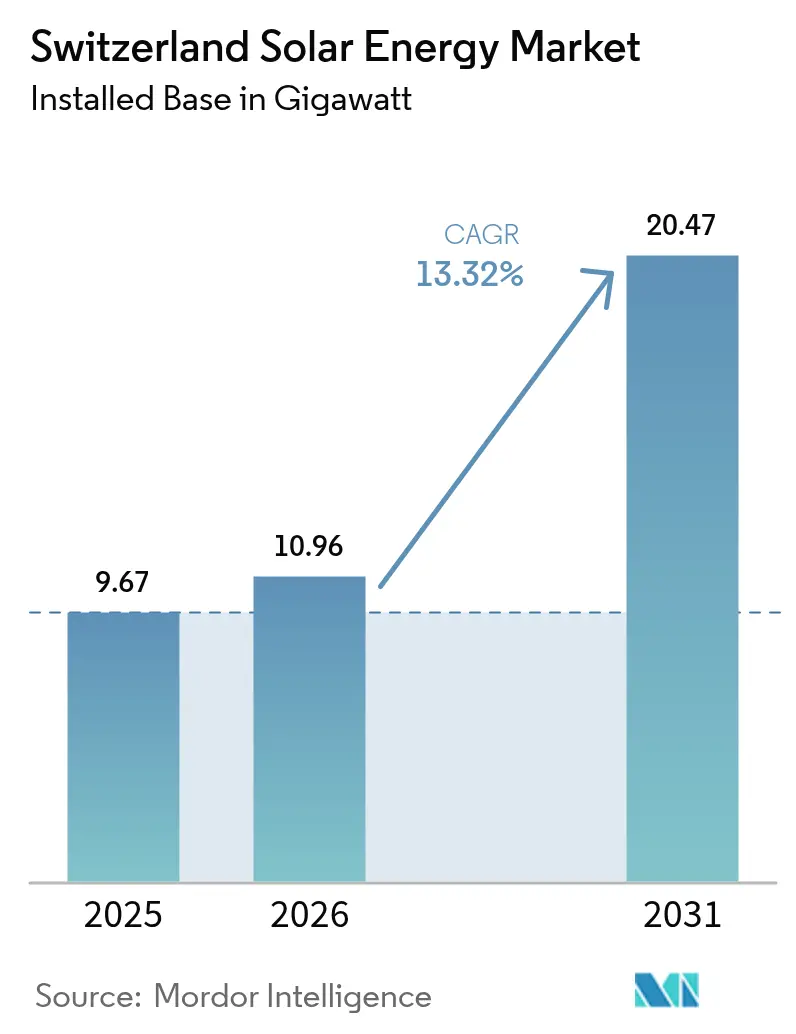
The Switzerland Solar Energy Market size is expected to grow from 9.67 gigawatt in 2025 to 10.96 gigawatt in 2026 and is forecast to reach 20.47 gigawatt by 2031 at 13.32% CAGR over 2026-2031.
The step-change in growth follows the June 2024 Electricity Act, which mandates the installation of solar panels on buildings larger than 300 m² and accelerates the on-grid segment, which already captures a 99.5% market share. Retail power tariffs rose 28% year-over-year in 2023, cutting rooftop payback periods below 10 years and triggering a surge in self-consumption systems. Meanwhile, a 45% collapse in module prices between 2023 and 2024 pulled average system CAPEX under CHF 850 per kWp (USD 970 per kWp).(1)Swiss Federal Electricity Commission, “Electricity Price Report 2024,” elcom.admin.ch Alpine photovoltaic subsidies under the Solarexpress law deepen winter generation, allowing new high-altitude plants to supply as much as 47% of annual output during the import-heavy cold months. Utility-scale developers have responded with more than 100 MW of corporate power-purchase agreements signed in 2024, and vertically integrated utilities are redirecting CHF 1 billion into distributed assets that complement existing hydropower fleets.
Key Report Takeaways
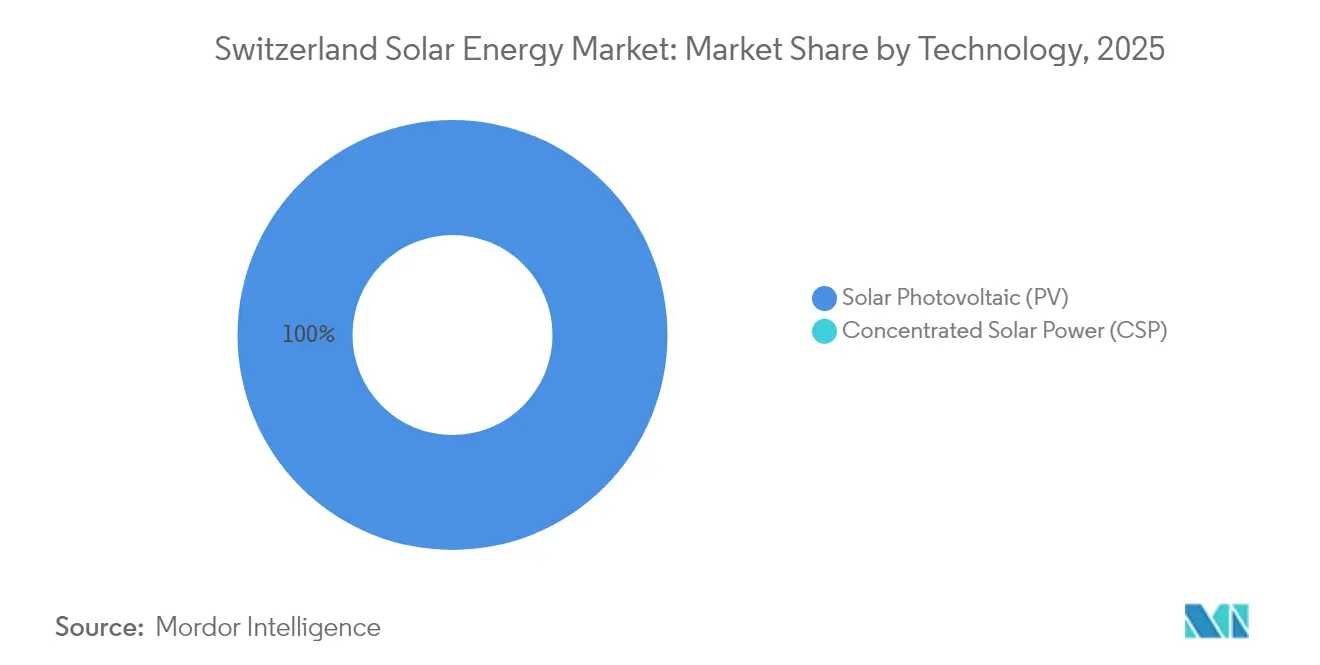
- By technology, solar photovoltaic commanded 100.00% of Switzerland's solar energy market share in 2025 and will keep a 13.32% CAGR through 2031.
- By grid type, on-grid systems accounted for 99.42% of the Swiss solar energy market size in 2025, while still expanding at a 13.38% CAGR to 2031.
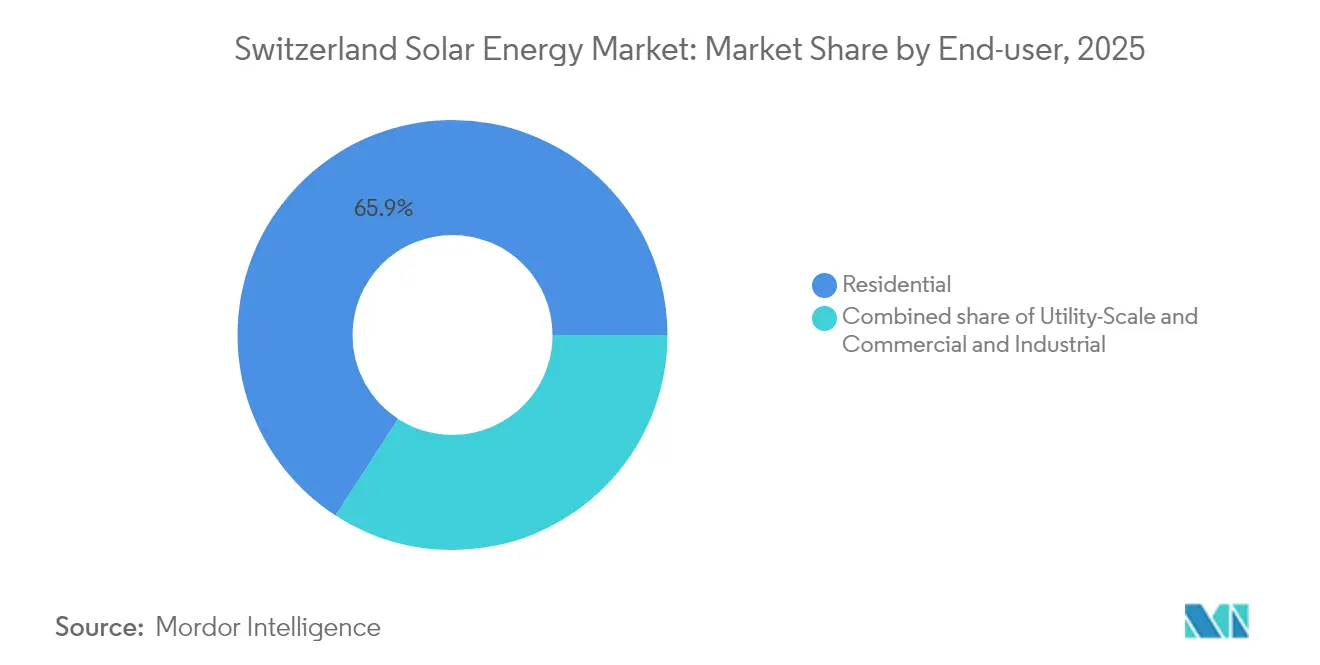
- By end-user, residential rooftops accounted for 65.85% of the Switzerland solar energy market share in 2025, whereas utility-scale plants posted the fastest 16.12% CAGR through 2031.
Note: Market size and forecast figures in this report are generated using Mordor Intelligence’s proprietary estimation framework, updated with the latest available data and insights as of 2026.
Switzerland Solar Energy Market Trends and Insights
Drivers Impact Analysis*
| Driver | (~) % Impact on CAGR Forecast | Geographic Relevance | Impact Timeline |
|---|---|---|---|
| Rooftop-PV self-consumption economics boosted by 28% YoY retail-power price rise | +2.80% | National, with early gains in Basel, Zurich, Geneva | Short term (≤ 2 years) |
| Alpine PV winter-solar subsidies under the 2022 Solarexpress law | +2.30% | Alpine and pre-alpine cantons (Graubünden, Valais, Uri) | Medium term (2-4 years) |
| Mandatory solar on new and renovated buildings in ≥20 cantons from 2025 | +3.10% | National, led by Basel-Stadt, Zurich, Bern | Medium term (2-4 years) |
| Surge in corporate PPAs (>100 MW signed 2024) unlocking utility-scale pipeline | +2.00% | National, concentrated in industrial cantons | Medium term (2-4 years) |
| Rapid module price collapse (-45% 2023-24) shrinking CAPEX below CHF 850/kWp | +2.50% | National | Short term (≤ 2 years) |
| Virtual energy communities (vZEV/LEG) opening >600 GWh prosumer demand | +1.50% | Urban cantons (Zurich, Basel, Geneva, Lausanne) | Long term (≥ 4 years) |
| Source: Mordor Intelligence | |||
Rooftop-PV Self-Consumption Economics Boosted by 28% YoY Retail-Power Price Rise
Household electricity tariffs exceeded CHF 0.30 per kWh in 2024, enabling rooftop systems to undercut grid prices by nearly 40% in Basel-Stadt and Zurich.(2)IWB Basel, “Tariff Overview 2024,” iwb.ch The favorable price gap drove a 603 MW jump in registered capacity during Q1 2024, an 81% year-on-year surge. The levelized cost of energy for typical 10 kWp arrays fell to CHF 0.06–0.08 per kWh, positioning solar as the most cost-effective residential supply option.(3)Meteotest AG, “PV LCOE Calculator 2024,” meteotest.ch Capital flows have shifted away from insulation upgrades toward distributed generation, pressuring municipal grids to modernize. Utilities that install smart meters and dynamic tariffs are poised to capture new balancing revenues as prosumers export surplus daytime energy output.
Alpine PV Winter-Solar Subsidies Under the 2022 Solarexpress Law
The Solarexpress framework directs capital expenditure (capex) relief to high-altitude projects that must deliver 10% of their planned capacity by the end of 2025, prioritizing winter generation when the country imports up to 4 GW. The 19.3 MW Sedrun Solar plant commenced construction in August 2024 and is expected to supply 29 GWh annually, with 47% of its output occurring during winter. Axpo’s 8 MW NalpSolar array secured a 20-year offtake contract from Swiss Federal Railways, underscoring deep corporate appetite for seasonal energy hedges.(4)Axpo Group, “Corporate PPA Tracker 2024,” axpo.com Nonetheless, permitting still averages 28 months, adding CHF 50–100 per MWh to project costs and delaying more than 300 MW of connections in 2024. Developers now bundle biodiversity offsets and local equity stakes to expedite the consent process.
Mandatory Solar on New and Renovated Buildings in ≥20 Cantons from 2025
Cantonal regulations, aligned with the June 2024 Electricity Act, embed rooftop PV into the building permit workflow, essentially making solar a default compliance route. Basel-Stadt forecasts 50 MW of additional capacity each year through streamlined approvals that cut paperwork lead times by 50%. Zurich and Bern impose similar rules linking occupancy certificates to panel installation, thereby limiting commercial-roof market sizes to 100–500 kWp per site. With margins 15–20% above residential levels, installers are diverting crews toward mid-scale projects, even as a 15% labor gap pushes household lead times to nine months. Training pipelines remain tight, suggesting wage escalation will persist into 2026.
Surge in Corporate PPAs (Greater than 100 MW Signed 2024) Unlocking Utility-Scale Pipeline
International manufacturers and data-center operators inked more than 100 MW of solar PPAs in 2024 to meet the Science-Based Targets initiative thresholds and buffer against volatile spot prices. Axpo partnered with Helion Energy to aggregate 40 GWh of rooftop capacity into a multi-buyer contract structure that bypasses traditional utility intermediaries. Swiss Federal Railways sourced winter-peaking supply via a 20-year deal for the NalpSolar project, aligning transport electrification with seasonal demand. These structures de-risk revenue and unlock cheaper debt finance, although concentration on a handful of corporate buyers increases counterparty risk, should macro conditions soften.
Restraints Impact Analysis*
| Restraint | (~) % Impact on CAGR Forecast | Geographic Relevance | Impact Timeline |
|---|---|---|---|
| Grid-congestion hotspots delaying >300 MW connections in 2024 | -1.80% | Eastern Switzerland (St. Gallen, Thurgau), alpine valleys | Short term (≤ 2 years) |
| Lengthy alpine-PV environmental permits (median 28 months) | -1.20% | Alpine and pre-alpine cantons (Graubünden, Valais, Uri) | Medium term (2-4 years) |
| Rooftop-installer labor shortage (-15% technician gap 2025) | -0.80% | National, acute in German-speaking cantons (Zurich, Bern, Aargau) | Short term (≤ 2 years) |
| Concentrated land-lease competition with agri-PV vs. rewilding projects | -0.60% | Pre-alpine zones (Fribourg, Lucerne, Bern), alpine transition areas | Medium term (2-4 years) |
| Source: Mordor Intelligence | |||
Grid-Congestion Hotspots Delaying >300 MW Connections in 2024
Distribution feeders in St. Gallen and Thurgau lack capacity for bidirectional flows, forcing developers to self-fund transformer replacements that add CHF 50,000–100,000 to each project. Municipal utilities with annual capital expenditures under CHF 10 million postpone upgrades, while the transmission operator Swissgrid focuses on long-distance lines. Alpine valleys face similar challenges when winter solar peaks coincide with hydropower discharges, causing 10–15% curtailment at some sites. The June 2024 Electricity Act aims to align interconnection rules; however, implementation varies across the 600 distribution companies. Developers are increasingly targeting cantons with proactive grid-investment roadmaps, thereby widening regional adoption gaps.
Lengthy Alpine-PV Environmental Permits (Median 28 Months)
Projects above 1,500 m altitude require overlapping federal and cantonal biodiversity reviews that extend approval well beyond the 12-month target. The Vorab solar project remains on hold, despite having obtained a building permit, as stakeholders negotiate rewilding offsets. Duplicate processes add six to 12 months, increasing financing costs and undermining the winter supply benefits that Alpine Solar provides. The 2024 Spatial Planning Act now classifies certain ridges as energy-priority zones; however, cantonal uptake is inconsistent, resulting in average lead times of nearly 28 months. Some developers respond by offering community profit shares, but those concessions raise delivered power costs and dilute the margin advantage over midland sites.
*Our forecasts treat driver/restraint impacts as directional, not additive. The impact forecasts reflect baseline growth, mix effects, and variable interactions.
Segment Analysis
By Technology: PV Dominates, CSP Absent
Switzerland's solar energy market size for photovoltaic systems reached a record 9.67 GW in 2025, equivalent to 100% of capacity, and is expected to grow at a 13.32% CAGR to 20.47 GW by 2031. Bifacial panels on snow-reflective terrain deliver annual specific yields of 1,434 kWh per kWp, as demonstrated at the 19.3 MW Sedrun Solar project, justifying a CHF 100 per kWp module premium. Concentrated Solar Power remains absent in Switzerland because the country lacks contiguous land parcels and high direct-normal irradiance. Building-integrated PV accounts for under 5% of annual installations, although local module fabricator 3S Swiss Solar Solutions can supply 200 MW of façade products per year that comply with heritage-building rules.
Component differentiation centers on more efficient N-type cells and hybrid inverters. TRITEC's 2024 deal with Sigenergy bundles storage and inverter functions into a single cabinet, shaving installation time and raising self-consumption ratios by up to 20%. Meyer Burger's attempt to anchor domestic module production stalled when the federal cabinet withdrew subsidy support, keeping the Switzerland solar energy market 90% reliant on Asian imports. Dependence on overseas supply lowers capex yet exposes developers to geopolitical risks; utilities hedge by pre-ordering six-month inventories.



By Grid Type: On-Grid Supremacy, Off-Grid Niche
On-grid installations accounted for 9.61 GW of the Swiss solar energy market size forecast for 2025 and are expected to maintain a 13.38% CAGR through 2031, driven by universal service, net metering, and corporate PPAs. Swissgrid is investing CHF 4 billion in transmission upgrades through 2030, installing voltage-regulation gear that supports bidirectional winter flows. Pending vZEV rules allow residents to form micro-markets that exchange power internally at discounted tariffs, thereby tightening the link between behind-the-meter assets and the public grid.
Off-grid systems remain a niche market, accounting for only 0.58%, confined to alpine huts, mountain rescue stations, and telecom repeaters where grid extensions exceed CHF 100,000 per kilometer. Battery costs above CHF 400 per kWh prevent mass migration to off-grid systems. Unless lithium-ion prices halve or regulators curb export credits, the off-grid share will stay minimal, although hybrid storage for backup inside grid-tied homes will grow as severe weather events become more common.
By End-User: Residential Leads, Utility-Scale Accelerates
Residential rooftops accounted for 65.85% of Switzerland's solar energy market share in 2025, driven by mandatory building codes across more than 20 cantons and electricity rates exceeding CHF 0.35 per kWh in some cities. Payback periods have been shortened to 8-10 years, even without subsidies, resulting in first-quarter 2024 residential registrations 81% higher than a year earlier. Labor shortages now push rooftop installation lead times past six months, constraining the segment's expansion pace through 2026.
Utility-scale plants are projected to grow at the fastest rate, with a 16.12% CAGR to 2031, driven by SolarExpress incentives and a growing corporate PPA pipeline exceeding 100 MW. The Swiss solar energy market size for Alpine PPAs is projected to reach 1.29 GW by 2031, as high winter output aligns with the country's import dependence. Specialized EPC contractors import crews from across Europe, insulating large projects from domestic labor gaps. Commercial and industrial rooftops, situated between residential and utility-scale, attract investors who bundle assets into virtual communities for a predictable yield.
Geography Analysis
Urban cantons Basel-Stadt, Zurich, and Geneva led cumulative capacity in 2024. Basel-Stadt alone targets 50 MW of additions each year through 2030, triple the per-capita national average. Zurich embedded 120 MW in 2024, building applications after tying occupancy certificates to solar compliance. Geneva’s 30% subsidy on systems below 30 kWp lifted growth to 25% annually through 2024, supported by municipal utility SIG’s capex exceeding CHF 100 million.
Alpine cantons Graubünden, Valais, and Uri emerged as utility-scale hubs under Solarexpress, with 75 MW of Alpine projects in construction between August 2024 and March 2025. Valais attracted CHF 200 million in 2024 investments but faced delays due to environmental reviews, which curtailed the actual connections to 15 MW. Uri fast-tracked 10 MW via energy-priority zones exempt from landscape assessments. These regions produce up to 50% of the annual output in winter, making them critical to national supply security, although they are smaller in absolute capacity than urban areas.
Eastern Switzerland trails because St. Gallen and Thurgau encounter grid-congestion hotspots that delayed more than 300 MW of requests in 2024. Municipal utilities with limited budgets postpone feeder upgrades, forcing developers to self-fund grid work. Hydropower dominance in Thurgau meets 60% of local demand, dulling political urgency for rooftop mandates. The forthcoming vZEV framework may improve economics through tariff discounts, even in lower-priced cantons; however, regional disparities will persist unless harmonized funding reaches smaller utilities.
Regulatory Landscape
Switzerland's solar regulatory environment is being reshaped by the implementation of the Federal Act on a Secure Electricity Supply with Renewable Energies, with ordinance-level changes effective from 1 January 2026. Revisions to the Energy Ordinance (EnV) and Energy Promotion Ordinance (EnF) introduced updated support mechanisms, including a Winter Electricity Bonus for large-scale PV systems (minimum 100 kW), replacing the previous High-Altitude Bonus and keeping winter production in focus.
From 2026, remuneration for renewable electricity feed-in is generally tied to the market price at the time of injection. The Federal Council also sets minimum remuneration levels for plants under 150 kW to safeguard amortization across the asset lifetime. At the same time, revised electricity-supply rules tighten grid-integration requirements, including intelligent metering obligations for relevant generation installations by 1 January 2028. Planning approval pathways for large solar and wind projects designated as being of national interest were also streamlined, which should reduce administrative complexity for utility-scale developments.
Competitive Landscape
Switzerland's solar energy industry exhibits moderate fragmentation. Vertically integrated utilities Axpo, BKW, and Alpiq control most alpine and utility-scale development pipelines, leveraging grid-operator links to secure permits and long-term PPAs. Axpo allocated CHF 1 billion through its subsidiary, CKW, to deploy 1.2 GW of distributed assets by 2030, realigning its portfolio toward rooftop aggregation. Alpiq sold a 5.5 MWp rooftop bundle for CHF 8 million in March 2024, recycling capital into higher-margin alpine projects. Pure-play installers Helion Energy and TRITEC capture the residential and commercial segments with asset-light models that operate at 20–25% lower overhead, although they face mounting wage inflation and supply chain volatility.
Technology differentiation is emerging as a competitive lever. TRITEC's partnership with Sigenergy integrates storage and hybrid inverters, enabling load shifting that cuts payback time by up to 20%. Helion collaborates with the University of Applied Sciences Northwestern Switzerland on AI optimization, adding service revenue post-installation. Meyer Burger's subsidy setback leaves the manufacturing gap unfilled, opening acquisition opportunities for utilities seeking vertical integration. The 2026 vZEV rollout is expected to accelerate consolidation as utilities buy installer platforms to secure prosumer relationships; IWB Basel's 2023 purchase of Kunz-Solartech foreshadows this shift. Market concentration remains moderate as no single firm controls more than 15% of installed capacity.
Switzerland Solar Energy Industry Leaders
Solaronix SA
Swiss Solar AG
Anerdgy AG
Apak Energy Sagl
ars solaris hächler
- *Disclaimer: Major Players sorted in no particular order

Market Opportunities and Future Outlook
Near-term opportunities center on converting ongoing installation growth into grid-compatible and more dispatchable solar output. Cumulative installed PV capacity stood at about 9.62 GW by end-2025, and Swissolar reported 1.526 GW of new installations in 2025 (down from 1.798 GW in 2024), signaling a shift from pure expansion toward connection readiness, operational optimization, and better integration. This supports added demand for storage attachment, intelligent energy management, and prosumer aggregation models that raise self-consumption and reduce reliance on feed-in value, particularly as the 2026 framework links remuneration more closely to market prices at the time of injection.
Policy changes also expand the addressable market beyond early-adopter rooftops. The Mantelerlass framework embeds a national solar obligation for new buildings with an imputable area above 300 square meters, creating a recurring pipeline in new-build and major-renovation segments and encouraging standardized, code-compliant rooftop and building-integrated solutions. On the system side, Swissgrid’s April 2026 white paper outlines the grid procedures, flexibility, and market design changes needed to integrate up to 40 GW of solar by 2050. That creates near-term implementation space for utilities, EPCs, and platform players to package PV with metering, flexibility controls, and grid-services-oriented operations.
Recent Industry Developments
- January 2026: Swiss Solar Group acquired Omniwatt, adding capabilities in large commercial and industrial solar, battery, and heat pump projects. The deal expanded the group’s execution capacity for C&I-scale work and supported cross-selling of electrification solutions alongside PV.
- October 2025: Axpo connected the first 10% of the planned 8 MW NalpSolar alpine plant in Tujetsch to the grid under the federal Solar Express program. Early grid connection showed progress toward winter-oriented alpine generation and provided a live reference for permitting, construction, and interconnection pathways for similar high-altitude projects.
- July 2024: Swiss Solar Group completed the acquisition of the Ticino-based PV installer IngEne, expanding its footprint into southern Switzerland. The transaction strengthened geographic coverage and consolidation among installers, improving the ability to serve multi-site customers across cantons.


Research Methodology Framework and Report Scope
Market Definition and Coverage
For this study, the Switzerland solar energy market is defined as solar power capacity deployed in the country, measured in gigawatts, across new additions and the installed base, and then trended through the forecast period.
Scope exclusions: The sizing does not count unrelated renewable generation or non-solar electrical equipment that does not directly enable solar power output.
Segmentation Overview
- By Technology
- Solar Photovoltaic (PV)
- Concentrated Solar Power (CSP)
- By Grid Type
- On-Grid
- Off-Grid
- By End-User
- Utility-Scale
- Commercial and Industrial (C&I)
- Residential
- By Component (Qualitative Analysis)
- Solar Modules/Panels
- Inverters (String, Central, Micro)
- Mounting and Tracking Systems
- Balance-of-System and Electricals
- Energy Storage and Hybrid Integration
Data Sources, Market Sizing, and Validation
Desk Research
Desk research was used to build a clean starting point for Switzerland solar deployments and the policy and grid context that shapes annual additions. We mainly rely on public sources such as the Swiss Federal Office of Energy (SFOE) statistics, Swissgrid publications, Eurostat energy balances, and IEA and IRENA renewable trackers, and then cross-check them with association releases and reputable press when timelines differ.
To make the inputs usable in a capacity model, we also reviewed company annual reports, investor presentations, and other public filings that help explain shifts in rooftop demand, utility-scale activity, and supply constraints. In a few places, paid subscriptions for company financials and intelligence, patent databases, and shipment-level import and export views were used to validate directional signals and fill gaps where public series were delayed. The desk sources listed here are illustrative rather than exhaustive, and additional references were used for data collection, validation, and clarification.
Primary Interviews and Surveys
We use expert interviews and surveys with Swiss installers, distributors, manufacturers, project developers, utilities, and service providers, covering CXOs, functional or unit leaders, and managers. Within Switzerland, these discussions test installation pace, project pipelines, pricing, storage attachment, and grid delays. We use the responses to validate secondary data, close gaps, and adjust the final analysis.
Distribution of primary research fieldwork respondents
| Company type | Respondent position |
|---|---|
| Top tier: 27% | CXOs: 18% |
| Mid tier: 48% | Functional/Unit leaders: 32% |
| Smaller Players: 25% | Managers: 50% |
Market-Sizing & Forecasting
The core model uses a top-down build where national installed PV capacity and annual additions are reconstructed year by year from official energy statistics, grid-connection signals, and policy-linked deployment targets, then extended into the forecast window. Results are then corroborated with selective bottom-up approximations, such as sampling typical system sizes by end user, applying realistic installer throughput, and checking implied equipment volumes against trade and distributor feedback.
Key inputs that move the curve include annual PV capacity additions (MW), the split between rooftop and utility-scale commissioning, on-grid connection timing, typical system size progression for residential and commercial rooftops, and constraints such as land availability and permitting lead times. When a data point is missing for a short period, the gap is handled using nearest-year trends and expert-agreed ranges, then the result is rechecked so it still fits known installation patterns.
For forecasting, scenario analysis is used with a central case tied to policy continuity and grid absorption, followed by upside and downside cases linked to incentive stability, interconnection lead times, and equipment pricing. Growth rates are not assumed upfront, instead they emerge after these drivers are applied and aligned with expert feedback.
Data Validation & Update Cycle
Outputs are triangulated against independent signals such as cumulative capacity reported by official sources, the implied pace of new connections, and whether year-on-year shifts appear realistic for installer capacity. If the variance is large, we revisit the input series, re-contact relevant experts, and adjust the assumption that is creating the break.
Before sign-off, the model is reviewed in steps, including unit checks, year sequencing checks, and a review of whether drivers move the market in the expected direction. Reports are refreshed annually, with interim updates when a material change in policy, pricing, or grid conditions alters the outlook. Right before delivery, an analyst runs a final review pass so clients receive the latest updated view.
Mordor Intelligence's Switzerland Solar Energy Market Estimate Compared With Other Published Estimates
Published market sizes for Switzerland solar energy often differ because the unit of measurement is not always the same, and the underlying build can track installed capacity, annual additions, or electricity generated. Differences also show up when base years and forecast windows do not align, or when one study includes minor technologies that are not deployed at scale.
In our checks, the largest gap drivers were scope alignment and the demand signal selected for the core model. Some estimates lean on aggressive policy-led expansion without validating grid-connection timing, while others convert the market into a generation view (TWh) that depends on yield assumptions, which can vary by location and seasonality in Switzerland.
Benchmark comparison
| Source | Market Size | Gaps in Research Methodology |
|---|---|---|
| Mordor Intelligence | USD 9.67 B (2025) | |
| Industry Publisher A | USD 5.20 B (2025) | The estimate is presented as a lower capacity figure for the same base year and can reflect narrower capture of the installed base or different treatment of small rooftop systems, which reduces the cumulative total. |
| Industry Publisher B | USD 2.13 B (2025) | This figure is based on electricity generation volume (TWh) rather than installed capacity, so it relies on capacity-factor and yield assumptions, and it will not align with a GW-based sizing without a consistent conversion method. |
The spread is mainly explained by mixing capacity and generation units, plus how fully the installed base is counted in the base year. When installed capacity is reconstructed using grid-connection timing and annual addition checks (rather than only policy targets), totals stay closer to observed deployment reality, which is how the model was validated in Mordor Intelligence.


Key Questions Answered in the Report
What capacity is forecast for Switzerland’s solar sector by 2031?
Installed capacity is projected to reach 20.47 GW by 2031, supported by a 13.32% CAGR.
How do alpine solar projects help Switzerland during winter?
High-altitude plants generate up to 50% of their annual output in winter, easing seasonal import reliance.
Why are rooftop payback periods shortening in Swiss cities?
Retail tariffs rose 28% in 2023, while module prices fell 45%, allowing rooftop systems to repay in under 10 years.
What is the role of virtual energy communities from 2026?
VZEV schemes will let neighbors trade power locally and enjoy a 30% grid-tariff discount, unlocking 600 GWh of demand.
Which segment grows fastest through 2031?
Utility-scale installations, buoyed by corporate PPAs and alpine subsidies, lead with a 16.12% CAGR.
How dependent is Switzerland on imported solar hardware?
Around 90% of modules are imported after the government declined manufacturing subsidies in 2024.
Page last updated on:





