
Data Center Transformation Market Size and Share
Market Overview
| Study Period | 2020 - 2031 |
|---|---|
| Market Size (2026) | USD 22.94 Billion |
| Market Size (2031) | USD 34.96 Billion |
| Growth Rate (2026 - 2031) | 8.78 % |
| Fastest Growing Market | North America |
| Largest Market | Asia Pacific |
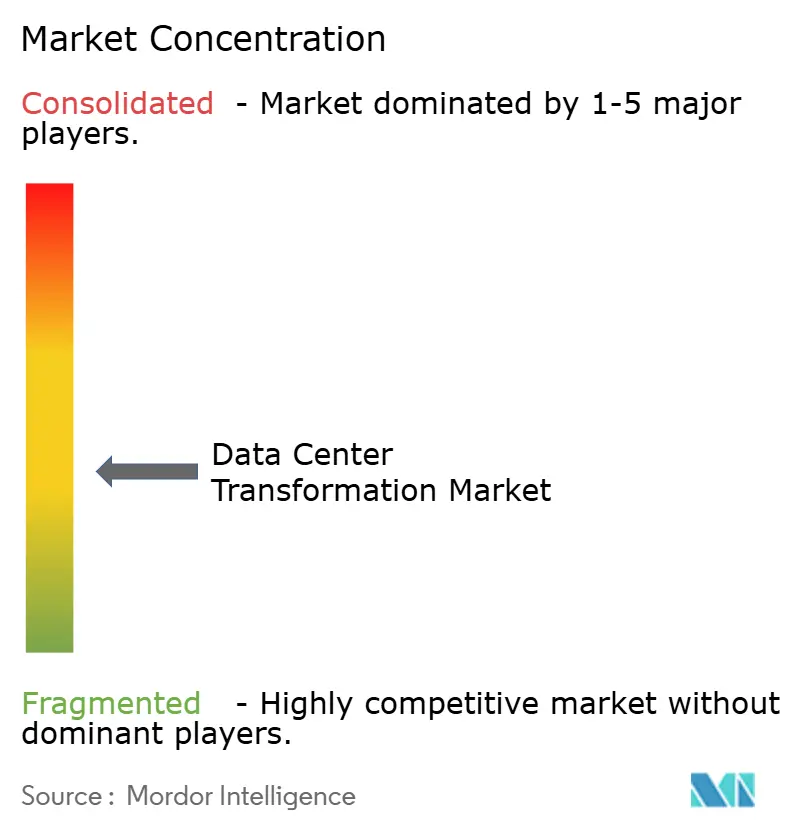
| Market Concentration | Medium |
Major Players *Disclaimer: Major Players sorted in no particular order Image © Mordor Intelligence. Reuse requires attribution under CC BY 4.0. | |
Data Center Transformation Market Analysis by Mordor Intelligence
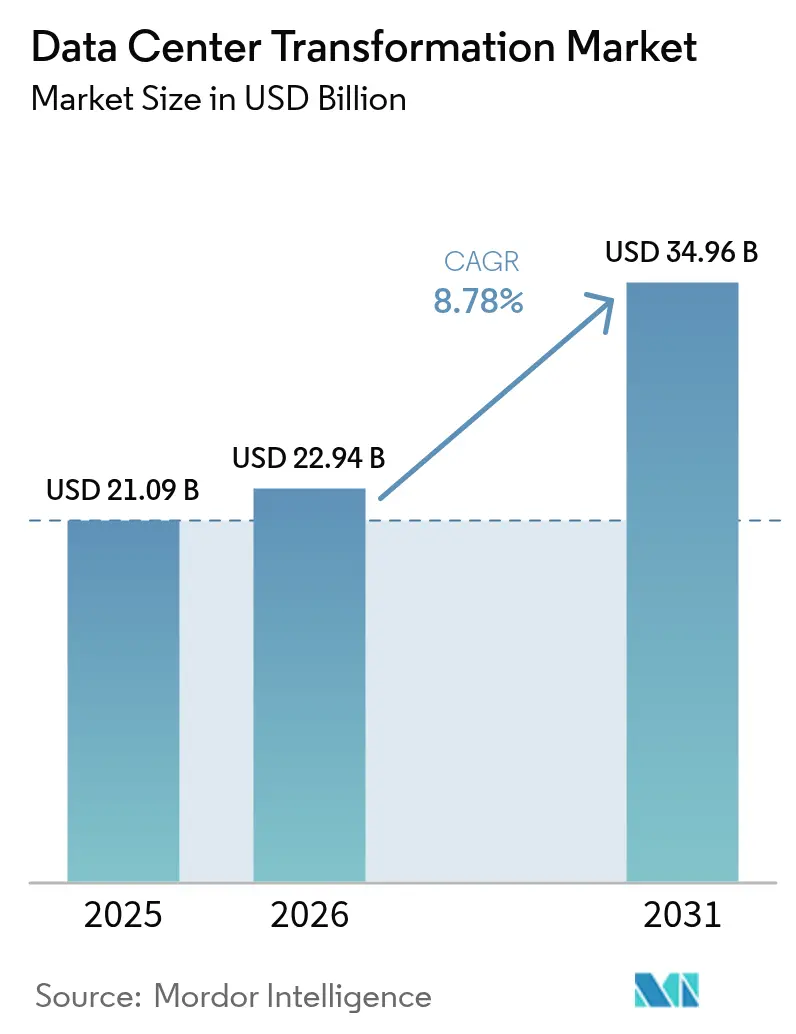
data center transformation market size in 2026 is estimated at USD 22.94 billion, growing from 2025 value of USD 21.09 billion with 2031 projections showing USD 34.96 billion, growing at 8.78% CAGR over 2026-2031. Intensifying artificial intelligence (AI) workloads, escalating rack power densities, and rising adoption of software-defined data centers are expanding demand for modernization services across consolidation, optimization, automation, and migration. Enterprises are shifting from conventional air cooling to liquid technologies as power densities for AI move from 5–10 kW per rack toward 40–140 kW. Cloud-native design principles are permeating colocation sites, while hyperscale operators accelerate edge nodes to support latency-sensitive applications. Capital inflows from institutional investors and sustainability-linked finance are compressing build times for Tier 3 and Tier 4 facilities. Asia-Pacific is racing ahead on capacity additions, yet North America retains early-mover advantages in AI infrastructure partnerships and renewable-energy sourcing.
Key Report Takeaways
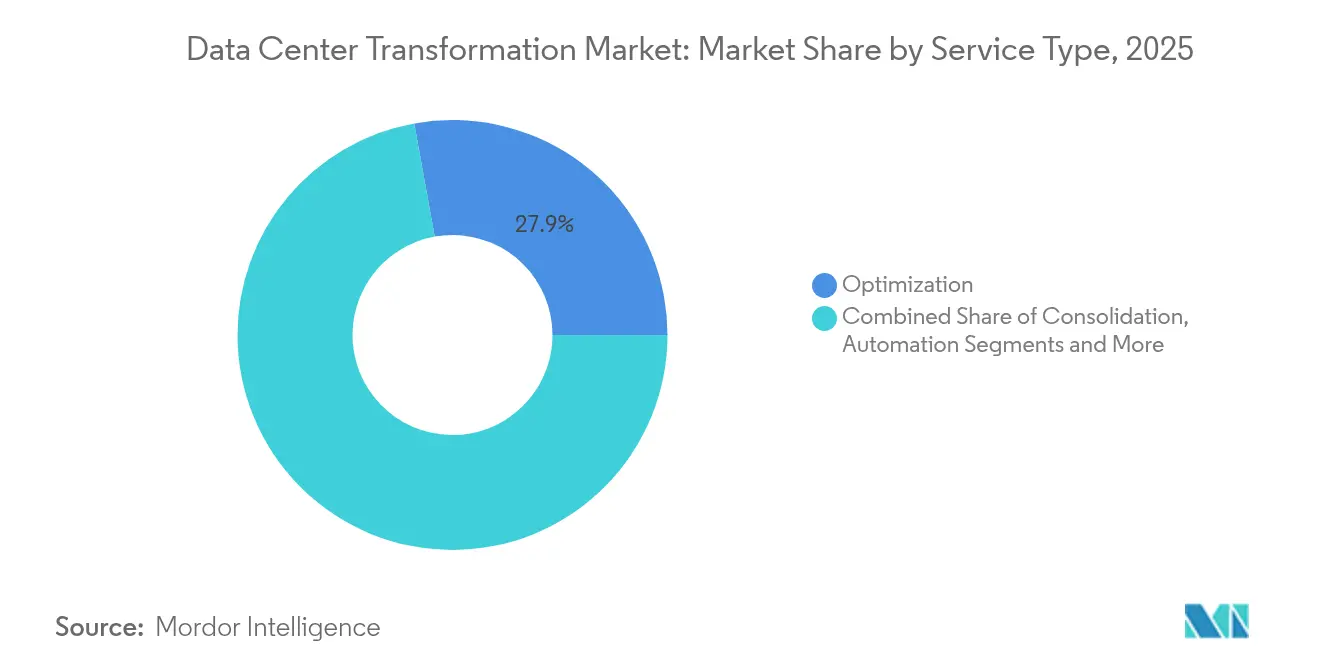
- By service type, optimization led with 27.85% revenue share in 2025, whereas automation is projected to expand at an 10.7% CAGR through 2031.
- By data center tier, Tier 3 accounted for 50.95% of the market in 2025; Tier 4 is forecast to grow the fastest at 11.6% CAGR to 2031.
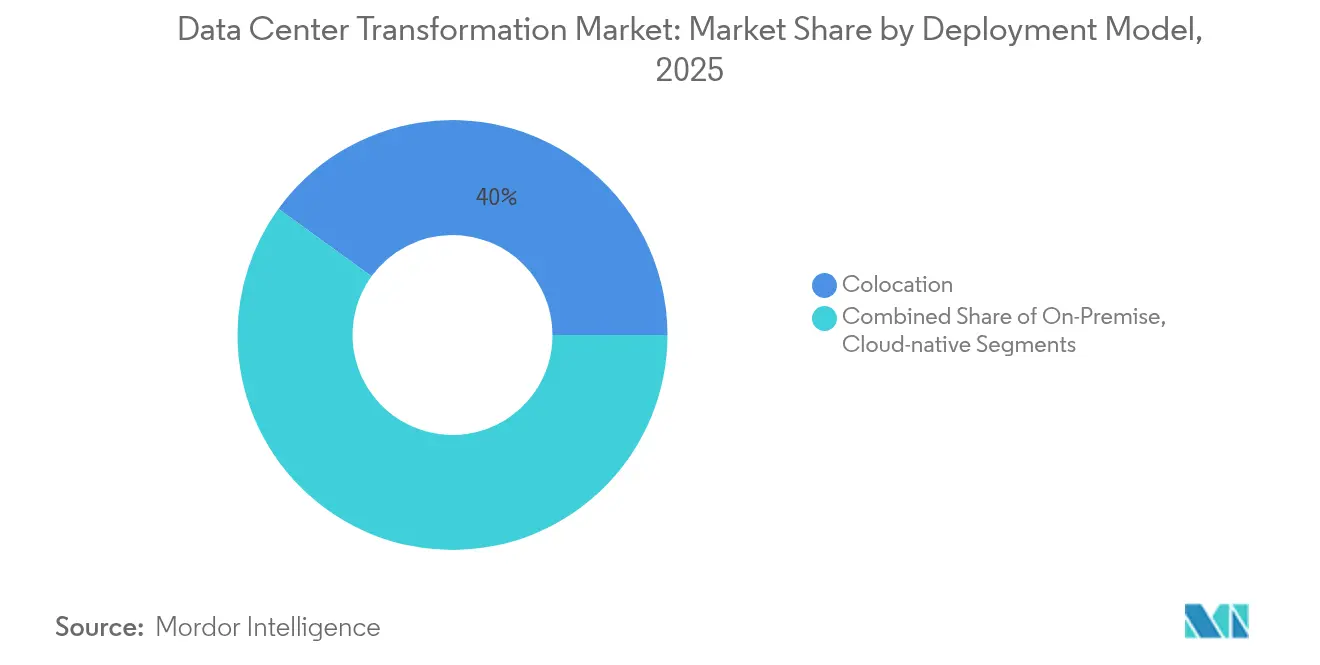
- By deployment model, colocation held 40.02% of the data center transformation market share in 2025, while cloud-native solutions are set to rise at a 12.4% CAGR.
- By end user, IT and Telecom commanded 34.25% share in 2025; Retail & E-commerce is on track for a 12.6% CAGR to 2031.
- By geography, North America retained leadership with 37.10% share in 2025; Asia-Pacific is forecast to post the fastest 11.9% CAGR through 2031.
Note: Market size and forecast figures in this report are generated using Mordor Intelligence’s proprietary estimation framework, updated with the latest available data and insights as of 2026.
Global Data Center Transformation Market Trends and Insights
Drivers Impact Analysis*
| Driver | (~) % Impact on CAGR Forecast | Geographic Relevance | Impact Timeline |
|---|---|---|---|
| Need to reduce costs and improve efficiency | +1.8% | Global | Short term (≤ 2 years) |
| Rapid adoption of cloud and hybrid-cloud architectures | +2.1% | North America and EU, APAC core | Medium term (2-4 years) |
| Surging e-commerce transaction volumes | +1.4% | Global with early gains in APAC and North America | Short term (≤ 2 years) |
| Edge computing proliferation | +1.6% | APAC core, spill-over to MEA | Medium term (2-4 years) |
| AI-driven infrastructure optimization | +1.9% | North America and EU | Medium term (2-4 years) |
| Quantum-ready data-center design demand | +0.7% | North America and EU | Long term (≥ 4 years) |
| Source: Mordor Intelligence | |||
Need to Reduce Costs and Improve Efficiency
Lowering total cost of ownership propels modernization projects that consolidate servers, virtualize storage, and fine-tune cooling systems. Capital Bank of Jordan cut data-migration time by 95% through IBM Cloud Pak for Data, freeing staff for higher-value tasks.[1]IBM, “Capital Bank of Jordan Accelerates Data Migration with IBM Cloud Pak,” ibm.com Salling Group captured USD 520,000 in yearly savings by consolidating infrastructure while still handling 9 million daily retail transactions, illustrating how operating efficiency can coexist with performance gains. Rising electricity prices and sustainability mandates intensify focus on energy efficiency because data centers consume 1–2% of global power demand. Operators now benchmark designs against power-usage-effectiveness (PUE) targets below 1.2, pushing adoption of advanced chillers and rear-door heat exchangers. Across regions, finance teams increasingly link project approval to verifiable reductions in megawatt hours and labor overhead.
Rapid Adoption of Cloud and Hybrid-Cloud Architectures
Organizations balance agility and governance by scattering workloads across public clouds, on-premises clusters, and colocation suites. Bank of Ayudhya migrated core systems onto a hybrid Amazon Web Services stack, improving observability and security while automating deployment pipelines.[2] Kyndryl, “Bank of Ayudhya Cloud Migration Case Study,” kyndryl.com In the United Kingdom, the NHS decommissioned legacy halls after shifting records and analytics to cloud infrastructure, shrinking fixed costs and carbon footprint. The software-defined data center market is forecast to expand at 20.1% CAGR to 2032, underscoring how policy-based automation and micro-segmentation underpin hybrid strategies. As latency-critical AI inference demands rise, enterprises adopt cloud bursting to spin up GPU clusters while retaining sensitive databases in trusted facilities. Consequently, service providers emphasize direct-connect fabrics and inter-region low-latency links.
AI-Driven Infrastructure Optimization
Artificial intelligence transforms data center operations through predictive maintenance, automated resource allocation, and intelligent cooling management, delivering measurable operational improvements. AI optimization can improve server utilization by up to 30% and reduce downtime through predictive maintenance, with 40% of data center infrastructure expected to be AI-managed by 2024. Vertiv reported strong Q1 2025 results with USD 2.04 billion revenue, a 25% increase driven by AI infrastructure demand, highlighting the accelerated scaling of AI deployments across data centers.[3]Equinix, “Equinix Reports First-Quarter 2025 Results,” equinix.com Google's Willow quantum chip represents the convergence of AI and quantum computing in data centers, potentially revolutionizing computational capabilities and infrastructure requirements . ServerLift. The transformation extends to cooling systems, where AI-driven optimization enables data centers to achieve Power Usage Effectiveness (PUE) ratios as low as 1.02, significantly enhancing energy efficiency.
Edge Computing Proliferation
Edge computing deployment accelerates to support low-latency applications, with the global edge data center market projected to reach USD 317 billion by 2026, driven by IoT and generative AI requirements. Low latency needs drive 41% of edge deployments, while data security concerns account for 38.3% of implementations. Vapor IO and NVIDIA launched the first private 5G AI-RAN solution in Las Vegas, utilizing NVIDIA AI Aerial technology to optimize real-time performance across the city with plans to include thousands of cameras by 2025. Edge computing growth is particularly pronounced in Asia-Pacific and MENA regions, where telecommunications infrastructure modernization coincides with smart city initiatives. The technology enables real-time data processing for autonomous vehicles, augmented reality, and industrial IoT applications, necessitating distributed computing architectures that complement traditional centralized data centers.
Restraints Impact Analysis*
| Restraint | (~) % Impact on CAGR Forecast | Geographic Relevance | Impact Timeline |
|---|---|---|---|
| High CAPEX and ROI uncertainty | -1.2% | Global | Short term (≤ 2 years) |
| Security and regulatory compliance complexity | -0.9% | Global with heightened impact in EU | Medium term (2-4 years) |
| Shortage of SDDC automation skills | -0.8% | Global | Medium term (2-4 years) |
| Legacy vendor lock-in and migration risk | -1.0% | Global | Short term (≤ 2 years) |
| Source: Mordor Intelligence | |||
High CAPEX and ROI Uncertainty
Building AI-ready halls with liquid cooling, 100 MW substations, and redundant fiber routes can exceed USD 15,000 per terabyte of data migrated, doubling storage acquisition costs once labor and downtime are included. Lead times for switchgear and generators now stretch to 6–12 months, forcing buyers to lock in designs long before demand crystallizes. Chip shortages and intense competition for GPUs raise pricing risk, complicating business-case projections. Financing structures increasingly feature sustainability-linked loans requiring greenhouse-gas targets, adding compliance costs. Amid rising interest rates, smaller operators struggle to fund brownfield retrofits, slowing capacity additions outside Tier 1 metros.
Security and Regulatory Compliance Complexity
Jurisdictions tighten rules on cyber resilience, data sovereignty, and energy reporting. The EU Energy Efficiency Directive obliges facilities above 100 kW IT load to disclose annual energy use, storage capacity, and carbon metrics. Financial institutions operating in the bloc must align with the Digital Operational Resilience Act, amplifying audit workloads. Globally, data-localization mandates in China and India steer new builds toward in-country availability zones. Operators juggle multiple frameworks, often mapping controls from ISO 27001, SOC 2, and PCI-DSS into country-specific overlays. Compliance specialists are scarce, so providers bundle advisory services within transformation projects, inflating service bills and elongating delivery schedules.
*Our forecasts treat driver/restraint impacts as directional, not additive. The impact forecasts reflect baseline growth, mix effects, and variable interactions.
Segment Analysis
By Service Type: Automation Drives Next-Generation Efficiency
Optimization held 27.85% of the data center transformation market in 2025 as enterprises wrung extra capacity from existing assets through workload placement, right-sizing, and airflow analytics. Automation is projected to register the fastest 10.7% CAGR, propelled by AI-driven orchestration engines that calibrate power caps, initiate live migration, and trigger predictive maintenance. Consolidation projects remain relevant for carve-outs and merger integrations seeking to shrink rack footprints. Infrastructure-management contracts grow as operators outsource monitoring to managed-service experts, especially where 24×7 support is mandatory under service level agreements.
Demand for migration and upgradation strengthens when firms pivot from monolithic systems to container clusters running on GPU-dense nodes. The data center transformation market size for automation-centric engagements is forecast to reach USD 15.47 billion by 2031 compared with USD 9.3 billion in 2026. Labor constraints intensify adoption because 58% of operators report hiring challenges, leading them to deploy run-book automation that ramps capacity without linear head-count growth. Vendors embed digital-twins into service portfolios so customers can model thermal zones before re-racking equipment, trimming schedule overruns.



By Data Center Tier: Tier 4 Leads Premium Infrastructure Demand
Tier 3 facilities delivered 99.982% uptime and captured 50.95% of the data center transformation market share in 2025, serving enterprise workloads that tolerate short maintenance windows. Tier 4 halls, however, are growing at 11.6% CAGR as AI model training, high-frequency trading, and mission-critical health platforms treat unplanned outages as unacceptable. Operators justify premium costs through differentiated service-level agreements, fault-tolerant architecture, and secure campus designs.
Tier 1 and Tier 2 sites remain niche for development labs and archival storage where budget limitations override availability targets. The data center transformation market size for Tier 4 retrofits is projected to expand from USD 5.8 billion in 2026 to USD 10.05 billion by 2031. Hyperscalers such as Equinix and Digital Realty prolong the life of older campuses by adding N+2 power paths and liquid-cooling manifolds, effectively migrating them toward Tier 4 capabilities without full rebuilds. As regulators embed uptime thresholds into digital-banking guidelines, demand for premium designs will further escalate.
By End User: Retail Acceleration Outpaces Traditional Leaders
IT and Telecom retained 34.25% market share in 2025, anchored by 5 G rollouts, network-function virtualization, and content-delivery upgrades. Retail and E-commerce is tracking a 12.6% CAGR from 2026–2031, reflecting omnichannel order spikes and personalization engines that stress real-time data processing. For instance, Etsy shifted 5.5 petabytes to Google Cloud and doubled experimentation velocity, proving how rapid iteration drives competitive edge.
Banks transform core systems to meet instant-payments mandates and generative-AI advisory tools, while insurers adopt deep-learning fraud analytics requiring GPU clusters. Healthcare modernizes electronic records and imaging archives, with Mayo Clinic earmarking 2.4 million ft² of new digital facilities by 2030. Manufacturers embed industrial IoT sensors into production lines, streaming telemetric data into edge gateways that pre-process before backhaul. Aerospace and defense organizations lean on isolated, air-gapped modules for classified workloads, prompting specialized sovereign-cloud builds.
By Deployment Model: Cloud-Native Disrupts Traditional Paradigms
Colocation hosted 40.02% of workloads in 2025, favored for cost sharing, scalability, and compliance with audit requirements that still value physical asset control. Yet cloud-native architectures are forecast to log a 12.4% CAGR as microservices, containers, and event-driven computing dominate application roadmaps. Enterprises such as 1-800-FLOWERS.COM decomposed monoliths into nearly 200 microservices to shorten release cycles and personalize customer journeys.
On-premises clusters persist in sectors bound by data-sovereignty statutes or niche latency mandates. Hybrid blueprints weave together colocation cages, private clouds, and hyperscale instances via software-defined wide-area networks. The data center transformation market size tied to cloud-native deployments is expected to multiply from USD 7.08 billion in 2026 to USD 12.7 billion in 2031. Service providers court these opportunities with connectivity fabrics granting sub-2 millisecond round-trip to major public-cloud on-ramps, while colocation campuses integrate turnkey Kubernetes stacks as value-added services.
Geography Analysis
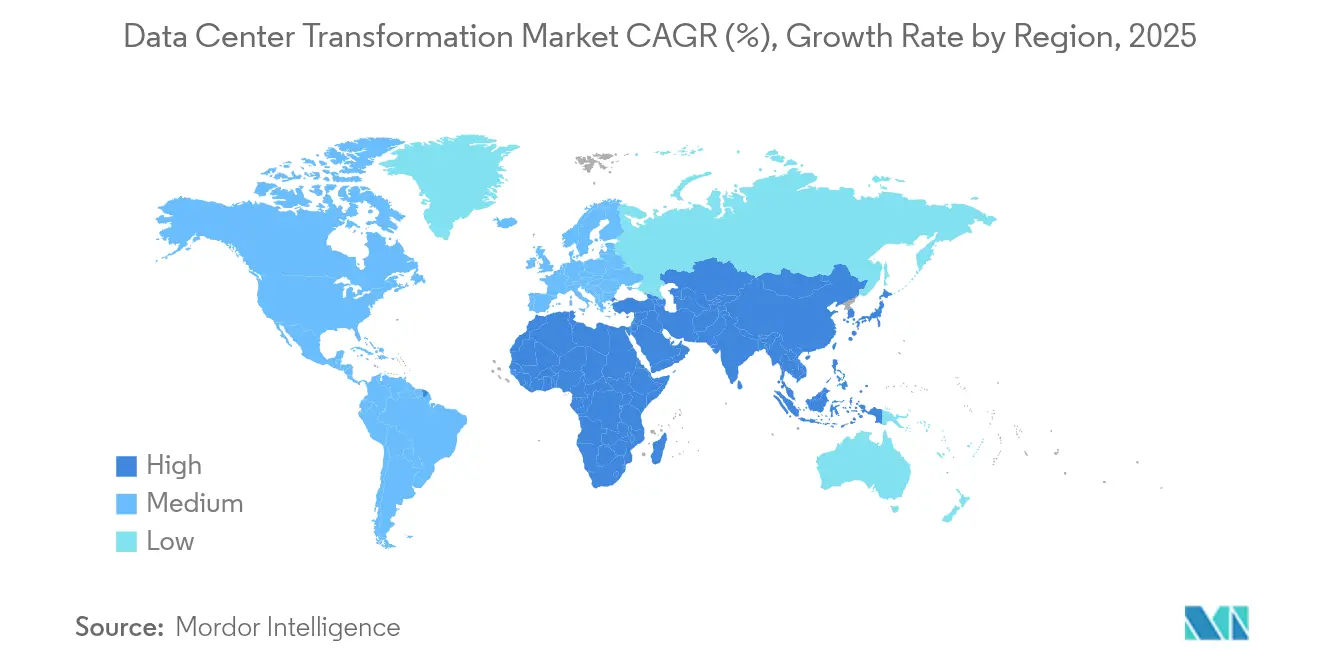
North America commanded 37.10% of the data center transformation market in 2025, underpinned by an entrenched hyperscale ecosystem, mature renewable-energy credits, and dense interconnect fabrics. Amazon’s USD 20 billion Pennsylvania program and Vantage Data Centers’ USD 9.2 billion equity injection signal continued build-out momentum. The region’s 9.15% projected CAGR to 2031 benefits from AI chip clusters linked to nuclear-powered campuses that mitigate grid constraints. State incentives across Virginia, Texas, and Ohio offer property-tax abatements tied to energy-efficiency benchmarks, extending the competitive advantage of incumbent operators.
Asia-Pacific is racing ahead with a 11.9% CAGR, buoyed by e-commerce expansion, smartphone penetration, and supportive policy frameworks. India plans to add 850 MW of capacity by 2026, fueled by an AWS commitment of USD 12.7 billion and NTT’s USD 1.5 billion expansion. Japan attracts sovereign-cloud investments exceeding USD 8 billion from Oracle as enterprises comply with data-localization rules and AI readiness targets. Malaysia’s Johor Bahru corridor is emerging as a regional hub with 1.6 GW installed, luring capital from Google, Nvidia, and Microsoft.
Europe emphasizes sustainability, mandating energy-consumption transparency and renewable sourcing under the Energy Efficiency Directive. Operators respond by integrating heat-re-use loops into district heating and procuring 24×7 carbon-free electricity contracts. Vantage Data Centers recently allocated EUR 1.4 billion for EMEA expansions focusing on low-carbon materials and modular batteries. The Middle East and Africa trail in absolute capacity but benefit from government-backed digital agendas; Saudi Arabia and the United Arab Emirates are fast-tracking greenfield zones aligned with smart-city blueprints.

Competitive Landscape
Competition centers on scale, energy strategy, and AI workload enablement. Equinix deepened its NVIDIA alliance and lifted Q1 2025 revenue to USD 2.225 billion through 56 concurrent build projects spanning 33 metros. Digital Realty posted 17× profit growth after booking record backlog and securing USD 7.2 billion in green bonds that fund renewable-powered campuses. Operators weaponize liquid-cooling expertise, edge node placement, and software-defined interconnects to secure long-term anchor tenants.
Private-equity inflows accelerate consolidation: Vantage attracted USD 9.2 billion from DigitalBridge and Silver Lake, while KKR led a USD 1.3 billion position in ST Telemedia to expand across Southeast Asia. Deal rationales include synergies in procurement, cross-selling managed services, and faster penetration of secondary cities that support AI inference zones. Smaller specialists differentiate through sovereign-cloud compliance, regional edge presence, or sector-specific certifications such as FedRAMP High.
Technology alliances shape go-to-market. Vapor IO pairs with NVIDIA to deliver AI-enhanced 5 G radio-access networks in Las Vegas, illustrating how edge nodes integrate connectivity and compute edgeir.com. Equinix invested USD 25 million in Oklo to explore micro-nuclear reactors that could slash carbon intensity for dense AI training clusters datacenterfrontier.com. Vendors also unveil turnkey quantum-ready modules anticipating qubit-centric workloads. Clients evaluate providers on transparent decarbonization roadmaps, physical supply-chain resilience, and open-standards interoperability.
Data Center Transformation Industry Leaders
IBM Corporation
Cisco Systems, Inc.
Microsoft Corporation
Schneider Electric SE
Dell Technologies
- *Disclaimer: Major Players sorted in no particular order

Market Opportunities and Future Outlook
AI-driven rack density (moving from 5-10 kW per rack toward 40-140 kW in AI deployments) is shifting transformation budgets toward power delivery, thermal design, and automation, opening whitespace for integrated retrofit-and-operations programs that combine liquid cooling, higher-voltage distribution, and software-defined control planes. Real-world hyperscale build activity supports this shift: in July 2026, Meta disclosed deeper investment in its Richland Parish, Louisiana data center campus, expanding to 5 GW of compute capacity, tied to infrastructure support arrangements with Entergy Louisiana. These moves reinforce demand for modernization services that can coordinate utility interconnects, substation upgrades, cooling transitions, and workload migration under tight schedule constraints.
Geographic diversification creates opportunities for providers that can standardize designs and deliver repeatable deployment playbooks across Tier 2 markets and new regional hubs where energy access and permitting shape site choice. In Europe, power-efficient AI campus builds underscore the same theme: Pure Data Centres Group launched the SJK01 project in Seinaejoki, Finland in July 2026, positioning a 550 MW AI data center campus with an initial Phase 1 investment over EUR 1.5 billion. Alongside ongoing compliance and reporting needs (for example, the EU Energy Efficiency Directive disclosure obligations for larger sites), this supports a broader market pull for transformation engagements that include energy and carbon reporting instrumentation, digital-twin-based capacity planning, and multi-site governance for hybrid and colocation operating models.
Recent Industry Developments
- July 2026: IBM announced new Power Systems and software updates, alongside compact IBM z17 and LinuxONE 5 configurations that fit standard 19-inch racks, with general availability referenced for August 2026. Rack-mountability and density-oriented packaging align with data center transformation programs focused on footprint reduction, modernization of legacy platforms, and tighter integration into standardized colocation and on-prem racks.
- June 2026: Cisco unveiled an agentic platform aimed at operating and defending critical IT infrastructure. The launch supports automation-led transformation initiatives by pushing more operational decisioning into software, which helps enterprises manage hybrid estates with fewer specialized staff and tighter security requirements.
- December 2024: Google, Intersect Power, and TPG Rise Climate earmarked USD 20 billion for data centers co-located with solar and wind farms to serve energy-intensive AI clusters. The commitment highlighted the rising importance of power sourcing and grid-adjacent development in transformation roadmaps, especially as operators pursue lower PUE designs and higher-density compute deployments.


Research Methodology Framework and Report Scope
Market Definition and Coverage
This market tracks the revenue earned from data center transformation work that upgrades existing facilities and operating models, so data centers can run with better agility, reliability, and efficiency. It includes transformation services tied to consolidation, optimization, automation, and infrastructure management delivered across major regions.
Scope exclusions: We exclude day to day colocation rent, pure cloud infrastructure consumption fees, and standard break-fix maintenance that does not change the data center architecture or operating model.
Segmentation Overview
- By Services
- Consolidation Services
- Optimization Services
- Automation Services
- Infrastructure Management
- By Level of Data Center
- Tier 1
- Tier 2
- Tier 3
- Tier 4
- By End User
- Data Center Providers
- Enterprises
- IT and Telecom
- BFSI
- Healthcare
- Retail
- Manufacturing
- Aerospace, Defense, and Intelligence
- Other End Users
- By Geography
- North America
- Europe
- Asia Pacific
- South America
- Middle East and Africa
Data Sources, Market Sizing, and Validation
Desk Research
Desk work started with public indicators that show how quickly data center footprints are expanding and how modernization priorities are shifting across regions. We leaned on sources such as U.S. Energy Information Administration electricity statistics, International Energy Agency energy data, International Telecommunication Union connectivity indicators, OECD digital economy datasets, and U.S. International Trade Commission trade statistics for relevant equipment categories.
We then added context from company annual reports, investor presentations, earnings call notes, reputable press coverage, and data center association publications to map typical project types and the direction of pricing. Where available, patent databases were used to see which transformation themes are gaining traction, such as automation and energy efficiency. We also used paid subscriptions for company financials and news to validate timelines, contract announcements, and strategy shifts. These sources are illustrative only, and many other public and paid references were also used for data collection and cross-checks.
Primary Interviews and Surveys
Primary discussions were held with service providers, infrastructure specialists, data center operators, and enterprise IT teams to confirm what is counted as transformation spending versus routine operations. Inputs were also tested across the main demand regions, so assumptions on tier mix, automation intensity, and project cadence could be adjusted before final totals were locked.
Distribution of primary research fieldwork respondents
| Company type | Respondent position | Region |
|---|---|---|
| Top tier: 31% | CXOs: 16% | APAC: 45% |
| Mid tier: 50% | Functional/Unit leaders: 36% | EMEA: 33% |
| Smaller Players: 19% | Managers: 48% | Americas: 22% |
Market-Sizing & Forecasting
Sizing was built using a top-down approach where the addressable pool was reconstructed from regional data center build and upgrade activity, and then filtered to the share that typically becomes transformation projects (for example, modernization programs tied to consolidation, automation, and infrastructure management). To keep the totals realistic, we also ran selective bottom-up checks using sampled project values, service pricing ranges, and supplier and channel feedback, and then adjusted the model when gaps showed up.
A few inputs that strongly influence outcomes were tracked carefully, including data center tier mix, pace of automation adoption, refresh cycles for servers and storage, power and cooling efficiency upgrades, and the shift toward hybrid and software-defined architectures. When some countries lacked consistent disclosure, nearby market proxies and operator commentary were used, and the assumption was re-tested with additional interviews.
For the forecast, scenario analysis was used so growth could reflect different paths for new workload demand, energy constraint severity, and modernization budgets. The final growth path was only accepted once it aligned with what practitioners described as feasible project delivery capacity and timing.
Data Validation & Update Cycle
Model outputs were checked against independent signals such as data center investment cycles, enterprise IT modernization budgets, and regional capacity expansion patterns, and then reviewed for unexpected jumps by year or region. When a variance could not be explained by a clear driver, the assumption was revisited and follow-up calls were triggered with relevant respondent groups.
Before sign-off, the work goes through multiple analyst reviews that focus on scope consistency, currency treatment, and sensitivity to key inputs. The report is refreshed annually, and material events are captured through interim updates, followed by a final pre-delivery review so clients receive the most current view possible.
Mordor Intelligence's Data Center Transformation Market Size Versus Other Published Estimates
It is normal to see different market values for data center transformation because publishers do not always count the same services, the same buyer groups, or the same timing for when revenue is recognized. Differences also show up when one study treats adjacent spend, like general data center services, as part of transformation, while another keeps the scope tighter.
The biggest gap drivers in this market usually come from what is included inside transformation services, how data center tiers and end users are mapped, and whether forecasts assume aggressive automation and modernization adoption. Currency conversion timing and refresh cadence also matter because project values can shift quickly when power and cooling constraints change. The spread in the table is mainly explained by a tighter service-only scope that separates routine operations from transformation programs, and by using a later base year that better reflects current AI driven upgrade activity. This is how the estimate is constructed by Mordor Intelligence.
Benchmark comparison
| Source | Market Size | Gaps in Research Methodology |
|---|---|---|
| Mordor Intelligence | USD 22.94 B (2026) | |
| Global Consultancy A | USD 13.82 B (2025) | Uses an earlier base year and a narrower revenue recognition approach that emphasizes transformation consulting and service delivery, which can undercount multi-year modernization programs that ramp later. |
| Industry Publisher B | USD 13.09 B (2025) | Includes factory-gate style valuation logic and broader regional country lists, and the service definition can blend related goods with services, which shifts totals depending on what is treated as transformation attached sales. |
Looking across the three figures, the main lesson is that scope and timing decisions move the number more than small modeling choices do. Our method stays traceable because it ties demand to upgrade cycles, tier patterns, and service intensity, and then pressure-tests the result with practical price and volume checks before finalizing totals.


Key Questions Answered in the Report
What is the current size of the data center transformation market?
The market is valued at USD 22.94 billion in 2026 and is projected to reach USD 34.96 billion by 2031, reflecting a 8.78% CAGR.
Which region is growing the fastest?
Asia-Pacific is expanding at a 11.9% CAGR, driven by large-scale investments in India, Japan, and Malaysia.
Which service segment shows the highest growth potential?
Automation services are forecast to grow at 10.7% CAGR as AI-driven orchestration and software-defined data centers gain traction.
Why are Tier 4 data centers gaining popularity?
Mission-critical AI and financial workloads require 99.995% uptime, pushing demand for Tier 4’s fault-tolerant architecture and premium reliability.
How are sustainability mandates influencing data center design?
Regulations such as the EU Energy Efficiency Directive push operators to adopt renewable power, liquid cooling, and heat-re-use systems to meet carbon targets.
Regulations such as the EU Energy Efficiency Directive push operators to adopt renewable power, liquid cooling, and heat-re-use systems to meet carbon targets.
Cloud-native architectures, encompassing containers and microservices, are projected to grow at 12.4% CAGR as enterprises embrace hybrid-multi-cloud strategies.
Page last updated on:
- Data Center Construction Market Construction worldwide, split by tier, facility size and facility type.
- Artificial Intelligence (AI) Data Center Market AI facilities worldwide, split by facility type, component and tier.
- Data Center Cooling Market Cooling worldwide, split by cooling technology, cooling component and facility type.
- Germany Artificial Intelligence (AI) Data Center Market Germany AI facilities, split by facility type, component and tier.
- Asia Pacific Data Center Water Consumption Market Water use in Asia-Pacific, split by source of water procurement, data-center type and data-center size.
- Nigeria Data Center Networking Market Nigeria networking, split by component, end-user and data-center type.
- Japan Data Center Water Consumption Market Japan water use, split by facility size and tier.
- Canada Data Center GPU Market Canada's GPUs, split by deployment type, gpu type and interconnect.
- United Arab Emirates Data Center Cooling Market The UAE cooling, split by facility type, tier and cooling technology.
- Norway Hyperscale Data Center Market Hyperscale sites demand across Norway, covering facility type, component and tier.
- United States Artificial Intelligence (AI) Data Center Market The US's AI facilities, split by facility type, component and tier.
- New Zealand Data Center Rack Market New Zealand's racks, split by rack size, rack height and rack type.





