Market Overview
| Study Period | 2020 - 2031 |
|---|---|
| Forecast Data Period | 2026 - 2031 |
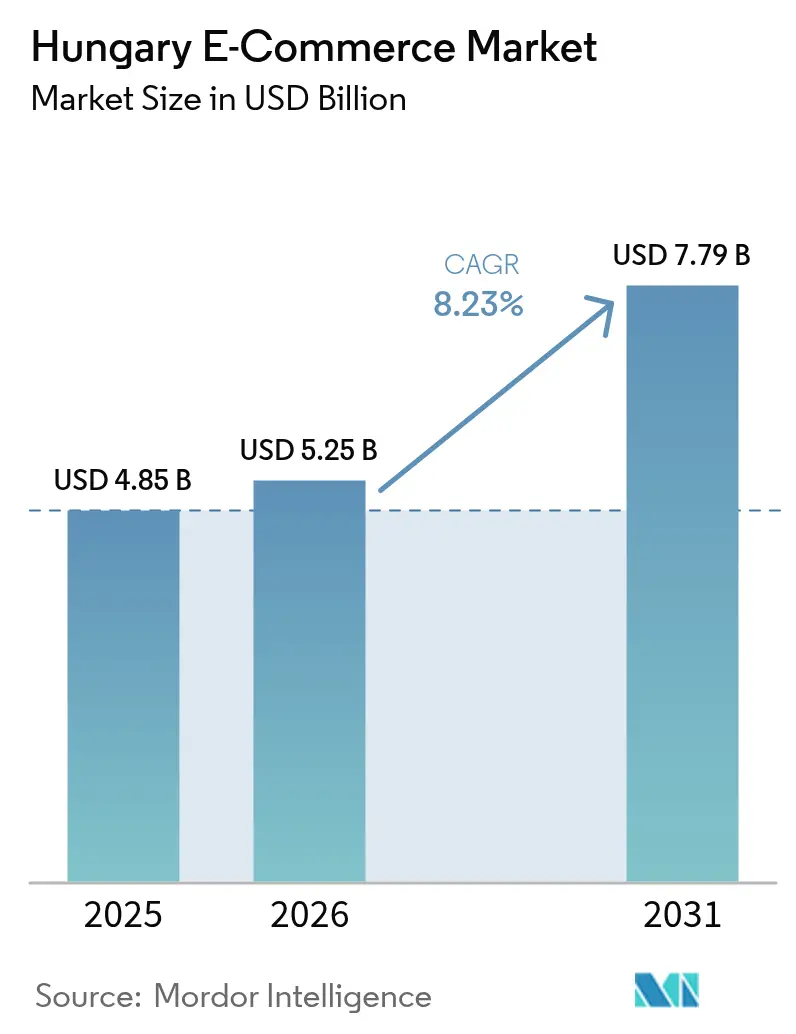
| Base Year Market Size (2025) | USD 4.85 Billion |
| Market Size (2026) | USD 5.25 Billion |
| Market Size (2031) | USD 7.79 Billion |
| Growth Rate (2026 - 2031) | 8.23% CAGR |
| Market Concentration | Medium |
Major Players *Disclaimer: Major Players sorted in no particular order Image © Mordor Intelligence. Reuse requires attribution under CC BY 4.0. | |
Hungary E-Commerce Market Analysis by Mordor Intelligence
The Hungary e-commerce market size was valued at USD 4.85 billion in 2025 and estimated to grow from USD 5.25 billion in 2026 to reach USD 7.79 billion by 2031, at a CAGR of 8.23% during the forecast period (2026-2031). Rapid mobile adoption, expanding last-mile capacity in secondary cities, and cross-border EU marketplace integration underpin this growth. Constitutional protection for cash payments enacted in April 2025 has not slowed digital transactions; instead, it reinforces consumer trust by ensuring payment-choice flexibility.[1]CMS Law Now, “Hungarian Parliament Adds Cash Payment Right to Constitution,” cms-lawnow.com Large platforms benefit from early compliance investments in the EU Digital Services Act (DSA), while smaller entrants struggle with the 0.35% supervisory levy.[2]DLA Piper, “Implementation of the Digital Services Act in Hungary,” dlapiper.com Demographic tailwinds are equally important: Gen-Z now accounts for over one-third of online buyers, and their mobile-first habits accelerate Buy-Now-Pay-Later (BNPL) uptake. Strategic infrastructure projects—such as Tesco’s 100,000 m² distribution hub—continue to improve delivery speed and reliability.
Key Report Takeaways
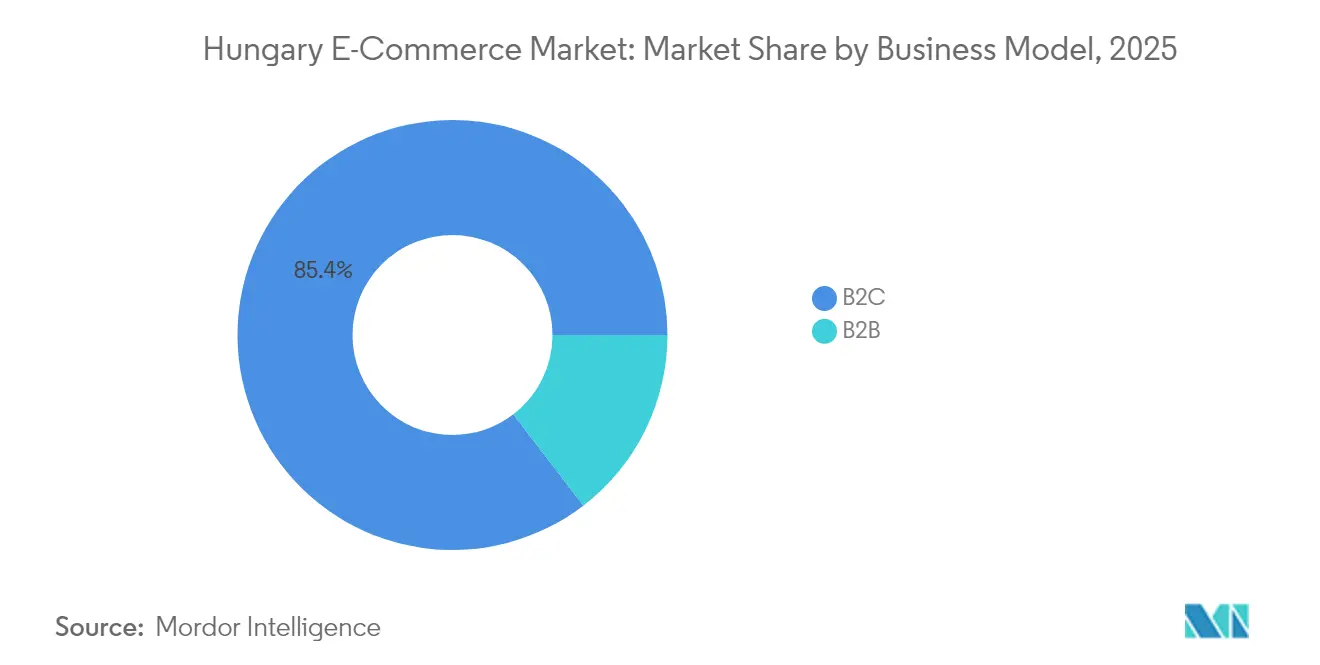
- By business model, the B2C segment held 85.41% of the Hungary e-commerce market share in 2025, while the B2B segment is projected to expand at an 11.07% CAGR through 2031.
- By device type, mobile commerce led with 60.25% transaction volume in 2025; it is advancing at a 10.18% CAGR over 2026-2031.
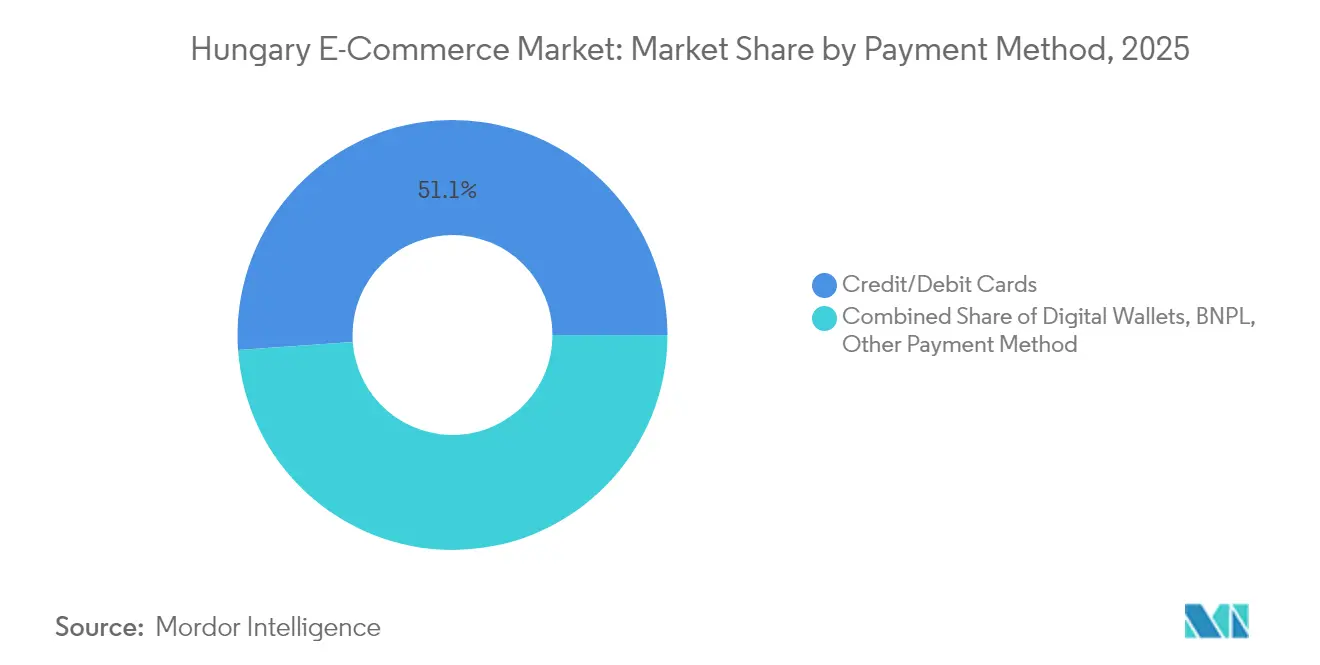
- By payment method, credit and debit cards captured 51.12% share of the Hungary e-commerce market size in 2025, whereas BNPL records the fastest 11.83% CAGR.
- By B2C product category, fashion and apparel commanded 28.73% revenue in 2025; the food and beverages segment is forecast to expand at a 12.03% CAGR through 2031.
Note: Market size and forecast figures in this report are generated using Mordor Intelligence’s proprietary estimation framework, updated with the latest available data and insights as of 2026.
Hungary E-Commerce Market Trends and Insights
Drivers Impact Analysis*
| Driver | (~) % Impact on CAGR Forecast | Geographic Relevance | Impact Timeline |
|---|---|---|---|
| Online Fashion Boom Driven by Fast-Fashion Retailers | +2.1% | National, concentrated in Budapest and major cities | Medium term (2-4 years) |
| Expansion of Same-Day Delivery Networks in Budapest & Tier-2 Cities | +1.8% | Central Hungary with spillover to secondary urban centers | Short term (≤ 2 years) |
| BNPL Adoption Surging Among Gen-Z Consumers | +1.4% | National, with higher penetration in urban areas | Medium term (2-4 years) |
| EU Digital Services Act Catalyzing Marketplace Compliance Investments | +0.9% | National, affecting all marketplace operators | Long term (≥ 4 years) |
| Cross-Border EU Marketplaces Lowering Barriers for Hungarian SMEs | +1.2% | National, with export focus to Western EU markets | Long term (≥ 4 years) |
| Source: Mordor Intelligence | |||
Online Fashion Boom Driven by Fast-Fashion Retailers
Fast-fashion brands are reshaping the Hungary e-commerce market through mixed physical-digital models. Primark’s May 2024 flagship at Arena Mall signaled renewed international confidence and lifted omnichannel traffic.[3]Arena Mall, “Primark Opens First Hungarian Store,” arenamall.hu With fashion accounting for 29.21% of 2024 online revenue, retailers exploit Hungary’s central EU location for rapid cross-border fulfillment. Mobile-based fashion purchases underpin the 60.82% mobile share, as smartphone-optimized catalogs amplify impulse buying. Retailers increasingly deploy geo-clustering algorithms that adjust assortments by city, climate, and demographic factors. Same-day delivery in Budapest strengthens competitive moats that traditional stores struggle to match, reinforcing fashion’s influence on overall GMV growth.
Expansion of Same-Day Delivery Networks in Budapest & Tier-2 Cities
Rising consumer expectations for immediate fulfillment make same-day delivery a strategic necessity. Tesco’s new 100,000 m² hub and Rossmann’s USD 55 million Üllő facility add high-capacity sortation nodes. These assets shrink urban delivery costs, historically 8-10% of order value, and create scale for expansion into Debrecen, Pécs, and Szeged. Micromobility trials in Miskolc cut delivery times 30% and reduce operating expenses through electric cargo bikes. As coverage widens, secondary cities unlock new demand, elevating overall order density and improving unit economics across the Hungary e-commerce market.
BNPL Adoption Surging Among Gen-Z Consumers
BNPL solutions expand purchasing power for financially cautious cohorts. With inflation easing to 3.7% in 2024, younger shoppers still favor installment flexibility, driving a 12.06% CAGR for BNPL transactions. MediaMarktSaturn’s financing tool for marketplace items illustrates merchant uptake. BNPL embeds seamlessly in mobile checkout, lowering cart abandonment and elevating average order value for electronics and home goods. Legal safeguards for cash transactions have indirectly boosted digital confidence by affirming consumer choice.
EU Digital Services Act Catalyzing Marketplace Compliance Investments
Hungary transposed the DSA via Act 104 of 2023, imposing a 0.35% revenue fee and penalties up to 6% of global turnover for non-compliance. eMAG and MediaMarktSaturn absorb these costs more easily than smaller rivals, turning regulatory adherence into a differentiator. Enhanced content-moderation and transparency tools foster user trust, which further entrenches the largest platforms. The framework also smooths SME market entry across borders by harmonizing rules, helping more than 36,000 Hungarian sellers tap Romanian and Bulgarian demand.
Restraints Impact Analysis*
| Restraint | (~) % Impact on CAGR Forecast | Geographic Relevance | Impact Timeline |
|---|---|---|---|
| High Last-Mile Logistics Cost Outside Central Hungary | -1.6% | Rural areas and smaller cities outside Budapest region | Long term (≥ 4 years) |
| Limited Warehouse Automation Among Domestic Retailers | -1.2% | National, particularly affecting smaller domestic players | Medium term (2-4 years) |
| Persistent Consumer Preference for Cash-On-Delivery | -0.8% | National, with higher impact in rural and older demographics | Long term (≥ 4 years) |
| Intensifying Competition from Chinese Ultra-Low-Cost Platforms | -1.1% | National, affecting all price-sensitive segments | Short term (≤ 2 years) |
| Source: Mordor Intelligence | |||
High Last-Mile Logistics Cost Outside Central Hungary
Delivery outside Budapest can exceed 15% of order value versus 8-10% in the capital, dampening rural adoption. With 70% of fulfillment capacity clustered in Central Hungary, order density in sparsely populated regions remains too low for route optimization. Retailers either accept longer lead times or raise shipping fees, both of which erode conversion rates. Academic studies link greater supplier distance to higher safety-stock requirements and unpredictable lead times. Click-and-collect mitigates some cost but sacrifices doorstep convenience, constraining the Hungary e-commerce market in low-density areas.
Limited Warehouse Automation Among Domestic Retailers
Only a minority of Hungarian merchants employ automated picking or AS/RS systems. International chains such as Dr. Max reported 55% year-over-year online sales growth after automating fulfillment, underscoring the performance gap. Manual processes raise error rates during peak seasons, elevate labor costs, and limit real-time inventory visibility. Capital constraints deter small players from investing, despite falling hardware costs and readily available leasing models. The resulting service-level disparity pushes shoppers toward larger, tech-enabled platforms.
*Our forecasts treat driver/restraint impacts as directional, not additive. The impact forecasts reflect baseline growth, mix effects, and variable interactions.
Segment Analysis
By Business Model: B2B Digitalization Accelerates
The B2B segment is poised for an 11.07% CAGR to 2031 as manufacturers integrate procurement portals and marketplace storefronts. Videoton EAS invested HUF 8.25 billion (USD 23 million) in new capacity in 2024 and embedded e-commerce modules to reach OEM clients directly. Large industrial buyers welcome transparent pricing and shorter supply chains, fostering repeat digital orders. Meanwhile, the B2C segment retains dominance, holding 85.41% of the Hungary e-commerce market share in 2025. Yet competitive intensity and rising compliance costs compress margins, prompting retailers to explore reseller programs and value-added services.
B2C growth remains healthy due to mobile commerce, same-day delivery, and BNPL adoption. Constitutional backing for cash reassures skeptical demographics, expanding the addressable audience without forcing payment method shifts. Loyalty apps and personalized recommendations deepen engagement, keeping customer-acquisition costs manageable even as advertising rates climb. Over 70% of Hungarian consumers now receive push notifications on flash deals, driving impulse purchases that underpin GMV expansion.


By Device Type: Mobile Commerce Dominance Intensifies
Mobile devices processed 60.25% of online transactions in 2025 and are tracking a 10.18% CAGR. The Hungary e-commerce market size for mobile orders is projected to account for more than USD 4.65 billion in 2031. Telecom upgrades to 5G and targeted rural coverage initiatives reduce latency and expand high-speed access. Retailers investing in lightweight Progressive Web Apps see conversion lifts above 4 percentage points versus desktop-optimized sites.
Desktop persists for complex B2B quotes and high-ticket consumer items requiring detailed spec comparisons. Smart TVs and voice assistants represent nascent channels; early pilots by eMAG enable voice-activated cart additions but generate low volumes today. Nonetheless, omnichannel analytics suggest cross-device journeys are lengthening: 38% of shoppers browse on mobile and complete checkout on desktop for durable goods, highlighting continued multidevice relevance.
By Payment Method: BNPL Disrupts Traditional Patterns
Credit and debit cards maintained a 51.12% share in 2025. However, BNPL volumes are on a 11.83% CAGR trajectory, set to double their share by 2031. Retailers report a 20% average order value uplift when BNPL is offered, and default rates remain within acceptable risk bands due to rigorous KYC protocols. Digital wallets grow steadily as NFC uptake rises in physical retail, familiarizing consumers with tokenized payments that translate seamlessly to online checkout.
Cash-on-delivery still exceeds 50% of first-time orders, especially among older and rural consumers. Merchants mitigate reconciliation delays by negotiating daily cash pick-ups with couriers and offering small discounts for pre-paid methods. Real-time account-to-account transfers via the domestic instant-payments rail remain niche but could gain traction once API standards mature.
By B2C Product Category: Food Delivery Transformation Leads Growth
Fashion’s 28.73% share underscores the category’s cultural significance and efficient supply chain routing through Central Europe. Yet food and beverages exhibit the fastest 12.03% CAGR, fueled by same-day grocery networks and warehouse automation. Rohlik Group delivers more than 1 million orders monthly and secured USD 170 million to broaden regional coverage. Cold-chain reliability and AI-driven order batching cut spoilage and pick-times, making online grocery a viable convenience play for urban professionals.
Electronics hold stable demand as replacement cycles shorten and manufacturers release energy-efficient models. BNPL availability lifts conversion for premium devices. Beauty & personal care leans on influencer content; over 60% of purchases follow social media exposure within 48 hours. Furniture faces bulky-item logistics hurdles, yet augmented reality previews increase customer confidence. Toys, DIY, and media remain seasonal but benefit from marketplace long-tail assortment.
Geography Analysis
Budapest and Central Hungary dominate the Hungary e-commerce market, accounting for well over half of all online orders in 2025 thanks to dense infrastructure and higher disposable incomes. IKEA’s EUR 50 million (USD 54 million) automated fulfillment store, opened in March 2025, amplifies same-day coverage and anchors the region as a logistics hub. Superior highway links and parcel locker density give Central Hungary a structural cost advantage that attracts additional private investment.
Secondary cities such as Debrecen, Szeged, and Pécs register double-digit online sales growth as couriers extend one-day delivery reach. Government designation of 18 new logistics parks provides tax incentives and brownfield redevelopment grants to stimulate geographic diversification. Improved broadband access through the Superfast Internet Program pushes fiber penetration above 95% of households, narrowing the digital divide.
Rural districts lag due to high last-mile costs and lower purchasing power. Retailers experiment with pick-up boxes at petrol stations and post offices to reduce failed-delivery rates. Cross-border flows add a unique dimension: merchants in Győr and Sopron fulfill Austrian orders within 24 hours, leveraging proximity and EU customs harmonization. Conversely, Czech and Slovak retailers view Hungary as the logical next stop for regional expansion, intensifying rivalry in price-sensitive categories.
Competitive Landscape
The Hungary e-commerce market exhibits moderate concentration. eMAG’s 2023 merger with Extreme Digital formed a multi-category leader targeting EUR 1 billion (USD 1.1 billion) in domestic sales. Scale enables preferential courier rates, exclusive brand partnerships, and robust DSA compliance budgets. Czech challenger Alza leverages cross-border fulfilment assets to win share in electronics, blending competitive pricing with local service centers.
Warehouse automation becomes a clear differentiator. MediaMarktSaturn doubled marketplace GMV in Q3 2024 and aims for EUR 750 million (USD 810 million) by 2026, backed by AI-driven product onboarding and sponsored ads. Domestic retailers lag on automation; however, Kende Retail Operation’s autonomous store pilot with Coca-Cola HBC shows local appetite for advanced retail tech.
Regulatory scrutiny of Temu and similar Chinese ultra-low-cost platforms in March 2024 highlights consumer-protection priorities. Established players emphasize data transparency and warranty compliance to differentiate on trust rather than price. Strategic alliances—such as MediaMarktSaturn’s partnership with Publicis for data-driven media planning—optimize acquisition spend and reinforce brand equity.
Hungary E-Commerce Industry Leaders
Alza.hu
Arukereso.hu
eMAG
Zooplus SE
Euronics Group
- *Disclaimer: Major Players sorted in no particular order

Recent Industry Developments
- March 2025: IKEA invested EUR 50 million (USD 54 million) to convert its Budapest store into an automated fulfillment hub, integrating showroom and warehousing to support almost 1 million annual orders. The move aligns inventory proximity with demand, easing same-day delivery and reinforcing IKEA’s regional distribution strategy.
- March 2025: Kende Retail Operation & Coca-Cola HBC opened Hungary’s first unmanned convenience outlet, investing HUF 250 million (USD 675,000). The project tests AI-based vision checkout and targets a 3× revenue lift from autonomous formats by 2026, positioning the partners at the forefront of frictionless retail.
- January 2025: Rohlik Group raised USD 170 million led by EBRD to scale Central-Eastern European grocery operations after reaching profitability in Hungary. Capital will reinforce cold-chain assets and algorithmic route planning, deepening competitive moats in online food retail.
- December 2024: Tesco inaugurated a 100,000 m² logistics center to streamline national distribution and reduce per-order handling costs, supporting grocery e-commerce expansion.


Research Methodology Framework and Report Scope
Market Definitions and Key Coverage
Our study defines the Hungary e-commerce market as every B2C, B2B, and C2C transaction in which goods or services are ordered and paid for through Internet-connected devices, then fulfilled to domestic addresses in physical or digital form. We capture sales arising from merchant websites, marketplace platforms, and mobile apps, and express all values in constant 2024 US dollars according to Mordor Intelligence exchange assumptions.
Scope exclusion: downloads of pure digital media, gambling, and utility bill payments are kept out of scope to avoid inflating retail-driven figures.
Segmentation Overview
- By Business Model
- B2C
- B2B
- By Device Type
- Smartphone / Mobile
- Desktop and Laptop
- Other Device Types
- By Payment Method
- Credit / Debit Cards
- Digital Wallets
- BNPL
- Other Payment Method
- By B2C Product Category
- Beauty and Personal Care
- Consumer Electronics
- Fashion and Apparel
- Food and Beverages
- Furniture and Home
- Toys, DIY and Media
- Other Product Categories
Detailed Research Methodology and Data Validation
Primary Research
We interviewed marketplace operators, third-party logistics managers, card-scheme representatives, and payment-gateway executives across Budapest, Győr, and Debrecen. These conversations clarified true cash-on-delivery ratios, smartphone conversion rates, and seasonal demand spikes, allowing us to challenge desk findings and refine category weights before final model lock-in.
Desk Research
Mordor analysts first compiled macro and retail indicators from tier-one public sources such as the Hungarian Central Statistical Office, Eurostat, Magyar Posta parcel statistics, the National Bank of Hungary, and the EU Digital Economy & Society Index, which together map household spending power, online shopper penetration, and parcel flow. Company filings, IPO prospectuses, and investor presentations added merchant-level average selling prices and category splits, while news feeds mined through Dow Jones Factiva and D&B Hoovers confirmed promotional cycles and cross-border traffic.
Further insight was gathered from trade bodies, most notably the Ecommerce Hungary Association and the Budapest Chamber of Commerce, along with customs dashboards that flag import shares of electronics, fashion, and beauty. The list above is illustrative; many additional open and paid references were consulted to cross-check signals and fill gaps.
Market-Sizing & Forecasting
A top-down demand pool was built from household consumption, internet penetration, and online shopper series, which are then multiplied by observed spend per buyer to yield 2024 value; selective bottom-up checks, merchant roll-ups and sampled ASP × volume, validated totals. Key variables tracked include parcel volume per capita, mobile checkout share, card-based payment mix, cross-border order ratio, and fashion category inflation, all of which exhibit statistically significant links to GMV. Multivariate regression with scenario overlays (baseline, cost of living shock, logistics squeeze) projects these drivers to 2030, while assumed take rates bridge gross merchandise value to revenue where necessary. Data voids in sampled ASPs were bridged using category median estimates drawn from supplier interviews.
Data Validation & Update Cycle
Outputs undergo variance tests against historical series and peer benchmarks, followed by senior analyst review; anomalies trigger re-contact of key sources. Reports are refreshed annually and updated mid-cycle if regulatory or macro events materially shift drivers; a final sense check is completed just before publication.
Why Mordor's Hungary E-Commerce Baseline Earns Trust
Published estimates for Hungary often diverge because firms scope only B2C retail, apply differing FX treatments, or freeze assumptions for several years.
Key Gap Drivers: some publishers omit B2B volumes, others translate Hungarian forint values at spot rather than annual averages, while a few extend aggressive mobile commerce growth beyond what parcel capacity data supports. Mordor's model covers the full transaction universe, applies IMF-aligned currency series, and refreshes every twelve months.
Benchmark comparison
| Market Size | Anonymized source | Primary gap driver |
|---|---|---|
| USD 4.85 Bn (2025) | Mordor Intelligence | - |
| USD 2.50 Bn (2023) | Global Consultancy A | Excludes B2B and C2C, limited category scope |
| USD 2.39 Bn (2024) | Data Aggregator B | Uses spot FX, omits cross-border sales |
| USD 4.73 Bn (2024) | Industry Database C | Lacks primary validation; relies on web traffic proxies |
In sum, by anchoring estimates to transparent variables, frequent updates, and dual-track validation, Mordor Intelligence delivers a balanced, repeatable baseline that decision makers can rely on with confidence.


Key Questions Answered in the Report
What is the current size of the Hungary e-commerce market?
The market stands at USD 5.25 billion in 2026 and is projected to grow to USD 7.79 billion by 2031.
Which segment is growing fastest in the Hungary e-commerce market?
B2B transactions exhibit the quickest pace, expanding at an 11.07% CAGR as manufacturers digitize procurement and cross-border sales.
How dominant is mobile commerce in Hungary?
Mobile devices accounted for 60.25% of online transactions in 2025 and are advancing at a 10.18% CAGR.
Why is BNPL adoption accelerating in Hungary?
Gen-Z preferences for flexible payments, coupled with lower inflation and seamless mobile integration, drive a 11.83% CAGR for BNPL.
Which product category leads revenue today, and which is expanding fastest?
Fashion and apparel lead with 28.73% of 2025 revenue, while the food and beverages category is the fastest-growing at a 12.03% CAGR.
How will the EU Digital Services Act influence competition?
The DSA favors larger platforms that can absorb compliance costs, raising entry barriers for smaller newcomers and shifting competition toward trust and transparency.
Page last updated on:


