
Market Overview
| Study Period | 2020 - 2031 |
|---|---|
| Market Size (2026) | USD 90.72 Billion |
| Market Size (2031) | USD 132.74 Billion |
| Growth Rate (2026 - 2031) | 7.91 % |
| Fastest Growing Market | Asia Pacific |
| Largest Market | North America |
| Market Concentration | Medium |
Major Players *Disclaimer: Major Players sorted in no particular order Image © Mordor Intelligence. Reuse requires attribution under CC BY 4.0. | |
Logistics Automation Market Analysis by Mordor Intelligence
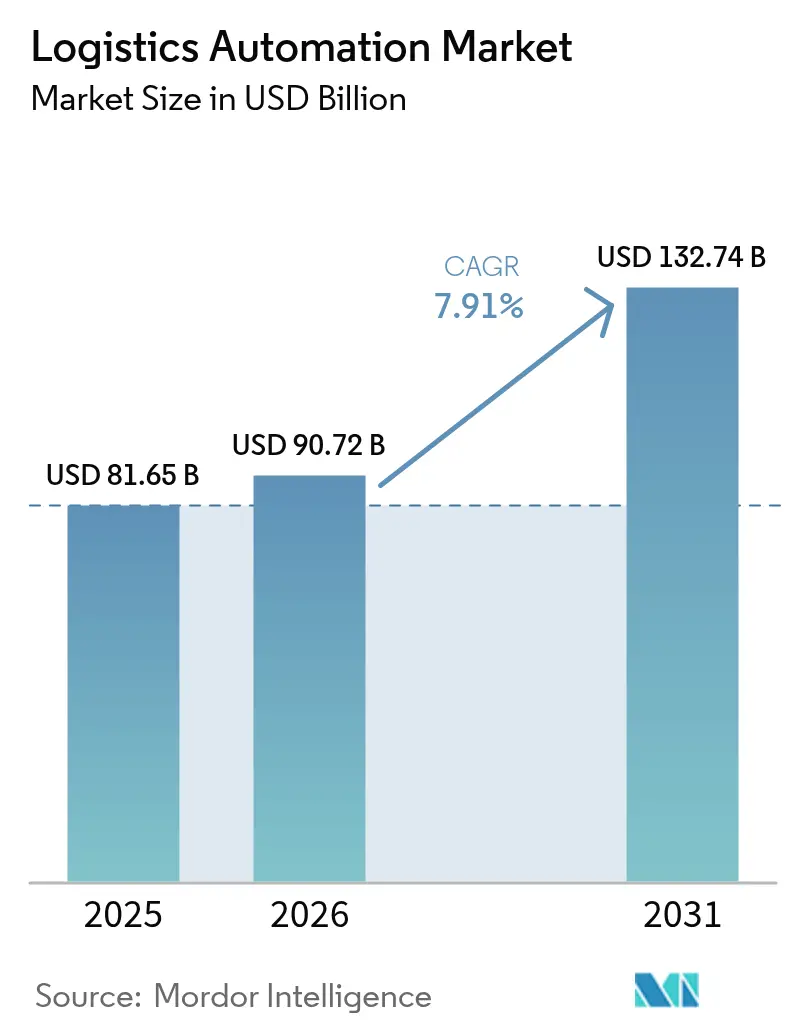
The Logistics automation market size is expected to increase from USD 81.65 billion in 2025 to USD 90.72 billion in 2026 and reach USD 132.74 billion by 2031, growing at a CAGR of 7.91% over 2026-2031. The expansion reflects structurally tighter labor markets, rising energy-efficiency mandates, and a broad shift from standalone hardware toward software-defined orchestration. Global parcel volumes hit 121 billion business-to-consumer shipments in 2025, stretching warehouse capacity even in mature logistics hubs and prompting aggressive adoption of goods-to-person robotics. Investment is also tilting toward edge connectivity, as private 5G makes it viable to coordinate hundreds of autonomous mobile robots under one low-latency fabric. On the demand side, grocery and quick-commerce operators are installing compact micro-fulfillment centers to cut last-mile distances, while large shippers are using transportation automation to shrink empty-mile ratios and reduce Scope 3 emissions. Competitive dynamics are therefore shifting, with pure-play robotics firms winning share by offering modular, rapidly deployable systems that satisfy near-term return-on-investment hurdles.
Key Report Takeaways
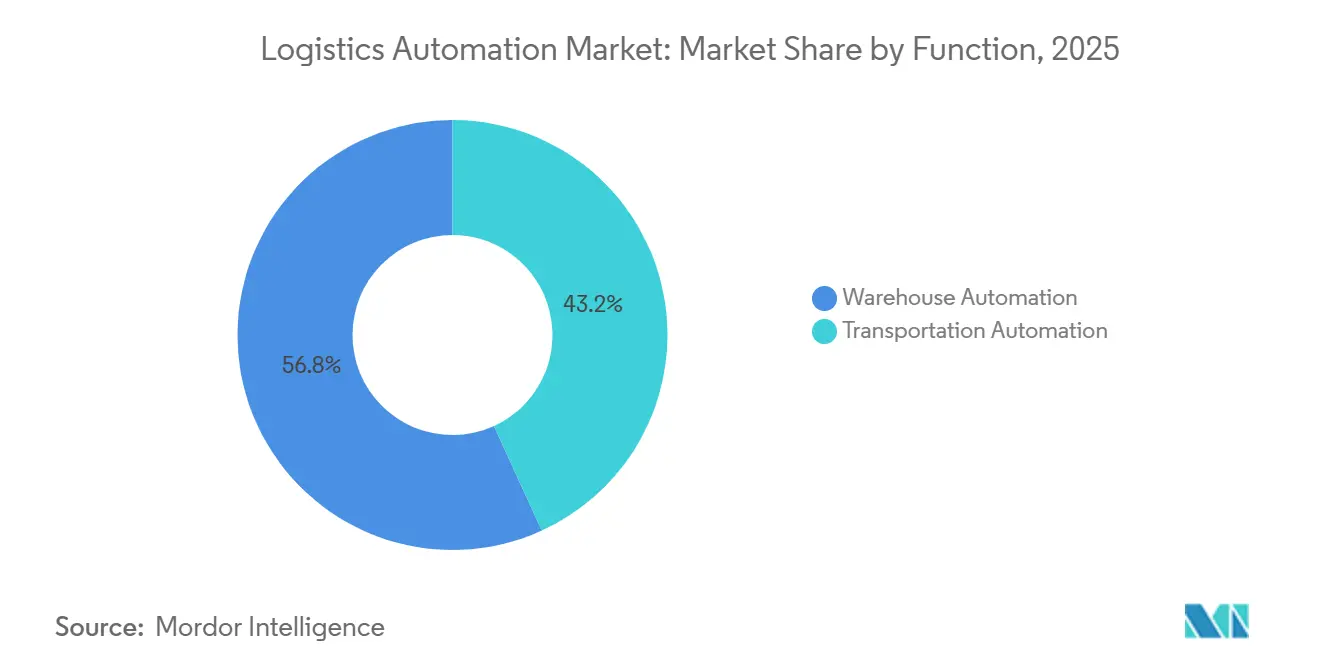
- By function, warehouse automation led with 56.82% revenue share in 2025, while transportation automation is projected to expand at a 7.96% CAGR through 2031.
- By automation level, semi-automated systems accounted for 61.48% share of the Logistics automation market size in 2025, whereas fully-automated systems record the fastest forecast growth at 7.99% to 2031.
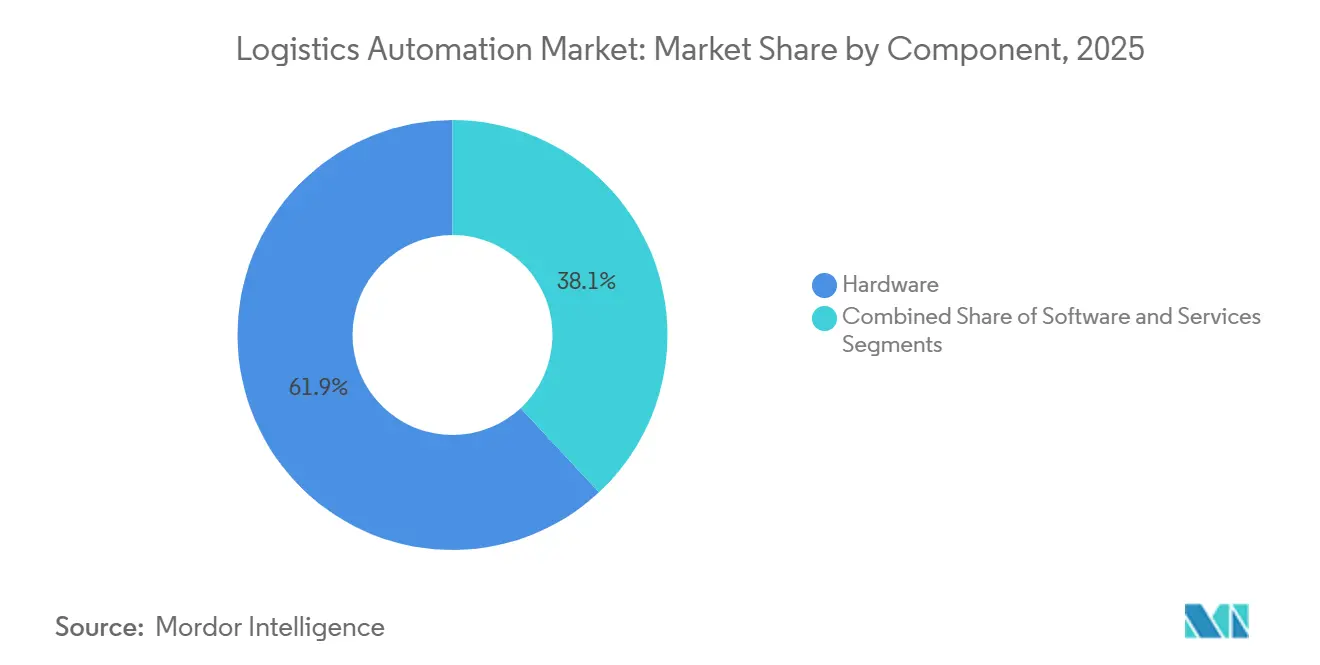
- By component, hardware commanded 61.93% of 2025 spending, but software is on track for an 8.03% CAGR across 2026-2031.
- By end-user industry, e-commerce and parcel operations held 38.73% of 2025 revenue; grocery retail is forecast to deliver an 8.05% CAGR to 2031.
- By geography, North America captured 34.84% share in 2025, yet Asia-Pacific is poised for the fastest regional growth at 8.11% during 2026-2031.
Note: Market size and forecast figures in this report are generated using Mordor Intelligence’s proprietary estimation framework, updated with the latest available data and insights as of 2026.
Market Trends and Insights
Drivers Impact Analysis of Logistics Automation Market*
| DRIVER | (~) % IMPACT ON CAGR FORECAST | GEOGRAPHIC RELEVANCE | IMPACT TIMELINE |
|---|---|---|---|
| Rapid E-commerce Parcel Volumes | +2.1% | Global, strongest in North America, Europe, Asia-Pacific urban corridors | Medium term (2-4 years) |
| Rising Labor Shortages and Wage Inflation | +1.8% | North America and Europe core, spillover to ASEAN manufacturing hubs | Short term (≤ 2 years) |
| Corporate Net-Zero Logistics Commitments | +1.2% | Global, led by EU mandates and North American voluntary pledges | Long term (≥ 4 years) |
| Customs-Free Micro-Fulfillment Zoning Laws | +0.7% | Select U.S., U.K., and Asian metropolitan areas | Medium term (2-4 years) |
| Convergence of 5G and Private-LTE in Warehouses | +1.0% | Early adoption in Asia-Pacific, Germany, and the United States | Medium term (2-4 years) |
| Open-Source ROS-2 Maturation | +0.6% | Global, strongest uptake among mid-tier integrators | Long term (≥ 4 years) |
| Source: Mordor Intelligence | |||


Rapid E-commerce Parcel Volumes
Parcel flows climbed 10% year over year to 121 billion shipments in 2025, locking in consumer expectations for same-day fulfillment. Retailers are therefore embedding 10,000-20,000 square-foot micro-fulfillment nodes inside existing stores, cutting last-mile distances by as much as 60%. Instacart's partnership with Fabric to deploy automated micro-fulfillment nodes across 100,000 retail locations illustrates how grocers are leveraging existing real estate to bypass the capital intensity of standalone dark stores.[1]Instacart, “Instacart and Fabric Micro-Fulfillment Partnership,” instacart.com Design focus is shifting from pallets per hour to parcels per square foot, forcing vendors to engineer denser storage grids, lighter robots, and software that optimizes vertical cube utilization. The result is a virtuous cycle, higher order density justifies incremental automation spend, which further compresses delivery windows and raises the competitive bar.
Rising Labor Shortages and Wage Inflation
Manufacturing and logistics vacancies are widening despite wage gains, with U.S. shortfalls projected to reach up to 3.8 million workers by 2030. Even after Amazon lifted entry wages to USD 22 per hour in 2024, seasonal hiring lagged demand, driving accelerated robot rollouts. In Japan, a declining working-age population pushes robot density to 399 units per 10,000 workers, compelling operators to automate or face throughput caps. Labor-driven ROI improvements are material: payback on automated storage and retrieval systems tightened from five years in 2020 to fewer than three years in 2025. Automation has moved from a cost-reduction lever to a precondition for sustaining throughput in tight labor markets.
Corporate Net-Zero Logistics Commitments
Prologis, the world's largest warehouse landlord with 1.2 billion square feet under management, committed to net-zero carbon emissions across its global portfolio by 2040, a target that requires electrifying material-handling equipment and optimizing building energy systems.[2]Prologis, “Net-Zero Carbon Commitment,” prologis.com Automated guided vehicles now compete on kilowatt-hours per pallet move, not just picks per hour. Early adopters report energy-intensity cuts exceeding 20% when electric equipment is paired with regenerative conveyors and optimized path planning. The EU’s Corporate Sustainability Reporting Directive makes Scope 3 disclosures mandatory, embeds sustainability metrics into vendor selection, and accelerates the shift toward software that tracks emissions at the task level. Vendors unable to quantify carbon performance risk are excluded from long-term framework contracts.
Convergence of 5G and Private-LTE Inside Warehouses
Private cellular networks reduce robot-to-edge latency below 10 milliseconds, enabling large fleets to share dense workspace without collisions. Operators cite return-on-investment horizons under two years when 5G supports mission-critical coordination for 200-plus robots. Hybrid Wi-Fi 6 and 5G architectures remain common, but low-latency 5G links allow control software to offload compute-intensive path planning to edge servers, freeing on-board processors and extending battery life. The connectivity upgrade also accelerates adoption of open-source middleware such as ROS-2, which depends on deterministic communication to synchronize distributed nodes. Collectively, these factors cut total cost of ownership for multi-vendor deployments and speed the shift toward software-centric automation.
Restraints Impact Analysis of Logistics Automation Market*
| RESTRAINT | (~) % IMPACT ON CAGR FORECAST | GEOGRAPHIC RELEVANCE | IMPACT TIMELINE |
|---|---|---|---|
| High Up-Front CAPEX | -1.3% | Global, acute for SMEs in North America and Europe | Short term (≤ 2 years) |
| Integration Complexity with Brown-Field IT | -1.1% | North America and Europe where legacy WMS dominates | Medium term (2-4 years) |
| Scarcity of Functional-Safety-Certified AI Chips | -0.5% | Global, most severe in automotive and industrial robotics | Medium term (2-4 years) |
| Rising Cyber-Insurance Premiums for OT | -0.4% | North America and Europe where ransomware targeting OT is escalating | Short term (≤ 2 years) |
| Source: Mordor Intelligence | |||
High Up-Front CAPEX
Large automated warehouses require USD 5 million to USD 25 million in upfront capital expenditure, a threshold that excludes most small and mid-sized logistics operators from deploying fully automated systems.[3]Supply Chain Dive, “Warehouse Automation Costs and ROI,” supplychaindive.com Finance committees frequently insist on sub-three-year payback, especially after several grocery retailers paused large projects when online volumes plateaued. Robotics-as-a-service models convert capex to opex but add 20-30% to lifetime cost, limiting uptake to sites with volatile demand. Consequently, market expansion skews toward tier-one 3PLs that can amortize investments across multiple client contracts, exacerbating a digital divide between large and small operators.
Integration Complexity with Brown-Field IT
Roughly 70% of warehouses in developed regions still run legacy warehouse-management systems that lack modern APIs. Retrofits require middleware, data translation layers, and phased cutovers that stretch project timelines up to 18 months and inflate costs by as much as 50%. Overlay execution software mitigates some risk but introduces new failure points and ongoing license fees. Operators therefore automate in zones-starting with replenishment or packing-rather than launching all-in transformations, trading faster ROI for incremental gains.
*Our forecasts treat driver/restraint impacts as directional, not additive. The impact forecasts reflect baseline growth, mix effects, and variable interactions.
Logistics Automation Market Segment Analysis
By Function:
Warehouse Strength Persists as Transportation Software AcceleratesWarehouse automation anchored 56.82% of global Logistics automation market revenue in 2025, underscoring its maturity and deep installed base. Cube-based storage, robotic picking arms, and high-speed sorters continue to dominate capex plans in high-SKU-velocity environments. Yet transportation automation, including fleet-management platforms and autonomous yard trucks, records the fastest forecast CAGR at 7.96%, reflecting heightened urgency to shrink empty-mile ratios and hit emission targets. The Logistics automation market continues to reward vendors that deliver real-time asset visibility across warehouse and road networks, blurring functional boundaries and enabling end-to-end optimization.
Software-driven load-matching launched in 2026 allows carriers to slash empty miles by double-digit percentages, pushing transportation automation up the priority list even among shippers with highly automated distribution centers. The Logistics automation market for transportation orchestration is set to grow steadily as carriers invest in AI-enabled route redesign. In parallel, warehouse operators are reallocating budgets from fixed conveyors to autonomous mobile robots that can shift with demand, reflecting growing preference for flexible capital deployment over peak-capacity builds.

By Automation Level:
Semi-Automated Leads while Fully-Automated Gains MomentumSemi-automated configurations accounted for 61.48% of 2025 spending, driven by facilities that keep humans in the loop for exception handling and fragile picks. However, fully automated systems are projected to post a 7.99% CAGR through 2031, driven by shrinking component costs and the arrival of safety-certified AI inference chips. Fully robotized micro-fulfillment centers already process up to 18,000 daily orders with fewer than 50 staff, proving the economic case where order density is high.
Operators recognize that fully-automated layouts require distinct architectural choices-redundant power, predictive analytics, and mission-critical networking-that raise capex by roughly 15-20% yet cut unplanned downtime below 1% of operating hours. As certification bottlenecks ease, the Logistics automation market share of fully-automated systems is expected to climb steadily, particularly in pharmaceuticals and electronics, where inventory value and regulatory controls justify premium investments.
By Component:
Hardware Dominates, Software Becomes the DifferentiatorHardware still represented 61.93% of global expenditure in 2025, covering autonomous mobile robots, automated storage and retrieval systems, conveyor lines, and vision sensors. Despite this dominance, software enjoys an 8.03% forecast CAGR as warehouse execution systems evolve into the nerve center that unifies multi-vendor fleets. Cloud-native orchestration platforms that balance order priorities, battery levels, and path congestion are becoming decisive in bid tenders, shifting competitive advantage from mechanical engineering prowess to algorithmic performance.
Services revenue is rising in parallel with software, reflecting greater reliance on predictive maintenance, remote monitoring, and digital-twin modeling. Vendors are moving from reactive break-fix contracts to outcome-based agreements in which penalties apply if throughput misses agreed thresholds. This evolution cements long-term customer relationships and locks recurring revenue into the Logistics automation market, reinforcing the strategic importance of software skills even inside traditionally hardware-centric integrators.

By End-User Industry:
E-commerce Leads, Grocery Retail AcceleratesE-commerce and parcel operators accounted for 38.73% of 2025 demand, driven by peak-season surges and customer promises of one-day delivery. The Logistics automation market segment with the largest share remains grocery retail, which is the fastest riser, posting an 8.05% CAGR as chains outfit compact back rooms with robotic storage to protect margins on online orders. Micro-fulfillment partnerships help store-based grocers match the speed of dark-store specialists while leveraging existing real estate footprints.
Cold-chain food and beverage operators are modernizing high-bay freezers with shuttle-based retrieval systems that cut door openings and, by extension, thermal loss. Apparel and fashion brands wrestling with seasonal SKU churn adopt goods-to-person systems that compress floor space and improve pick accuracy. Manufacturing warehouses, historically slower adopters, now embed automated storage directly into production scheduling software, aligning work-in-process flows with just-in-time philosophies and bringing another tranche of volume into the Logistics automation market.
Geography Analysis
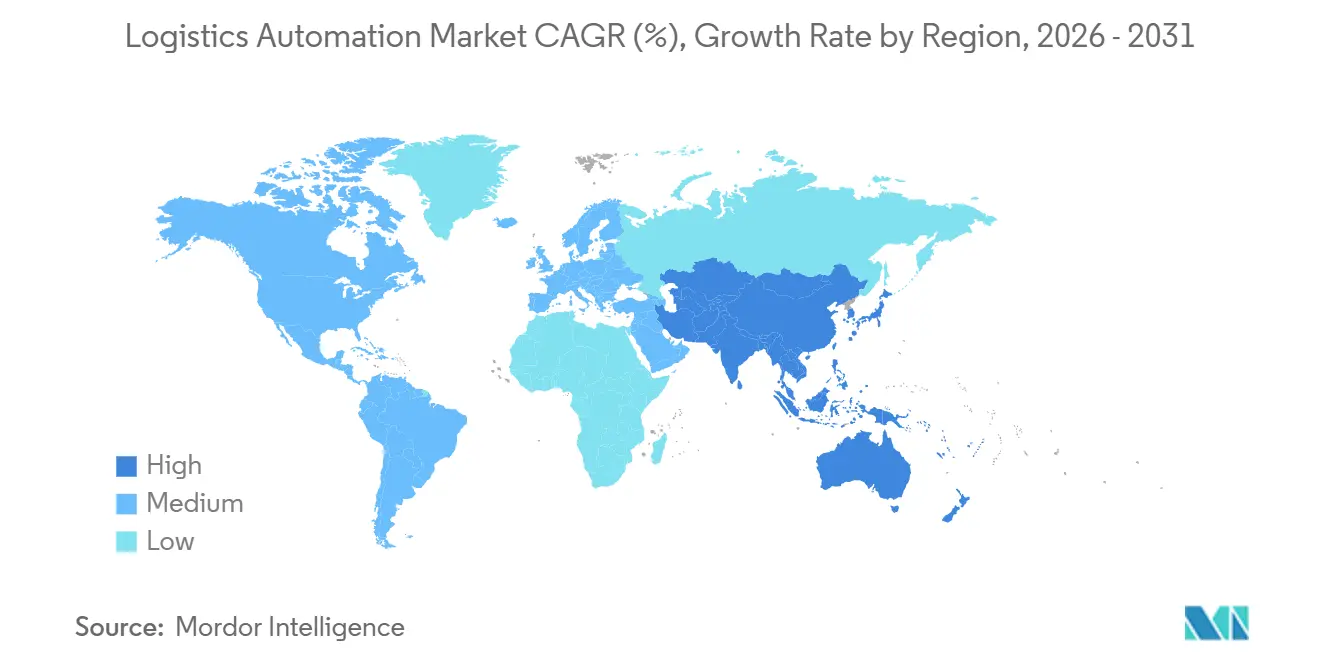
North America Logistics Automation Market
North America retained 34.84% of 2025 revenue, supported by high labor costs, deep e-commerce penetration, and a mature third-party logistics ecosystem that enables capex to be spread across multiple contracts. U.S. operators frequently pilot new automation technologies, giving the region an outsized influence on vendor roadmaps despite its smaller population than the Asia-Pacific. Strong venture-capital funding further accelerates product iteration, reinforcing the Logistics automation market’s innovation flywheel in the region.
APAC Logistics Automation Market
Asia-Pacific is the fastest-growing territory, posting an 8.11% CAGR through 2031 as China alone targets USD 25.6 billion in warehouse automation spend by 2030. High robot density in Japan, aggressive rollout of industrial 5G, and large-scale greenfield projects in India’s manufacturing corridors collectively drive sustained growth. Government logistics modernization programs align fiscal incentives with private investment, multiplying the addressable Logistics automation market across tier-one and tier-two cities.
EMEA and South America Logistics Automation Market
Europe, with a considerable market share, advances under the twin pressures of strict labor laws and carbon-reduction mandates. Germany’s Industry 4.0 initiative mainstreams digital twins and predictive analytics in warehouse design, while the United Kingdom’s urban zoning reforms encourage micro-fulfillment buildouts. South America, the Middle East and Africa are smaller today but enjoy tailwinds from near-shoring, energy diversification, and pharmaceutical cold-chain development, creating long-run upside for the Logistics automation market as infrastructure gaps close.

Regulatory Landscape
Regulation is increasingly steering logistics automation toward digitized documentation, standardized identifiers, and safer deployment of autonomous and AI-enabled systems. In the EU, the electronic Freight Transport Information (eFTI) framework is a practical driver of process automation because it requires acceptance of electronic freight data and is being operationalized through implementing acts, including Implementing Regulation (EU) 2025/2243 dated 6 November 2025, which specifies functional requirements for eFTI platforms and services. This supports investment in data capture (AIDC), integration layers, and workflow software that can generate and exchange compliant transport information across multimodal networks.
Safety, data quality, and AI governance are also tightening the compliance perimeter for warehouse and transportation automation. ISO standards used across logistics data and interoperability continue to evolve, including ISO 8000-119:2026 (published 16 January 2026) for transport unit identifier data quality and ISO 23355:2024 (published July 2024) for visibility data interchange among logistics information service providers. In the United States, autonomous freight and trucking automation faces a shifting policy backdrop, with legislation such as the BUILD America 250 Act (introduced 17 May 2026) indicating movement toward a federal review framework for autonomous commercial vehicles, a key consideration for fleets and autonomous yard and road applications that must navigate state-by-state operating rules while scaling deployments.
Value Chain Analysis
The logistics automation value chain spans component suppliers (robots, conveyors, ASRS, sensors, safety systems), connectivity and compute (edge servers, private LTE/5G, cybersecurity), and software layers (WMS, WES, fleet management, orchestration, visibility). System integrators and OEMs, including Dematic, Daifuku, Honeywell Intelligrated, and SSI SCHAEFER, design and deploy end-to-end solutions, while specialized software providers and visibility platforms support cross-node execution and data sharing. Demand comes from e-commerce and parcel operators, grocery retail micro-fulfillment, and large 3PLs that can amortize projects, with service partners delivering commissioning, maintenance, remote monitoring, and uptime-linked contracts.
Value capture is shifting toward orchestration, analytics, and network-level control as operators try to reduce empty miles and improve throughput under labor constraints and sustainability reporting pressure. Recent ecosystem moves reflect a shift from point solutions toward embedded platforms and longer-term partnerships. In June 2026, C.H. Robinson introduced its Lean AI Engineer capability to assess end-to-end supply chains quickly and surface improvement actions, and in June 2026 APSEZ expanded its partnership with Kaleris with an up to USD 100 million, two-phase program to automate and digitize processes across 15 container terminals. On the upstream side, R&D and co-innovation are moving closer to operators, as Colruyt Group and KION launched a new R&D center for next-generation supply chain robotics in July 2026, aligning product development with constraints such as brownfield integration and high-density storage.
Competitive Landscape
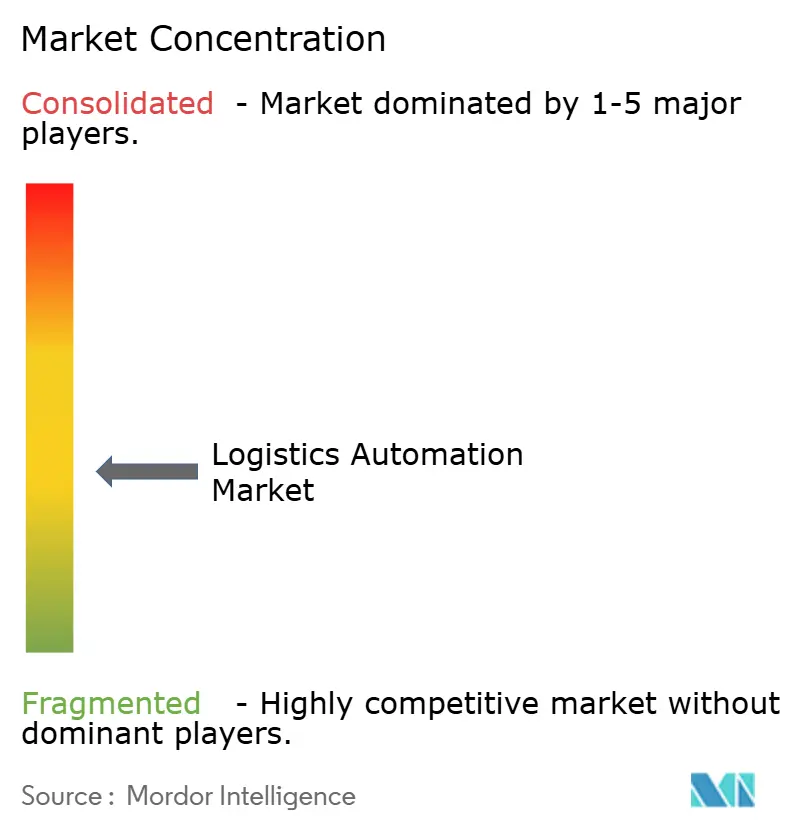
The Logistics automation market displays moderate concentration:,the ten largest integrators capture just under half of global revenue, leaving ample space for specialists and start-ups to flourish. Established players such as Dematic, Daifuku, and Honeywell bundle hardware, software, and multiyear service contracts, securing customer lock-in that can last two decades. Their scale enables global component sourcing and 24-hour support, but slows iterative product development cycles.
Pure-play robotics companies contest this advantage with modular platforms that can be deployed in weeks, not months. AutoStore’s cube-storage solution, now active in more than 50 countries, exemplifies how rapid deployment and tight space utilization resonate with e-commerce operators. Locus Robotics and Geek+ extend the model with robotics-as-a-service pricing, allowing customers to flex robot counts during demand peaks, thereby lowering financial barriers to entry in the Logistics automation market.
Technology remains the primary battleground. Vendors race to embed AI vision, energy-telemetry dashboards, and functional-safety certification to comply with ISO 13849 and IEC 61508. Unified orchestration software that can command mixed fleets from multiple vendors is emerging as a king-maker capability. Integrators unable to deliver seamless multi-robot management risk relegation to hardware subcontractor status, evidencing the strategic shift toward software-defined warehousing in the Logistics automation market.
Logistics Automation Industry Leaders
Daifuku Co., Ltd.
Honeywell International Inc.
Dematic Corp. (KION Group AG)
SSI SCHÄFER AG
Murata Machinery, Ltd.
- *Disclaimer: Major Players sorted in no particular order
Logistics Automation Market Companies Covered in this Report
- Dematic Corp. (KION Group AG)
- Daifuku Co., Ltd.
- Honeywell International Inc.
- Jungheinrich AG
- Murata Machinery, Ltd.
- KNAPP AG
- TGW Logistics Group GmbH
- Kardex Holding AG
- Mecalux, S.A.
- BEUMER Group GmbH & Co. KG
- SSI SCHAFER AG
- Vanderlande Industries B.V.
- WITRON Logistik + Informatik GmbH
- Interroll Holding AG
- GreyOrange Pte Ltd.
- Locus Robotics Corp.
- Geek+ Technology Co., Ltd.
- Ocado Group plc (Ocado Intelligent Automation)
- AutoStore Holdings Ltd.
- Exotec SAS
- Fetch Robotics Inc. (Zebra Technologies)
- Korber Supply Chain GmbH
- Cimcorp Oy
- Manhattan Associates Inc.
- Swisslog Holding AG
- Siemens Logistics GmbH
- Bastian Solutions LLC
- Fives Group
- Hai Robotics Co., Ltd.

Market Opportunities and Future Outlook
Large, automated logistics infrastructure projects create whitespace for suppliers that can deliver software-defined orchestration, high-density storage, and automation that operates reliably in regulated, high-throughput environments. In March 2026, Maersk opened a 1.1 million square feet fully automated global and regional distribution center in Singapore with an investment exceeding S$200 million, pointing to demand for integrated automation stacks that combine material handling hardware with execution software and visibility. Air cargo also provides a visible opportunity for automation providers: in June 2026, Lufthansa Cargo began operations at the first phase of its LCCevo project at Frankfurt Airport, including a 42-meter-high automated high-bay warehouse, and in July 2026, Turkish Cargo selected Lodige Industries for automated handling technology tied to phase two expansion of its SMARTIST terminal in Istanbul.
Ports and multimodal nodes are another investment pocket where AI and automation are being embedded into terminal operations and container flow management. In July 2026, Tanco subsidiary Midports Holdings broke ground in Malaysia on a smart AI container port project with an estimated USD 850 million infrastructure investment, while APSEZs up to USD 100 million expansion with Kaleris (June 2026) underscores how terminal operators are funding multi-site automation programs rather than isolated pilots. Across these nodes, opportunity clusters around interoperable data exchange (including support for initiatives such as eFTI in Europe), cyber-resilient OT architectures as fleets and terminals digitize, and integration toolkits that shorten the 18-month retrofit timelines often seen in brownfield warehouse IT.
Recent Industry Developments in Logistics Automation Market
- June 2026: Dematic announced an automated solution implementation for Pattison Food Group at its 485,000-square-foot ambient grocery facility in Langley, British Columbia. The project reinforces demand for high-throughput grocery automation and highlights integrators ability to scale micro-fulfillment and store-replenishment supporting systems beyond pilot sites.
- December 2025: AutoStore secured a USD 200 million order from a North American 3PL for a 600,000-square-foot cube-storage installation designed to operate 400 robots. The deal pointed to continued appetite for high-density storage that lifts throughput per square foot and strengthened the position of modular goods-to-person systems in large DC bids.
- July 2024: ISO published ISO 23355:2024 covering visibility data interchange among logistics information service providers. The standard supports more consistent data sharing across multi-party transport and warehousing workflows, helping software and platform vendors reduce custom integration burden in end-to-end automation deployments.


Logistics Automation Market Report Scope and Research Methodology
Market Definition and Coverage
For this study, the logistics automation market is defined as revenue generated from using automation hardware and logistics software to improve how goods are are stored, picked, moved, tracked, and shipped across warehouses and transportation networks.
Scope exclusions: pure manual logistics operations with no automation layer, and general IT spending that is not used for logistics execution, are excluded.
Segments Covered in This Report
- By Function
- Warehouse Automation
- By Component
- Hardware
- Mobile Robots
- Automated Storage and Retrieval Systems
- Automated Sorting Systems
- Conveyor Systems
- Automatic Identification and Data Collection (AIDC)
- Order Picking
- Software
- Services
- Hardware
- By Component
- Transportation Automation
- By Component
- Hardware
- Software
- Services
- By Component
- Warehouse Automation
- By Automation Level
- Fully-Automated Systems
- Semi-Automated Systems
- By Component
- Hardware
- Software
- Services
- By End-User Industry
- E-commerce and Parcel
- Food and Beverage
- Grocery Retail
- Apparel and Fashion
- Manufacturing
- Other End-User Industries
- By Geography
- North America
- United States
- Canada
- Mexico
- South America
- Brazil
- Argentina
- Rest of South America
- Europe
- Germany
- United Kingdom
- France
- Italy
- Spain
- Rest of Europe
- Asia-Pacific
- China
- Japan
- India
- South Korea
- ASEAN
- Rest of Asia-Pacific
- Middle East
- Saudi Arabia
- United Arab Emirates
- Rest of Middle East
- Africa
- South Africa
- Nigeria
- Egypt
- Rest of Africa
- North America
Data Sources, Market Sizing, and Validation
Desk Research
Desk research started with public references that anchor demand signals and operating activity for logistics and warehousing, such as U.S. Census Bureau releases for wholesale and retail trade, and Bureau of Labor Statistics series on productivity and employment. Shipment and trade context was also checked using sources such as UN Comtrade, and we cross checked port and airport statistics published by national transport agencies.
To keep the automation angle grounded, we reviewed ISO and IEC standards notes on industrial automation terminology, and selected peer reviewed articles on warehouse automation performance metrics and robotics adoption. Company annual reports, earnings decks, and credible press were used to map product positioning and typical deal structures, and then a paid subscription for company financials and news intelligence filled gaps where public disclosures were limited. This list is illustrative only, and many other sources were also consulted for collection, validation, and clarification.
Primary Interviews and Surveys
Primary work focused on interviews and short surveys with automation solution providers, systems integrators, and logistics users across retail and e-commerce, manufacturing, and parcel networks. Respondent input was used to confirm what is counted as logistics automation revenue, validate average selling price movement for key systems, and sanity check adoption timing by region so the assumptions stayed realistic.
Distribution of primary research fieldwork respondents
| Company type | Respondent position | Region |
|---|---|---|
| Top tier: 34% | CXOs: 14% | APAC: 50% |
| Mid tier: 50% | Functional/Unit leaders: 35% | EMEA: 32% |
| Smaller Players: 16% | Managers: 51% | Americas: 18% |
Market-Sizing & Forecasting
Sizing was built using a top-down approach where warehousing and transportation activity indicators are reconstructed into an addressable automation spend pool, and then filtered by automation penetration and typical solution mix. Once the first cut was ready, we corroborated it with selective bottom-up approximations from supplier revenue splits, channel checks, and sampled ASP multiplied by observed unit volumes for common systems.
Inputs were selected to reflect how logistics automation is actually bought and deployed, including warehouse square footage additions and new distribution center starts, e-commerce parcel growth and service level targets, labor cost pressure in warehousing, automation project payback expectations, and hardware and software mix shifts between semi-automated and fully automated sites. Forecasts relied mainly on scenario analysis supported by interview feedback, and were refined using trend smoothing on a few stable series such as parcel volumes and warehouse construction. Where bottom-up revenue splits were incomplete, gaps were handled through conservative share ranges and re-checked against end user investment patterns before finalizing totals.
Data Validation & Update Cycle
Outputs were cross checked against independent signals such as logistics capex commentary, automation order backlogs disclosed in filings, and regional facility build trends, and then reviewed for sharp year over year jumps that did not match the input drivers. Any large variance triggered a second pass on currency timing, ASP changes, and penetration assumptions, and follow-up calls were done when explanations were not clean.
Before sign-off, the model and narrative go through a multi step internal review so definitions, assumptions, and math stay consistent. The report is refreshed annually, and interim updates are made when major events change the demand outlook or delivery capacity. Right before delivery, a final update sweep is completed so clients receive the latest view available.
Mordor Intelligence's Logistics Automation Market Sizing Compared With Other Published Estimates
Published market values for logistics automation can look far apart because firms often count different revenue pools, apply different adoption timing, and use different currency and inflation handling across multi-region estimates.
The main gap comes from whether adjacent industrial automation and general IT spend is counted. Mordor Intelligence treats logistics automation as only the hardware, software, and services directly used to run warehouse and transportation logistics workflows, which leaves out broader factory automation and non-execution IT budgets.
Benchmark comparison
| Source | Market Size | Gaps in Research Methodology |
|---|---|---|
| Mordor Intelligence | USD 81.65 B (2025) | |
| Global Consultancy A | USD 34.90 B (2024) | Uses an earlier base year and a narrower counted scope that appears to emphasize discrete solution categories, which can exclude parts of services revenue and cross-function logistics software embedded in broader programs. |
| Trade Journal B | USD 73.37 B (2025) | Applies a faster-growth framing with broader inclusions and different timing for currency conversion, which can lift the total when adjacent automation spend is blended into logistics operations. |
The table shows that most of the spread is explained by what is included in the revenue pool and the year used for currency and inflation assumptions. By keeping the inputs tied to clear activity drivers like warehouse build-outs, parcel volumes, and automation penetration, the estimate stays repeatable and easier to audit when new information becomes available.


Key Questions Answered in the Report
How large is the Logistics automation market in 2026?
The sector is valued at USD 90.72 billion in 2026, on track to compound at 7.91% annually through 2031.
Which functional area is growing fastest?
Transportation automation, which covers fleet-management software and autonomous yard trucks, posts the quickest advance with a 7.96% CAGR forecast for 2026-2031.
What drives grocery retailers toward automation?
Grocery chains pursue micro-fulfillment robots to lift online-order margins and meet sub-two-hour delivery promises, pushing the segment toward an 8.05% CAGR.
Why are private 5G networks important in warehouses?
Private 5G lowers latency to under 10 milliseconds, enabling centralized orchestration of large multi-vendor robot fleets and shortening return-on-investment timelines.
How does high capex restrain adoption?
Fully automated projects can demand USD 5-25 million up front, and many mid-market operators require payback in under three years, limiting large-scale rollouts.
Which region will contribute most to future growth?
Asia-Pacific leads expansion, with an 8.11% CAGR forecast, fueled by China’s aggressive automation spending targets and Japan’s high robot density.d autonomous yard vehicles, unlocking end-to-end optimization.
Page last updated on:





